| Param | Original file | Final file |
|---|---|---|
| Filename | modeM0/AS1A05_208T01_9000004870_34102cztM0_level2.evt | modeM0/AS1A05_208T01_9000004870_34102cztM0_level2_quad_clean.evt |
| Size (bytes) | 2,835,144,000 | 415,186,560 |
| Size | 2.6 GB | 396.0 MB |
| Events in quadrant A | 13,515,010 | 2,732,348 |
| Events in quadrant B | 20,216,471 | 2,694,715 |
| Events in quadrant C | 18,180,095 | 2,693,061 |
| Events in quadrant D | 31,979,067 | 2,437,304 |
| Mode SS | |||
|---|---|---|---|
| Quadrant | BADHDUFLAG | Total packets | Discarded packets |
| A | 0 | 598 | 0 |
| B | 0 | 598 | 0 |
| C | 0 | 598 | 0 |
| D | 0 | 598 | 0 |
| Mode M9 | |||
|---|---|---|---|
| Quadrant | BADHDUFLAG | Total packets | Discarded packets |
| A | 0 | 94 | 0 |
| B | 0 | 94 | 0 |
| C | 0 | 94 | 0 |
| D | 0 | 94 | 0 |
| Mode M0 | |||
|---|---|---|---|
| Quadrant | BADHDUFLAG | Total packets | Discarded packets |
| A | 0 | 59484 | 6 |
| B | 0 | 78923 | 5 |
| C | 0 | 71933 | 5 |
| D | 0 | 115339 | 5 |
| Quadrant | Total seconds | Saturated seconds | Saturation percentage |
|---|---|---|---|
| A | 29349 | 35 | 0.119254% |
| B | 29349 | 1832 | 6.242121% |
| C | 29349 | 762 | 2.596341% |
| D | 29349 | 3707 | 12.630754% |
Noise dominated data is calculated using 1-second bins in cleaned event files. If a bin has >2000 counts, and if more than 50% of those come from <1% of pixels, then it is considered to be noise-dominated and hence unusable.
| Quadrant | # 1 sec bins | Bins with >0 counts | Bins with >2000 counts | High rate bins dominated by noise | Noise dominated (total time) | Noise dominated (detector-on time) | Marked lightcurve |
|---|---|---|---|---|---|---|---|
| A | 44845 | 29355 | 14 | 14 | 0.03% | 0.05% | 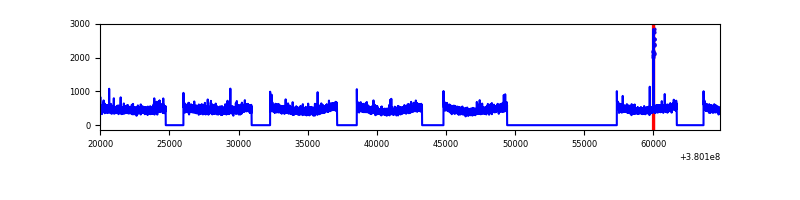 |
| B | 44845 | 29355 | 1258 | 1258 | 2.81% | 4.29% | 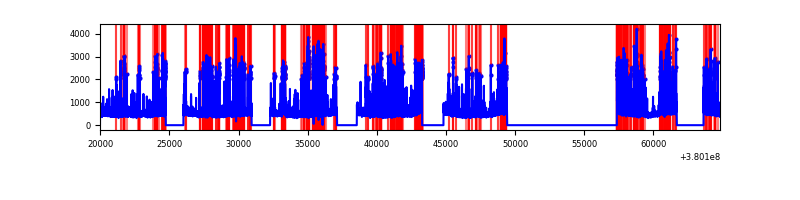 |
| C | 44845 | 29355 | 627 | 627 | 1.40% | 2.14% | 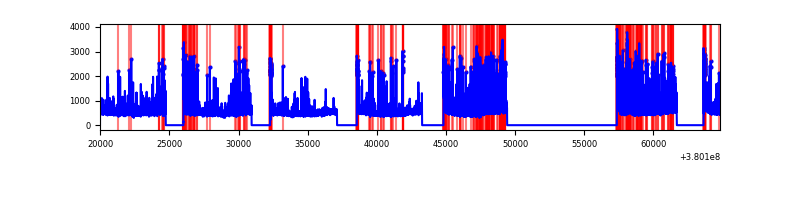 |
| D | 44845 | 29355 | 3688 | 3688 | 8.22% | 12.56% | 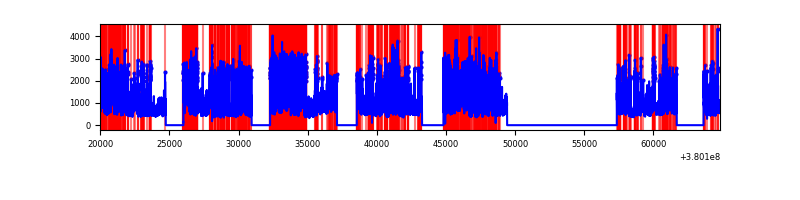 |
Top three noisy pixels from each quadrant. If the there are fewer than three noisy pixels in the level2.evt file, extra rows are filled as -1
| Pixel properties | Quadrant properties | ||||||
|---|---|---|---|---|---|---|---|
| Quadrant | DetID | PixID | Counts | Sigma | Mean | Median | Sigma |
| A | 10 | 83 | 68766 | 95.67 | 3456 | 3391 | 683.4 |
| A | 13 | 254 | 55314 | 75.98 | 3456 | 3391 | 683.4 |
| A | 13 | 6 | 49461 | 67.42 | 3456 | 3391 | 683.4 |
| B | 5 | 172 | 6038114 | 9507.5 | 3357 | 3267 | 634.7 |
| B | 4 | 232 | 295830 | 460.91 | 3357 | 3267 | 634.7 |
| B | 0 | 189 | 146877 | 226.25 | 3357 | 3267 | 634.7 |
| C | 0 | 10 | 2815139 | 3646.6 | 3344 | 3379 | 771.1 |
| C | 15 | 214 | 1237257 | 1600.23 | 3344 | 3379 | 771.1 |
| C | 14 | 254 | 590677 | 761.67 | 3344 | 3379 | 771.1 |
| D | 7 | 223 | 7444078 | 9556.19 | 3199 | 3113 | 778.7 |
| D | 8 | 195 | 5889664 | 7559.9 | 3199 | 3113 | 778.7 |
| D | 13 | 249 | 1846612 | 2367.54 | 3199 | 3113 | 778.7 |
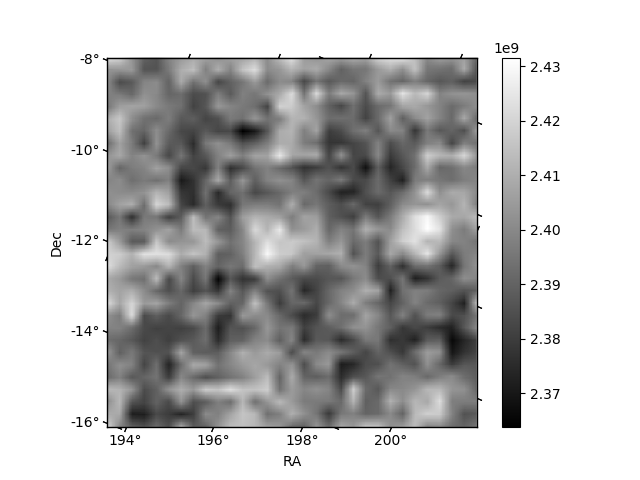
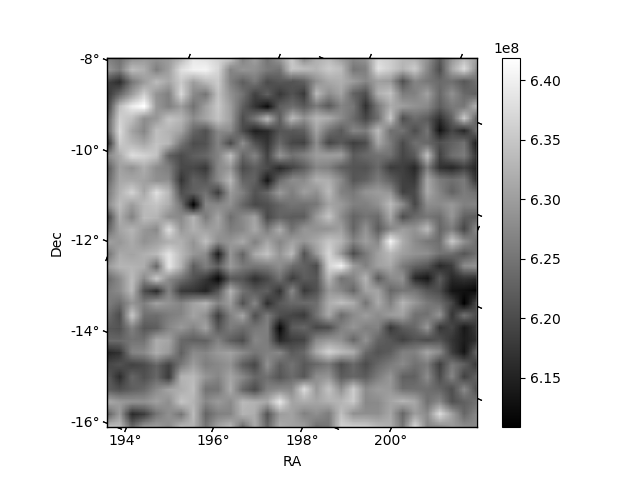
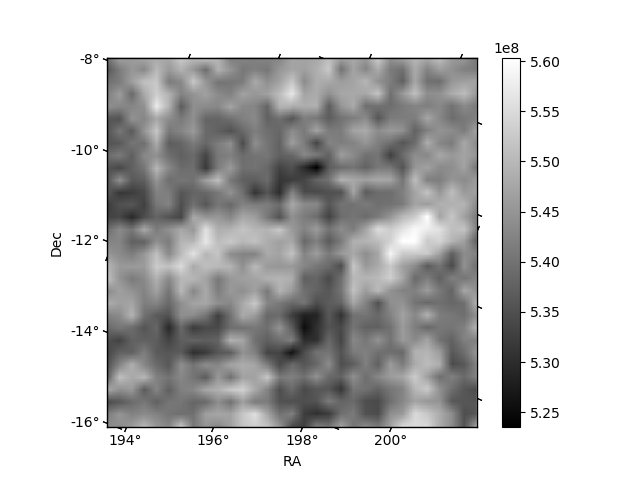
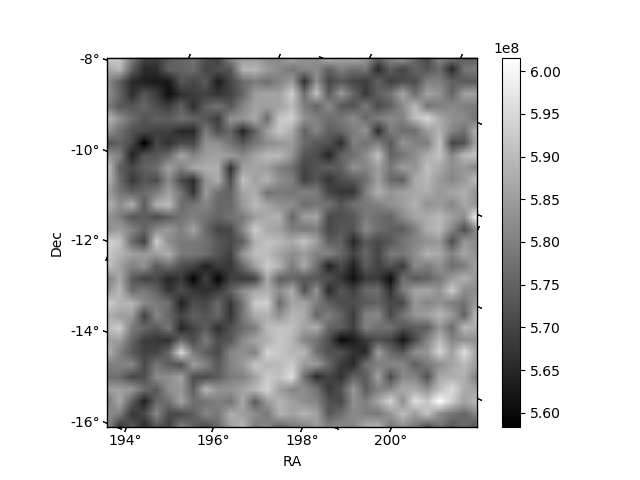
Histogram calculated using DETX and DETY for each event in the final _common_clean file
| Quadrant A | 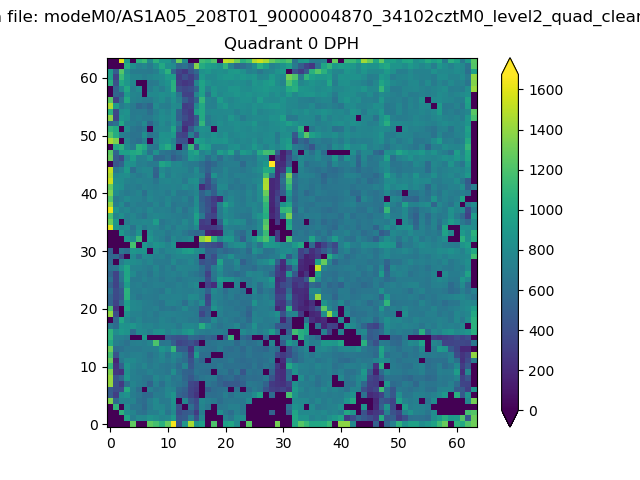 |
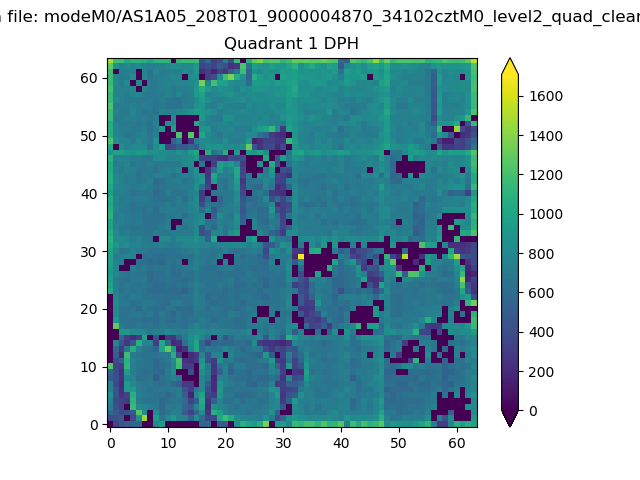 |
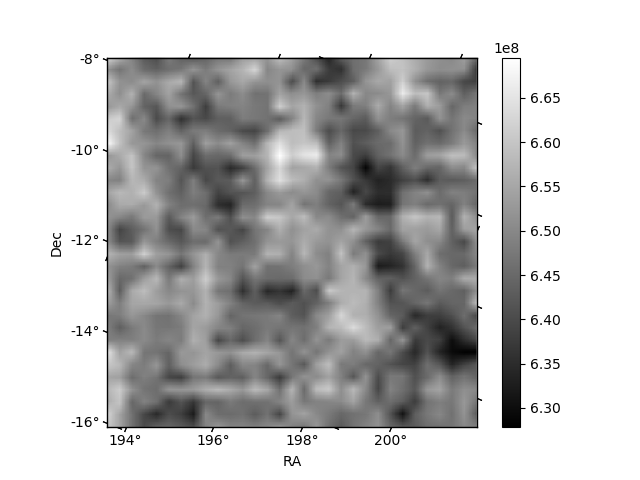
Quadrant B |
|---|---|---|---|
| Quadrant D | 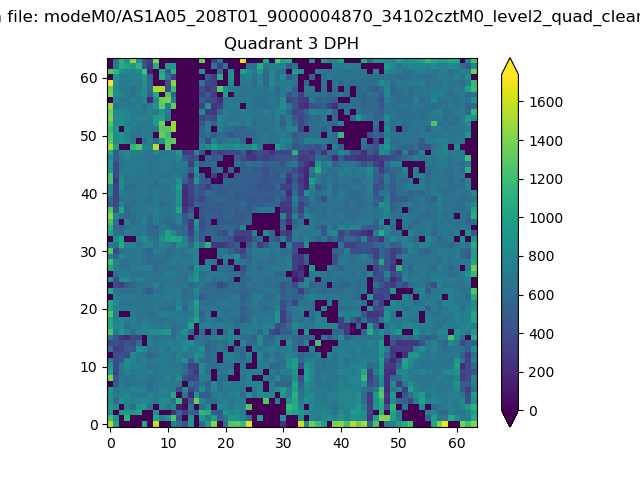 |
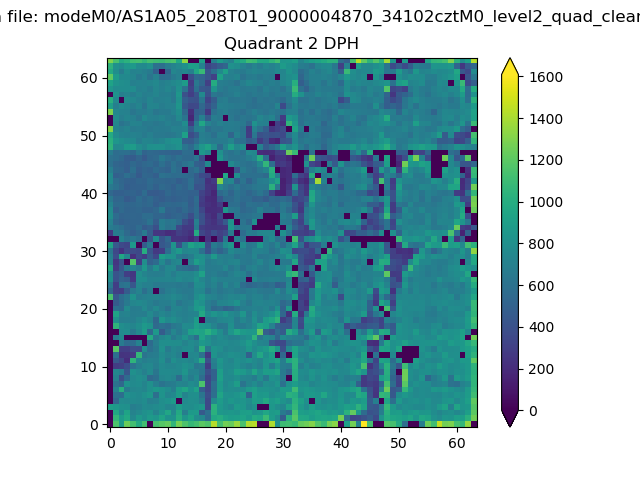 |
Quadrant C |
| Plot type | Count rate plots | Images |
|---|---|---|
| Comparison with Poisson distribution Blue bars denote a histogram of data divided into 1 sec bins. Red curve is a Poisson curve with rate = median count rate of data. |
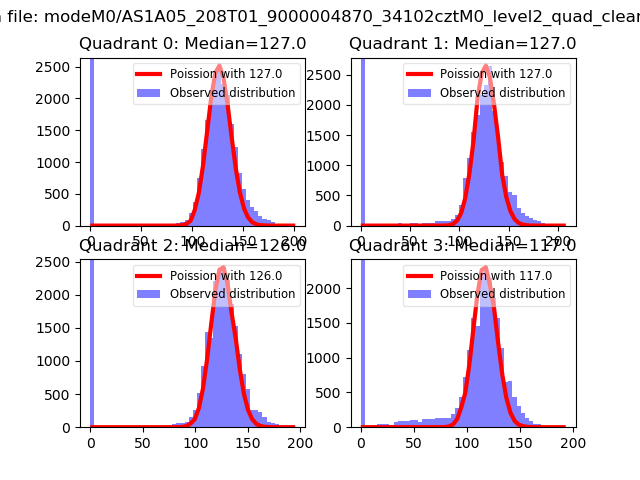 |
 |
| Quadrant-wise count rates Data is divided into 100 sec bins |
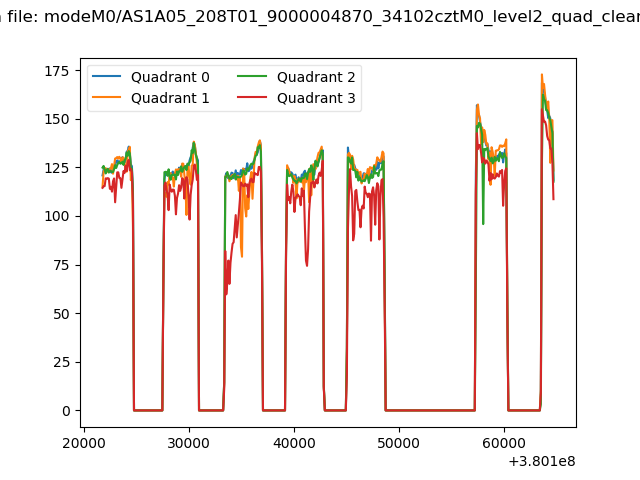 |
|
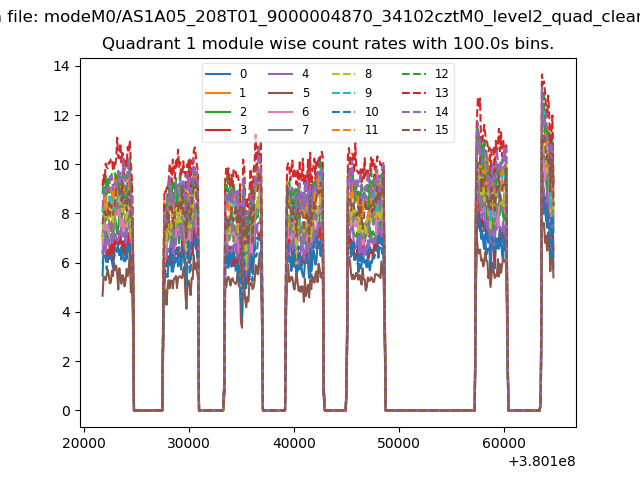
| Module-wise count rates for Quadrant A Data is divided into 100 sec bins |
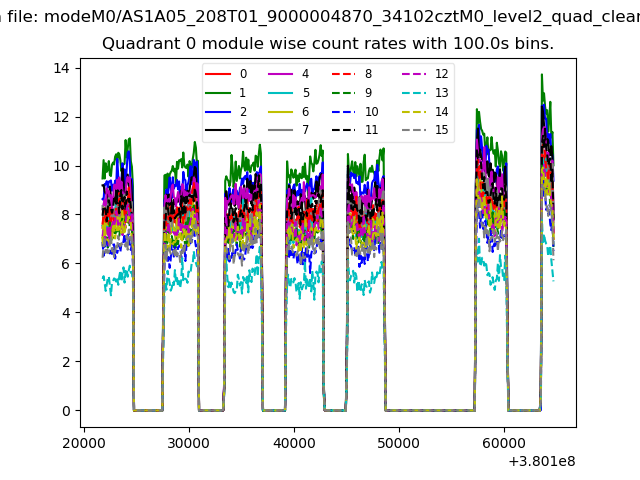 |
 |
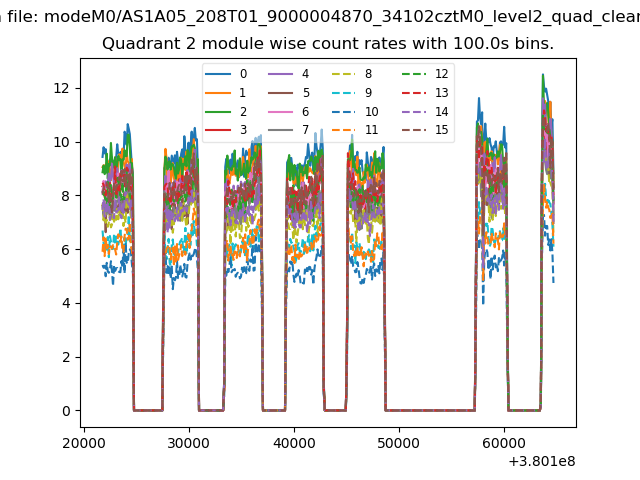
| Module-wise count rates for Quadrant B Data is divided into 100 sec bins |
 |
 |
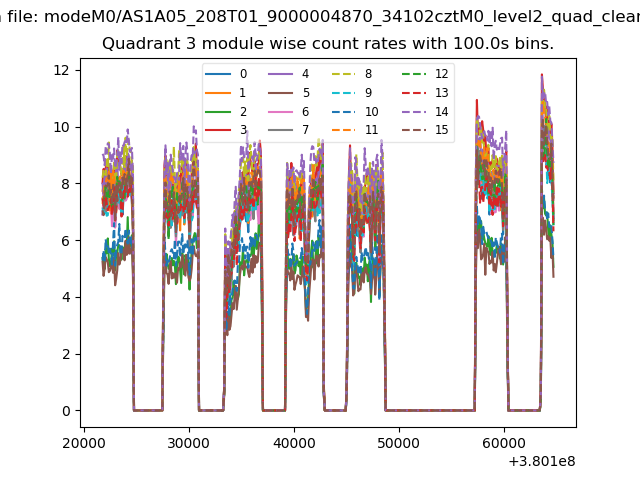
| Module-wise count rates for Quadrant C Data is divided into 100 sec bins |
 |
 |
| Module-wise count rates for Quadrant D Data is divided into 100 sec bins |
 |
 |
| Parameter | Plot |
|---|---|
| CZT HV Monitor | 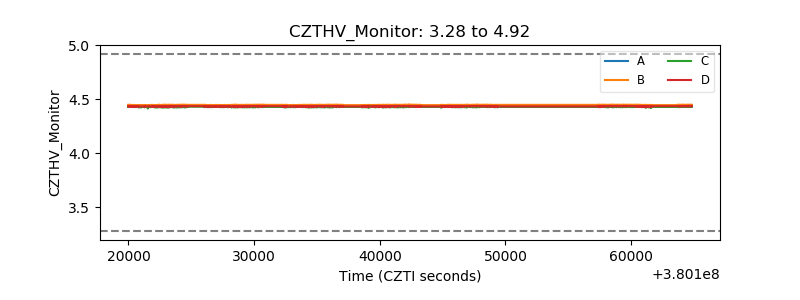 |
| D_VDD | 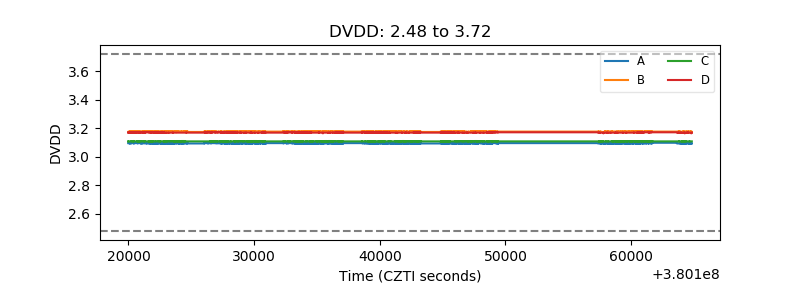 |
| Temperature 1 |  |
| Veto HV Monitor | 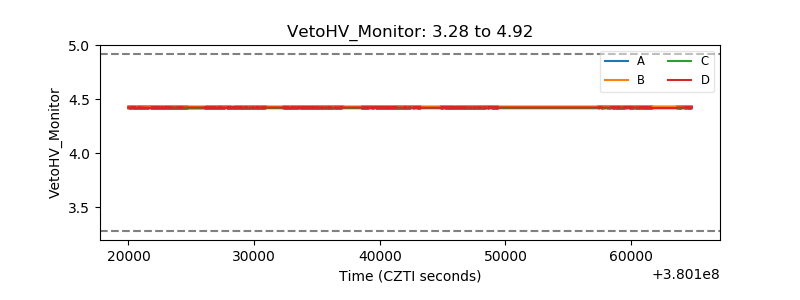 |
| Veto LLD | 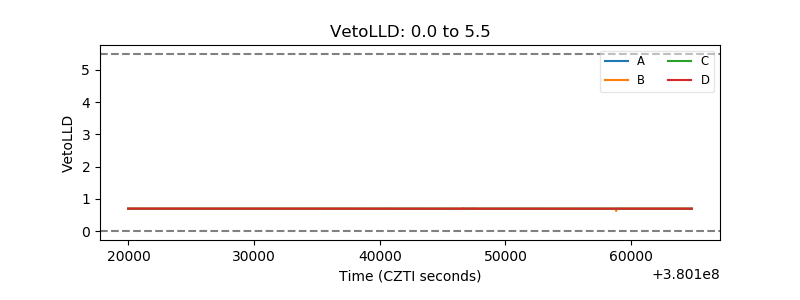 |
| Alpha Counter | 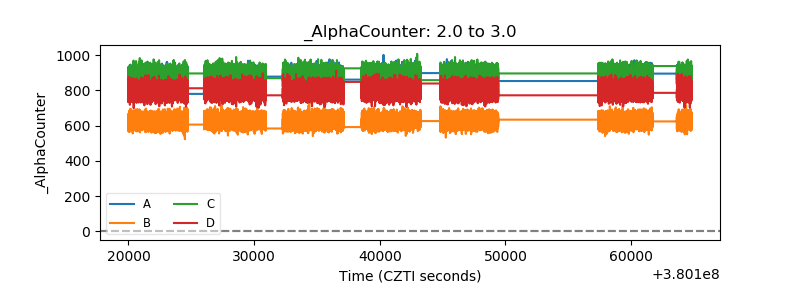 |
| _CPM_Rate | 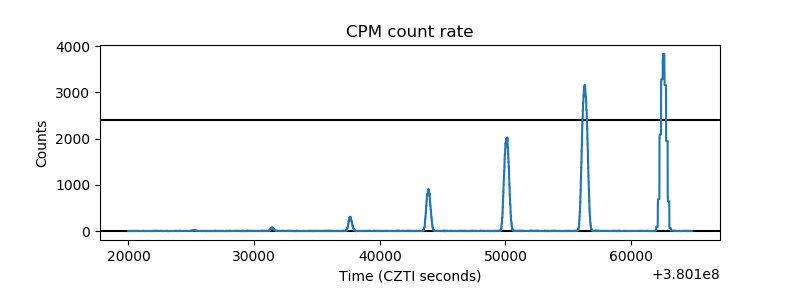 |
| CZT Counter | 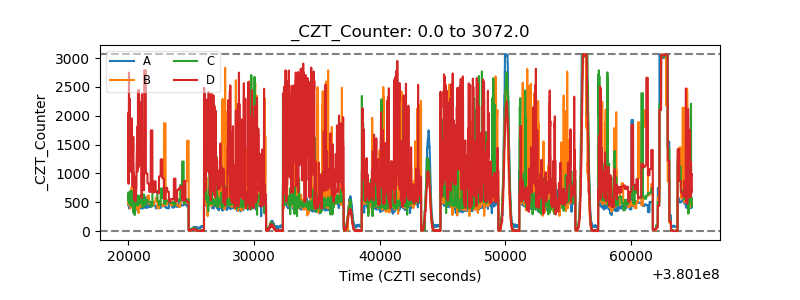 |
| +2.5 Volts monitor |  |
| +5 Volts monitor |  |
| _ROLL_ROT | 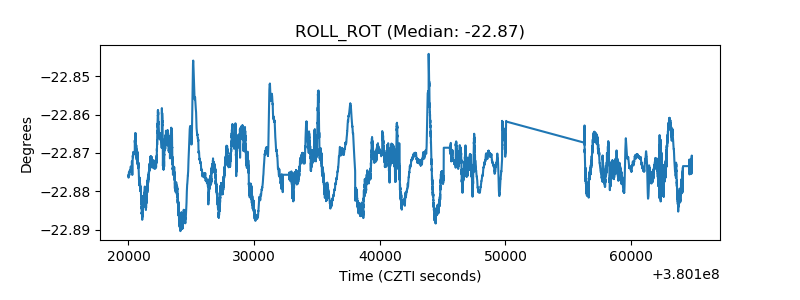 |
| _Roll_DEC | 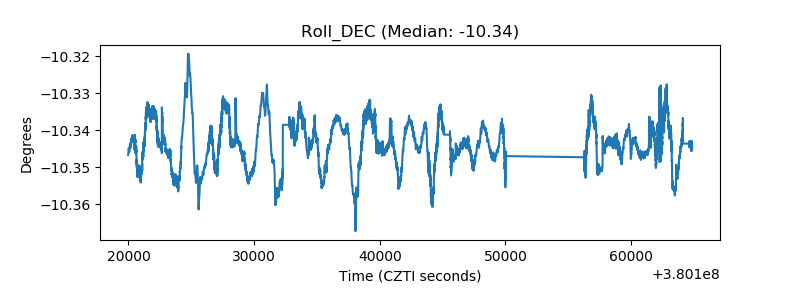 |
| _Roll_RA | 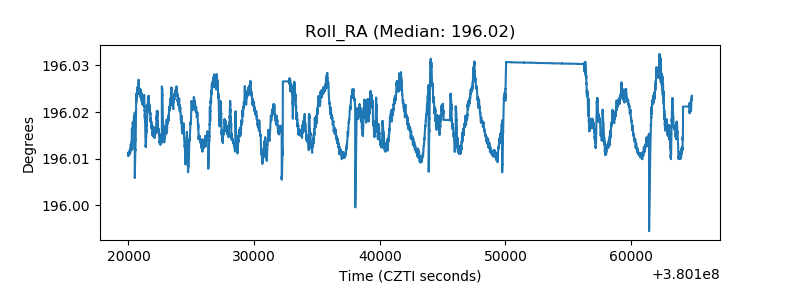 |
| Veto Counter | 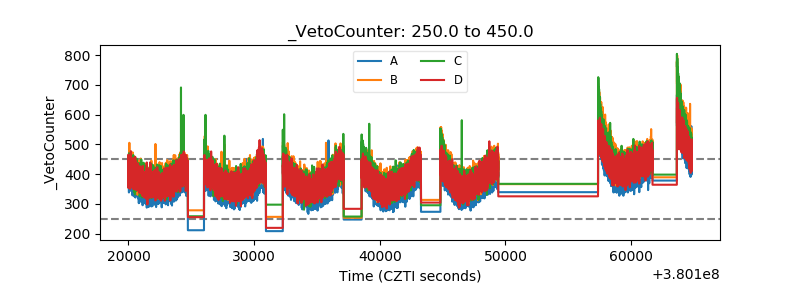 |