| Param | Original file | Final file |
|---|---|---|
| Filename | modeM0/AS1A05_208T01_9000004870_34103cztM0_level2.evt | modeM0/AS1A05_208T01_9000004870_34103cztM0_level2_quad_clean.evt |
| Size (bytes) | 512,867,520 | 82,281,600 |
| Size | 489.1 MB | 78.5 MB |
| Events in quadrant A | 2,613,644 | 544,612 |
| Events in quadrant B | 3,764,542 | 550,852 |
| Events in quadrant C | 4,141,459 | 525,855 |
| Events in quadrant D | 4,654,880 | 500,399 |
| Mode SS | |||
|---|---|---|---|
| Quadrant | BADHDUFLAG | Total packets | Discarded packets |
| A | 0 | 108 | 0 |
| B | 0 | 108 | 0 |
| C | 0 | 108 | 0 |
| D | 0 | 108 | 0 |
| Mode M9 | |||
|---|---|---|---|
| Quadrant | BADHDUFLAG | Total packets | Discarded packets |
| A | 0 | 23 | 0 |
| B | 0 | 23 | 0 |
| C | 0 | 23 | 0 |
| D | 0 | 24 | 0 |
| Mode M0 | |||
|---|---|---|---|
| Quadrant | BADHDUFLAG | Total packets | Discarded packets |
| A | 0 | 10831 | 3 |
| B | 0 | 14669 | 2 |
| C | 0 | 15866 | 2 |
| D | 0 | 17412 | 2 |
| Quadrant | Total seconds | Saturated seconds | Saturation percentage |
|---|---|---|---|
| A | 5280 | 7 | 0.132576% |
| B | 5280 | 290 | 5.492424% |
| C | 5280 | 311 | 5.890152% |
| D | 5280 | 235 | 4.450758% |
Noise dominated data is calculated using 1-second bins in cleaned event files. If a bin has >2000 counts, and if more than 50% of those come from <1% of pixels, then it is considered to be noise-dominated and hence unusable.
| Quadrant | # 1 sec bins | Bins with >0 counts | Bins with >2000 counts | High rate bins dominated by noise | Noise dominated (total time) | Noise dominated (detector-on time) | Marked lightcurve |
|---|---|---|---|---|---|---|---|
| A | 7343 | 5281 | 0 | 0 | 0.00% | 0.00% | 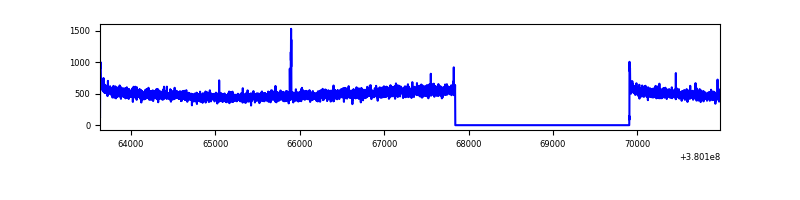 |
| B | 7343 | 5281 | 184 | 184 | 2.51% | 3.48% | 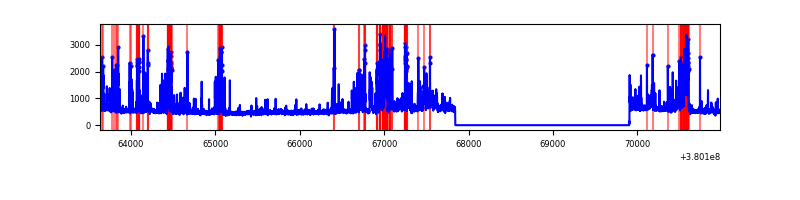 |
| C | 7343 | 5281 | 269 | 269 | 3.66% | 5.09% | 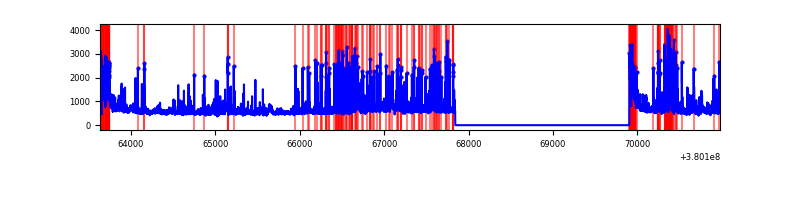 |
| D | 7343 | 5281 | 159 | 159 | 2.17% | 3.01% | 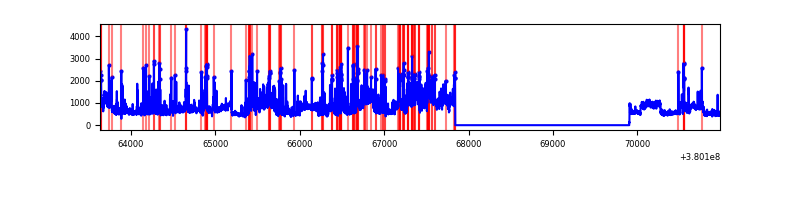 |
Top three noisy pixels from each quadrant. If the there are fewer than three noisy pixels in the level2.evt file, extra rows are filled as -1
| Pixel properties | Quadrant properties | ||||||
|---|---|---|---|---|---|---|---|
| Quadrant | DetID | PixID | Counts | Sigma | Mean | Median | Sigma |
| A | 10 | 83 | 20034 | 144.39 | 667 | 656 | 134.2 |
| A | 13 | 6 | 13568 | 96.21 | 667 | 656 | 134.2 |
| A | 13 | 254 | 9080 | 62.77 | 667 | 656 | 134.2 |
| B | 5 | 172 | 906150 | 7366.28 | 654 | 639 | 122.9 |
| B | 0 | 199 | 114074 | 922.79 | 654 | 639 | 122.9 |
| B | 0 | 230 | 50746 | 407.62 | 654 | 639 | 122.9 |
| C | 0 | 10 | 850606 | 5741.64 | 640 | 647 | 148.0 |
| C | 14 | 254 | 385120 | 2597.19 | 640 | 647 | 148.0 |
| C | 15 | 214 | 227566 | 1532.88 | 640 | 647 | 148.0 |
| D | 8 | 195 | 1152804 | 7376.99 | 639 | 622 | 156.2 |
| D | 2 | 250 | 484193 | 3096.12 | 639 | 622 | 156.2 |
| D | 13 | 249 | 212645 | 1357.5 | 639 | 622 | 156.2 |
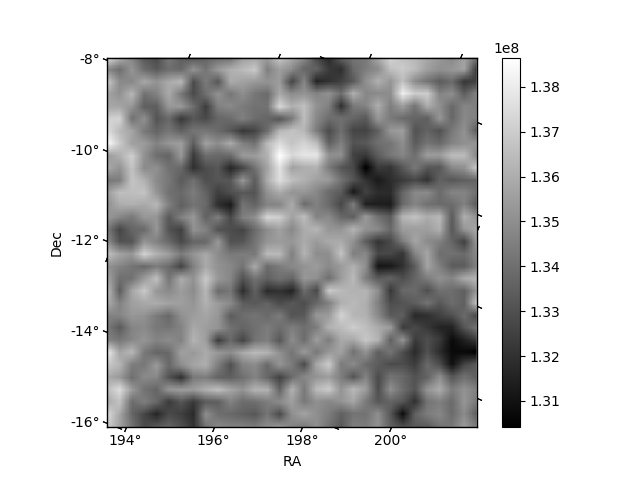
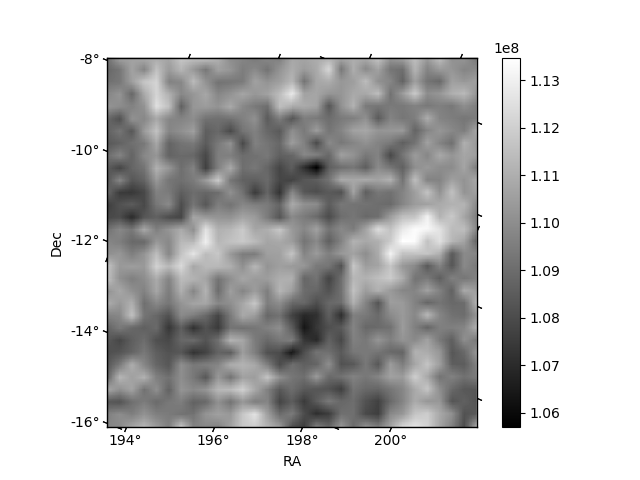
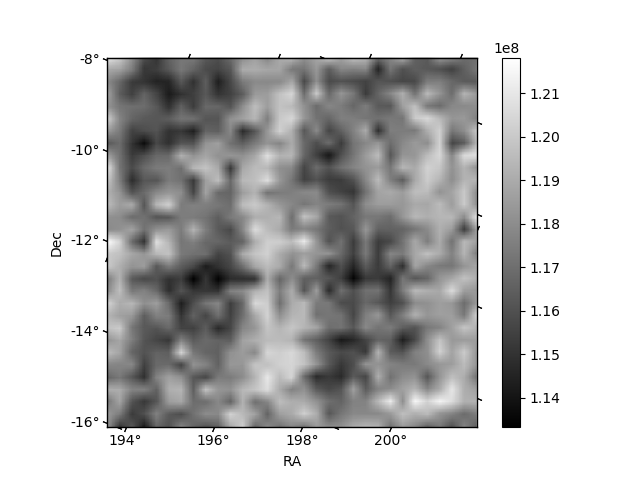
Histogram calculated using DETX and DETY for each event in the final _common_clean file
| Quadrant A | 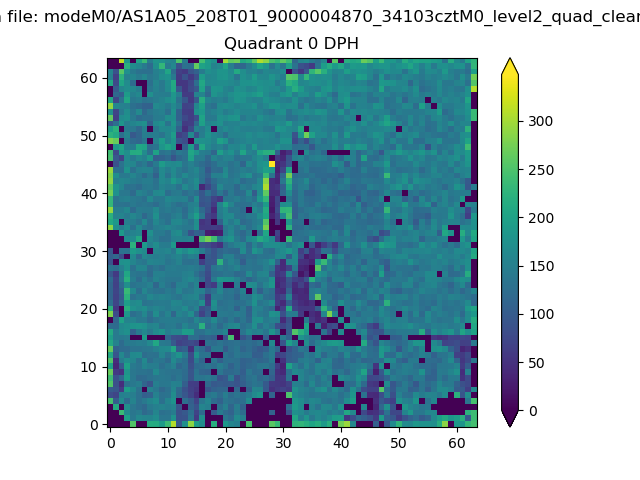 |
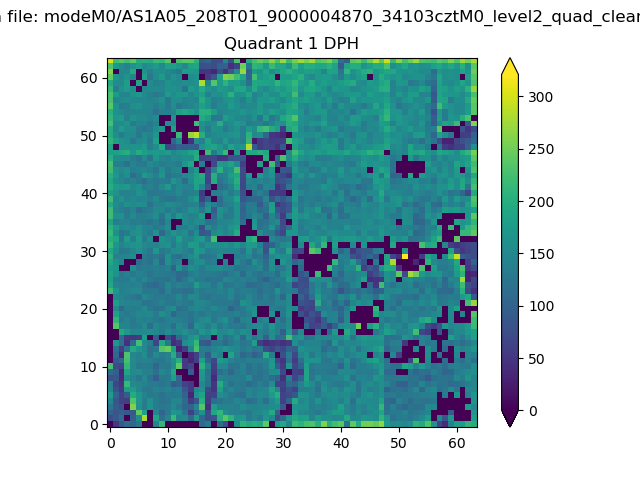 |
Quadrant B |
|---|---|---|---|
| Quadrant D | 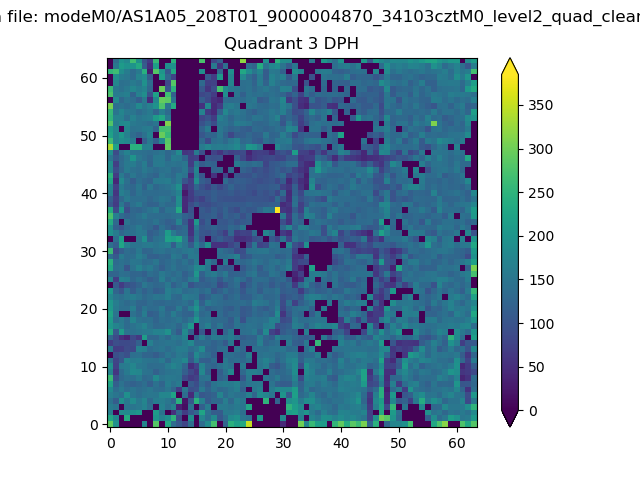 |
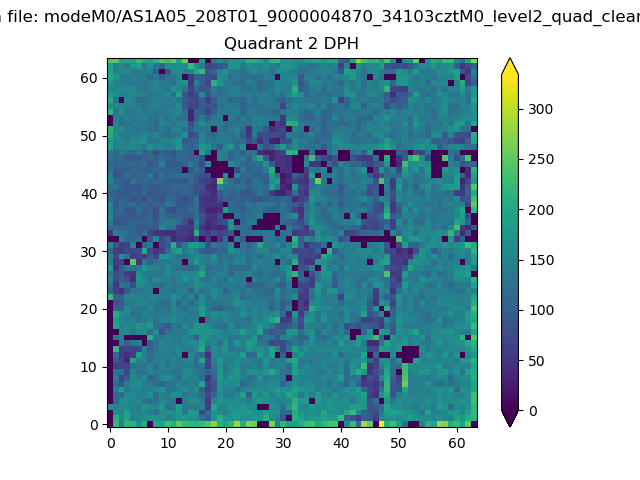 |
Quadrant C |
| Plot type | Count rate plots | Images |
|---|---|---|
| Comparison with Poisson distribution Blue bars denote a histogram of data divided into 1 sec bins. Red curve is a Poisson curve with rate = median count rate of data. |
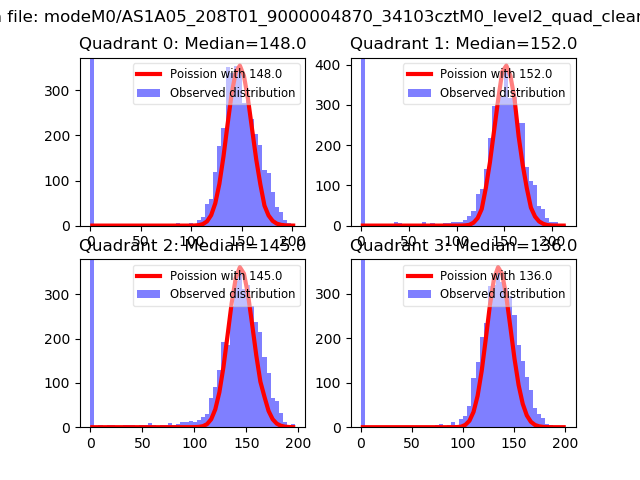 |
 |
| Quadrant-wise count rates Data is divided into 100 sec bins |
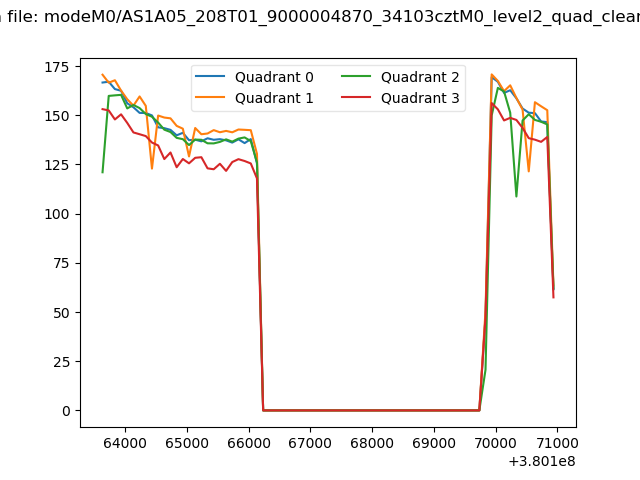 |
|
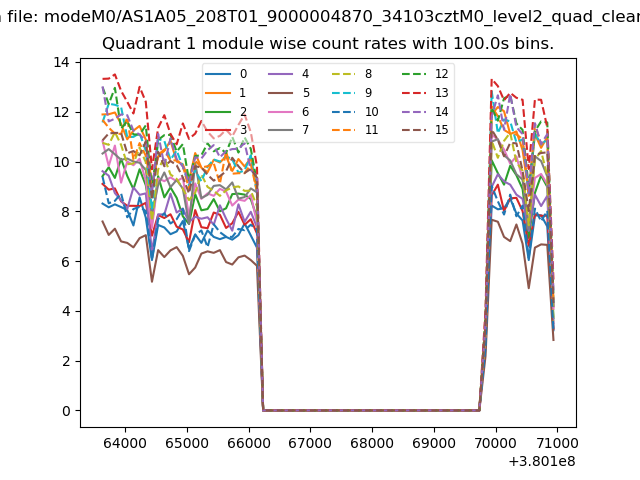
| Module-wise count rates for Quadrant A Data is divided into 100 sec bins |
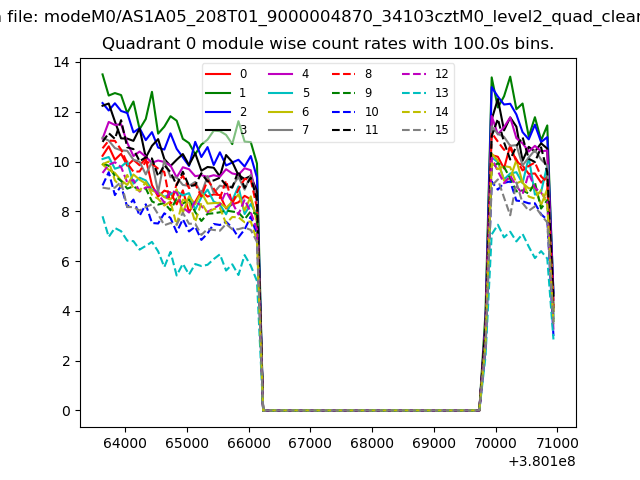 |
 |
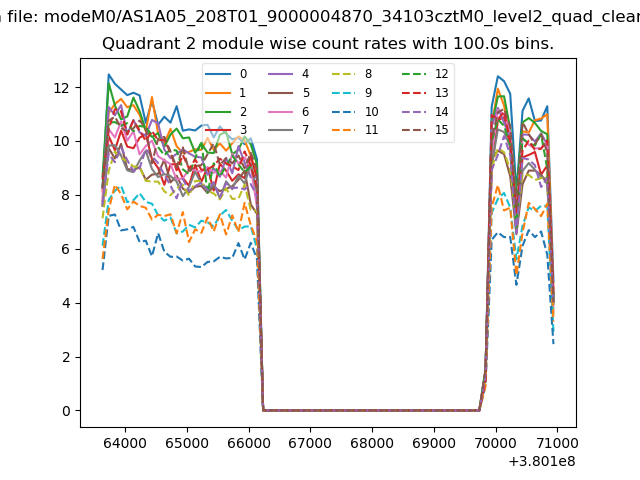
| Module-wise count rates for Quadrant B Data is divided into 100 sec bins |
 |
 |
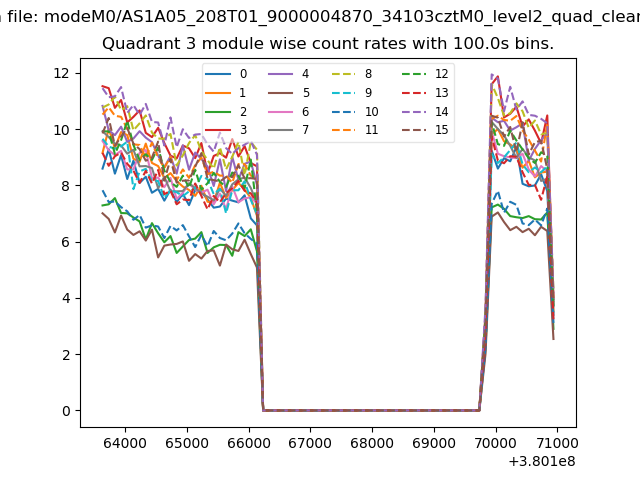
| Module-wise count rates for Quadrant C Data is divided into 100 sec bins |
 |
 |
| Module-wise count rates for Quadrant D Data is divided into 100 sec bins |
 |
 |
| Parameter | Plot |
|---|---|
| CZT HV Monitor | 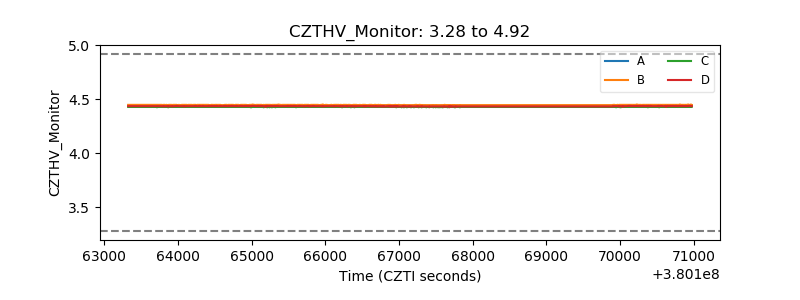 |
| D_VDD | 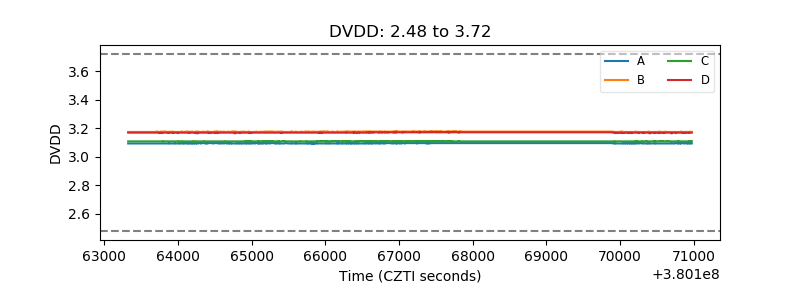 |
| Temperature 1 | 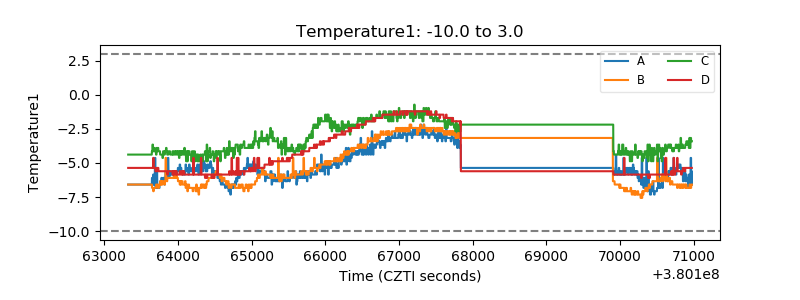 |
| Veto HV Monitor | 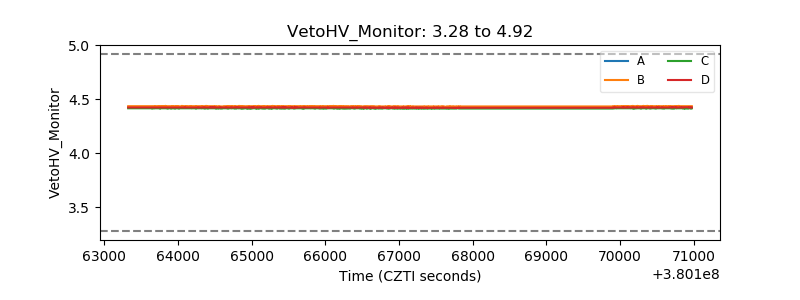 |
| Veto LLD | 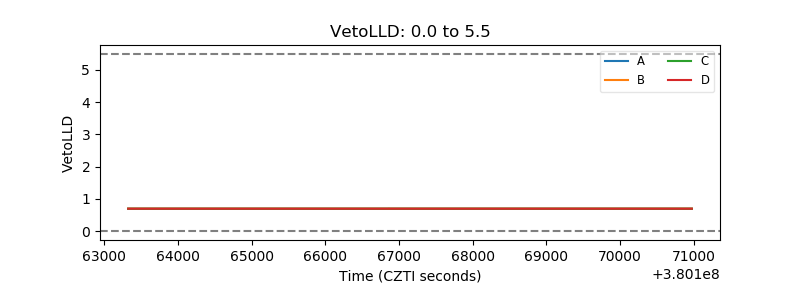 |
| Alpha Counter | 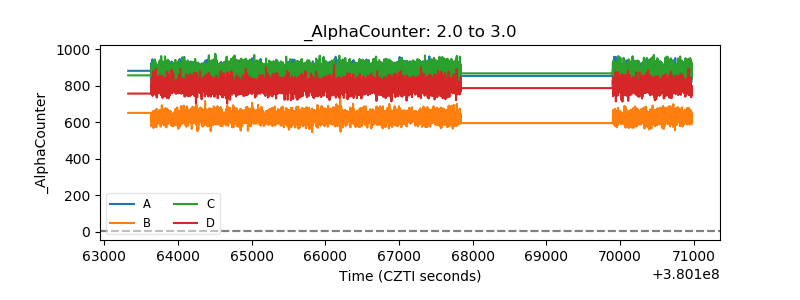 |
| _CPM_Rate | 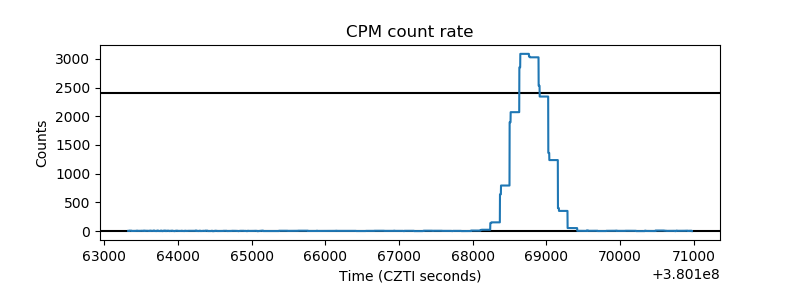 |
| CZT Counter |  |
| +2.5 Volts monitor |  |
| +5 Volts monitor |  |
| _ROLL_ROT | 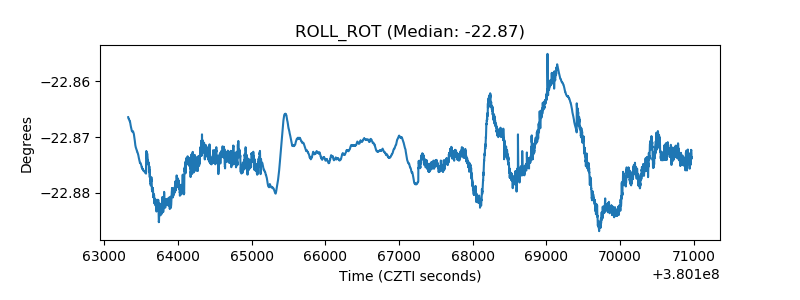 |
| _Roll_DEC | 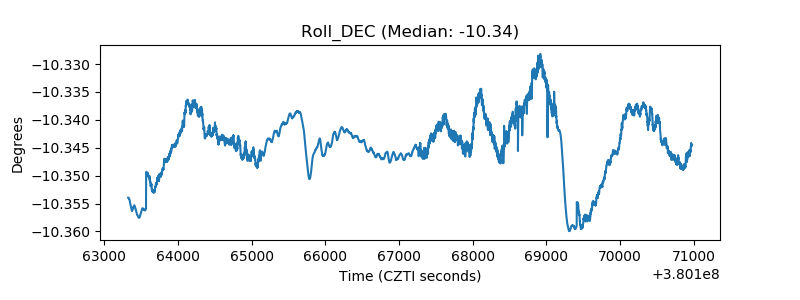 |
| _Roll_RA |  |
| Veto Counter | 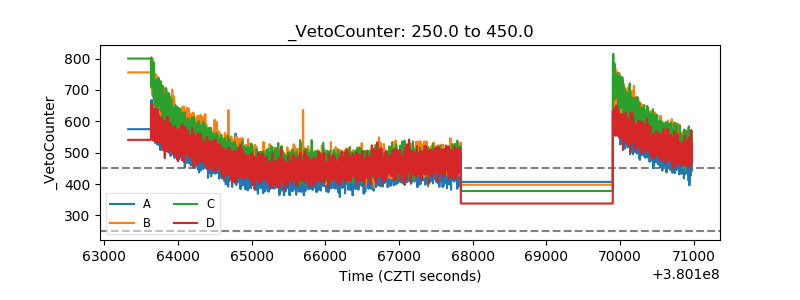 |