| Param | Original file | Final file |
|---|---|---|
| Filename | modeM0/AS1A05_208T01_9000004870_34105cztM0_level2.evt | modeM0/AS1A05_208T01_9000004870_34105cztM0_level2_quad_clean.evt |
| Size (bytes) | 600,122,880 | 60,566,400 |
| Size | 572.3 MB | 57.8 MB |
| Events in quadrant A | 3,920,910 | 376,984 |
| Events in quadrant B | 4,883,413 | 374,569 |
| Events in quadrant C | 3,469,773 | 376,401 |
| Events in quadrant D | 5,562,425 | 354,692 |
| Mode SS | |||
|---|---|---|---|
| Quadrant | BADHDUFLAG | Total packets | Discarded packets |
| A | 0 | 102 | 0 |
| B | 0 | 102 | 0 |
| C | 0 | 102 | 0 |
| D | 0 | 102 | 0 |
| Mode M9 | |||
|---|---|---|---|
| Quadrant | BADHDUFLAG | Total packets | Discarded packets |
| A | 0 | 22 | 0 |
| B | 0 | 22 | 0 |
| C | 0 | 22 | 0 |
| D | 0 | 22 | 0 |
| Mode M0 | |||
|---|---|---|---|
| Quadrant | BADHDUFLAG | Total packets | Discarded packets |
| A | 0 | 14777 | 3 |
| B | 0 | 17739 | 2 |
| C | 0 | 13398 | 2 |
| D | 0 | 19938 | 2 |
| Quadrant | Total seconds | Saturated seconds | Saturation percentage |
|---|---|---|---|
| A | 5005 | 637 | 12.727273% |
| B | 5005 | 803 | 16.043956% |
| C | 5005 | 163 | 3.256743% |
| D | 5005 | 648 | 12.947053% |
Noise dominated data is calculated using 1-second bins in cleaned event files. If a bin has >2000 counts, and if more than 50% of those come from <1% of pixels, then it is considered to be noise-dominated and hence unusable.
| Quadrant | # 1 sec bins | Bins with >0 counts | Bins with >2000 counts | High rate bins dominated by noise | Noise dominated (total time) | Noise dominated (detector-on time) | Marked lightcurve |
|---|---|---|---|---|---|---|---|
| A | 7128 | 5006 | 549 | 549 | 7.70% | 10.97% | 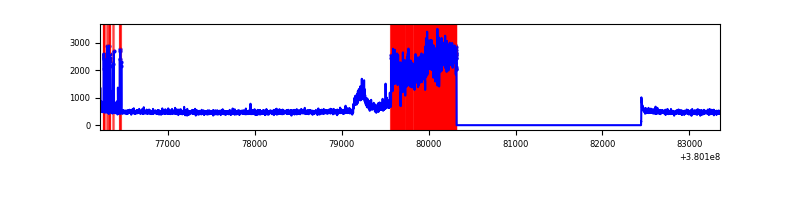 |
| B | 7128 | 5006 | 602 | 602 | 8.45% | 12.03% | 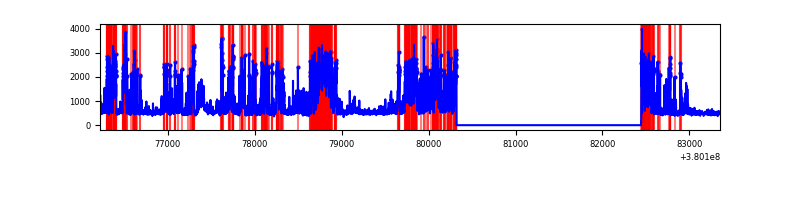 |
| C | 7128 | 5006 | 129 | 129 | 1.81% | 2.58% | 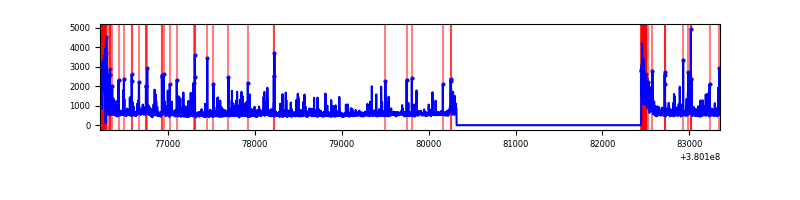 |
| D | 7128 | 5006 | 662 | 662 | 9.29% | 13.22% | 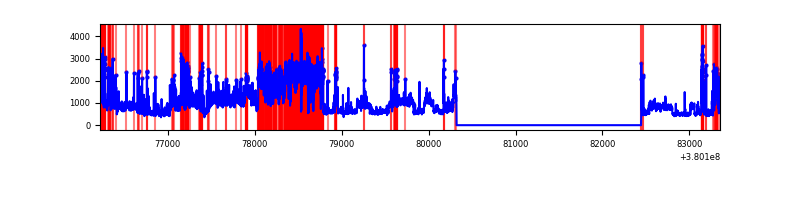 |
Top three noisy pixels from each quadrant. If the there are fewer than three noisy pixels in the level2.evt file, extra rows are filled as -1
| Pixel properties | Quadrant properties | ||||||
|---|---|---|---|---|---|---|---|
| Quadrant | DetID | PixID | Counts | Sigma | Mean | Median | Sigma |
| A | 15 | 17 | 1617149 | 13751.24 | 590 | 579 | 117.6 |
| A | 10 | 83 | 14510 | 118.5 | 590 | 579 | 117.6 |
| A | 13 | 6 | 12186 | 98.73 | 590 | 579 | 117.6 |
| B | 5 | 172 | 2486519 | 22376.0 | 580 | 567 | 111.1 |
| B | 4 | 81 | 28854 | 254.61 | 580 | 567 | 111.1 |
| B | 0 | 219 | 19807 | 173.18 | 580 | 567 | 111.1 |
| C | 0 | 10 | 666339 | 4783.89 | 602 | 608 | 139.2 |
| C | 15 | 214 | 217188 | 1556.33 | 602 | 608 | 139.2 |
| C | 14 | 254 | 160391 | 1148.19 | 602 | 608 | 139.2 |
| D | 1 | 52 | 1433723 | 9952.92 | 587 | 572 | 144.0 |
| D | 8 | 195 | 1141178 | 7921.26 | 587 | 572 | 144.0 |
| D | 2 | 250 | 242410 | 1679.51 | 587 | 572 | 144.0 |
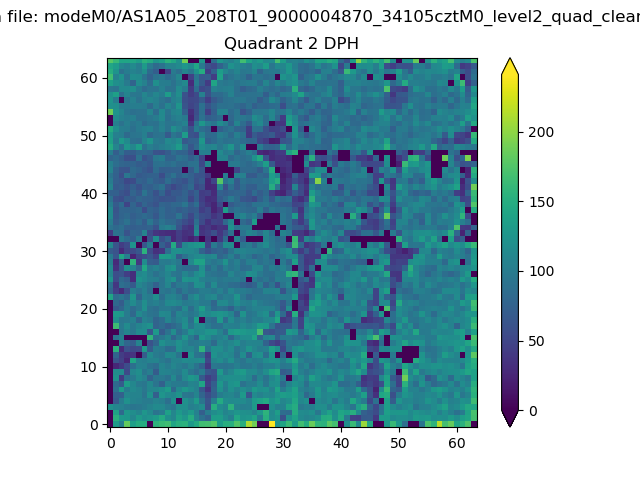
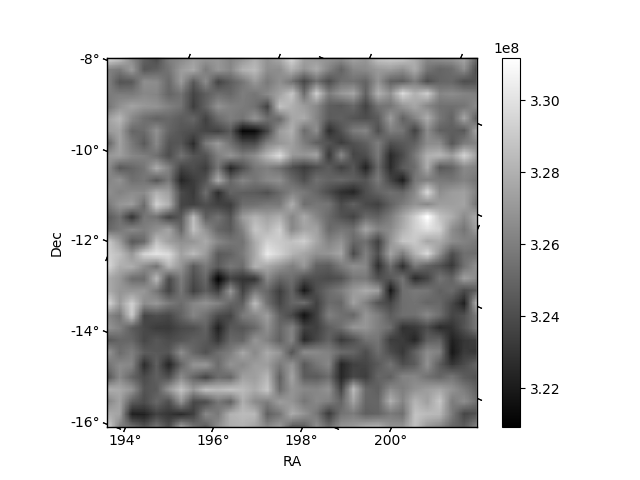
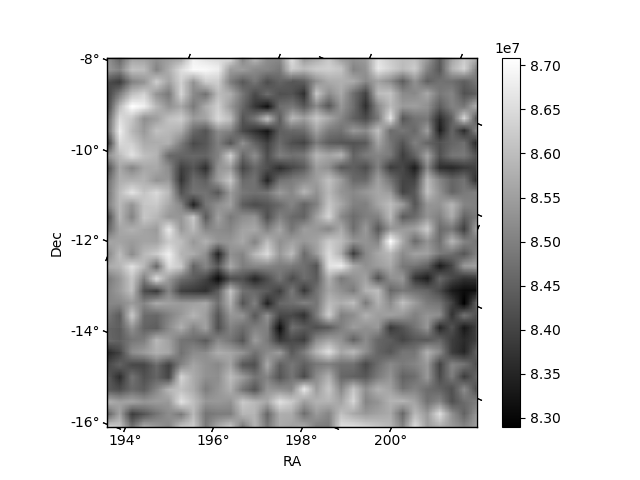
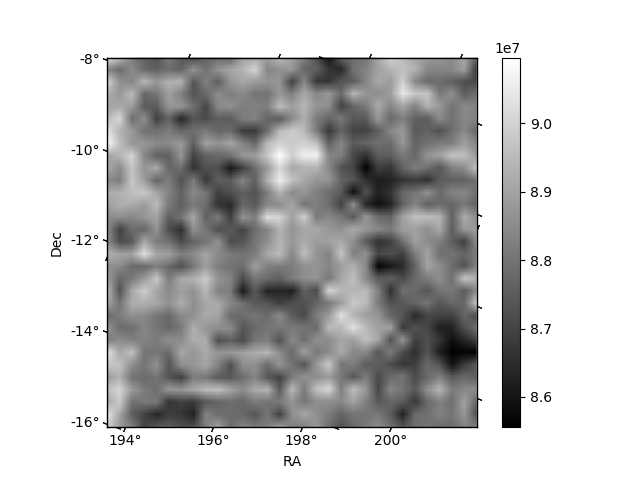
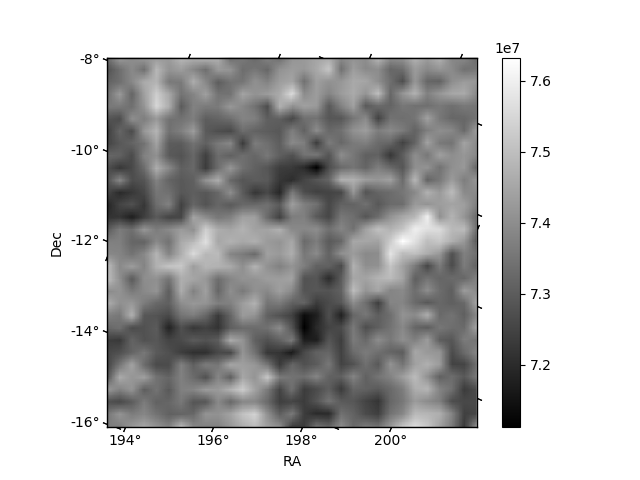
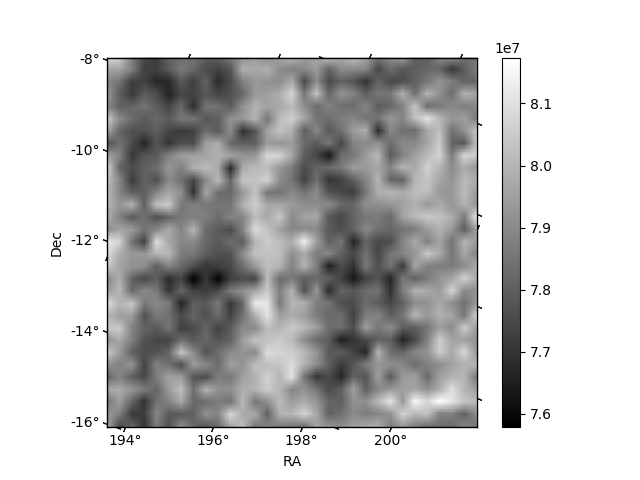
Histogram calculated using DETX and DETY for each event in the final _common_clean file
| Quadrant A | 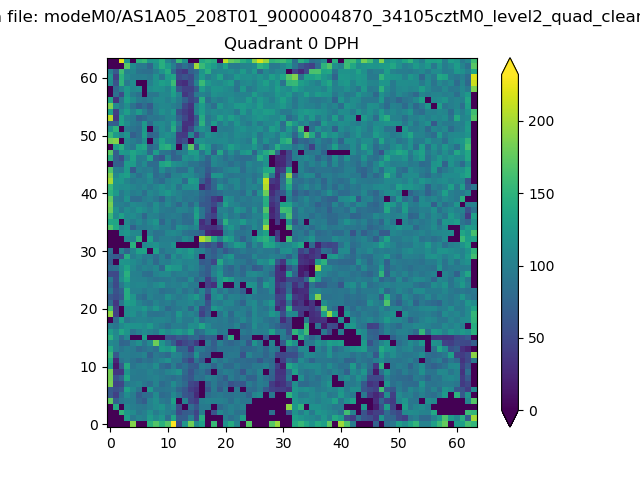 |
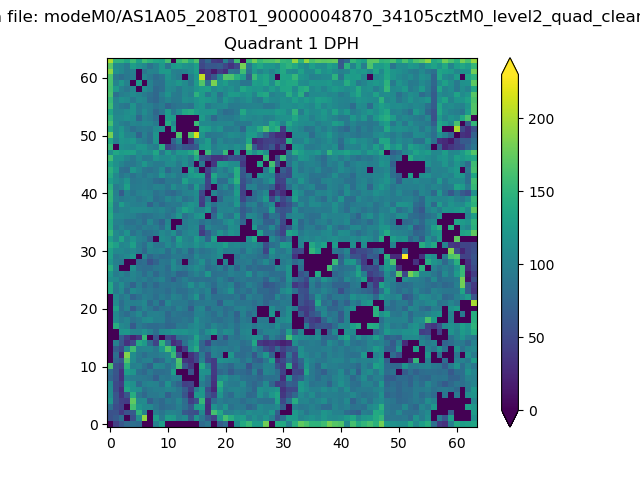 |
Quadrant B |
|---|---|---|---|
| Quadrant D | 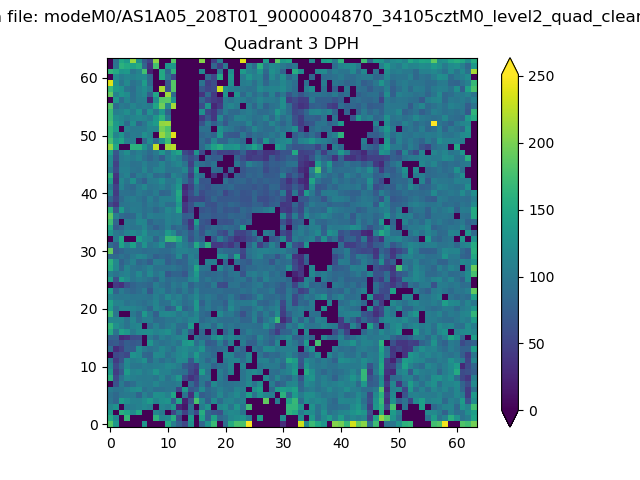 |
 |
Quadrant C |
| Plot type | Count rate plots | Images |
|---|---|---|
| Comparison with Poisson distribution Blue bars denote a histogram of data divided into 1 sec bins. Red curve is a Poisson curve with rate = median count rate of data. |
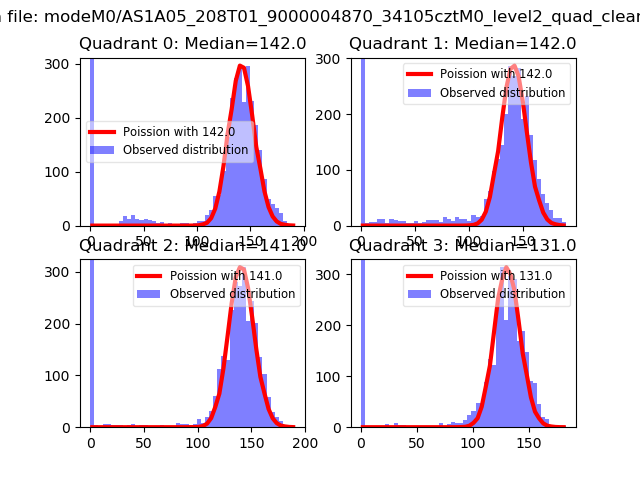 |
 |
| Quadrant-wise count rates Data is divided into 100 sec bins |
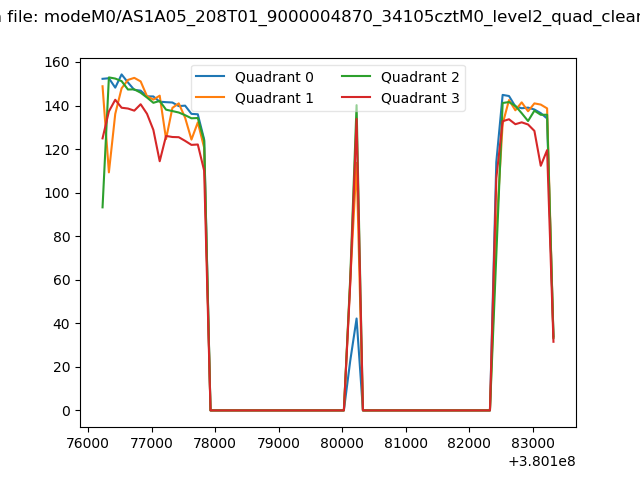 |
|
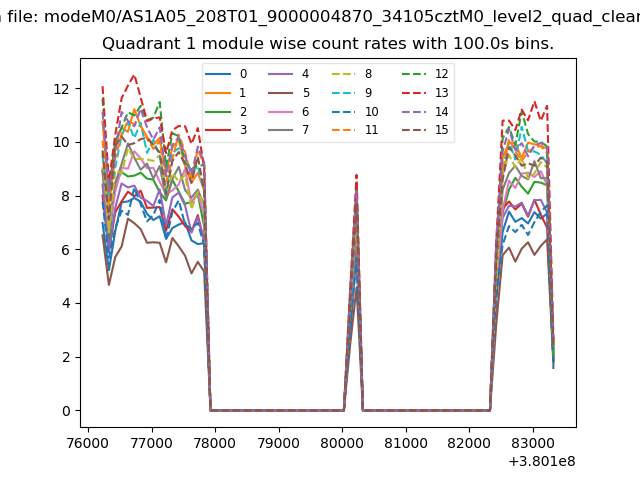
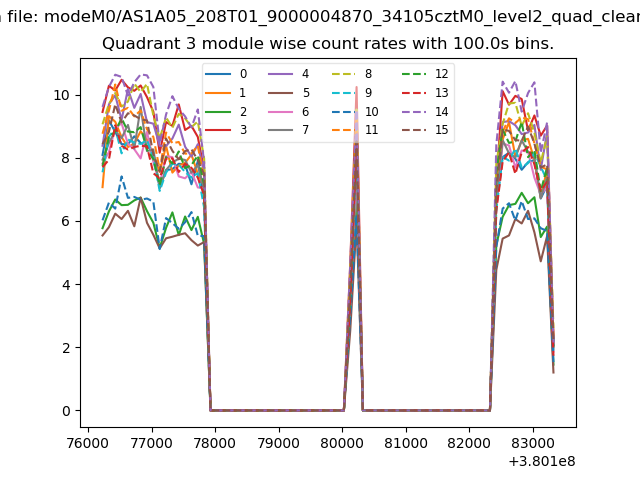
| Module-wise count rates for Quadrant A Data is divided into 100 sec bins |
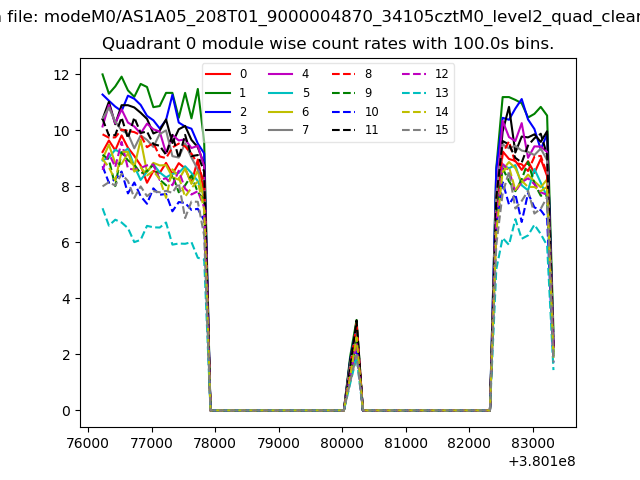 |
 |
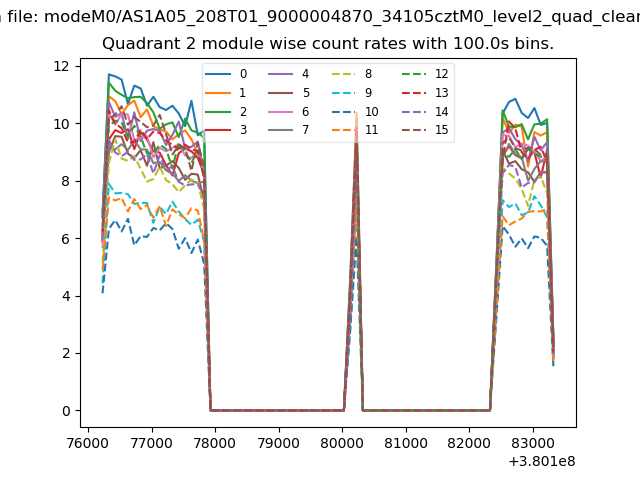
| Module-wise count rates for Quadrant B Data is divided into 100 sec bins |
 |
 |
| Module-wise count rates for Quadrant C Data is divided into 100 sec bins |
 |
 |
| Module-wise count rates for Quadrant D Data is divided into 100 sec bins |
 |
 |
| Parameter | Plot |
|---|---|
| CZT HV Monitor | 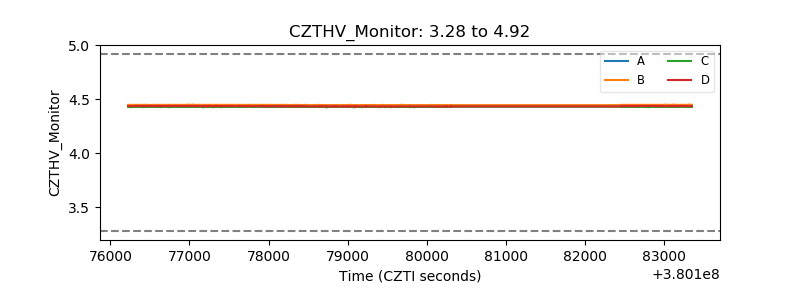 |
| D_VDD | 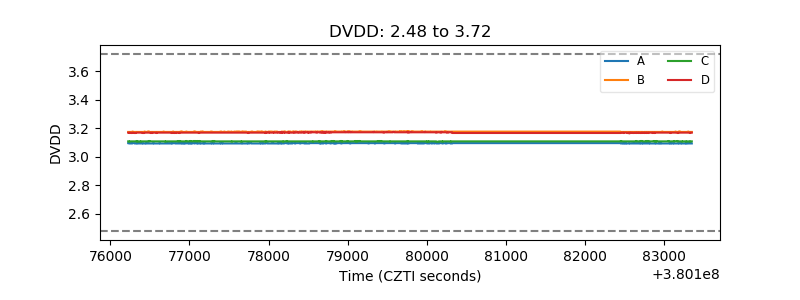 |
| Temperature 1 | 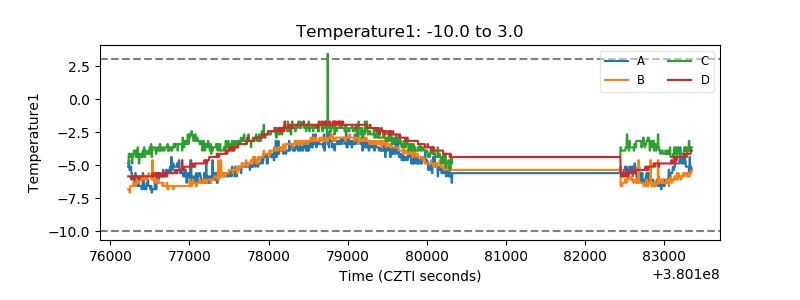 |
| Veto HV Monitor | 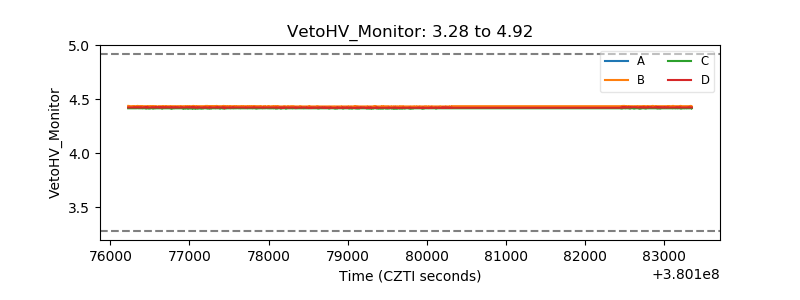 |
| Veto LLD | 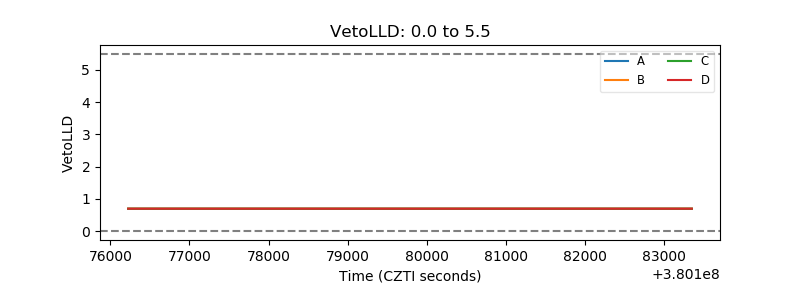 |
| Alpha Counter | 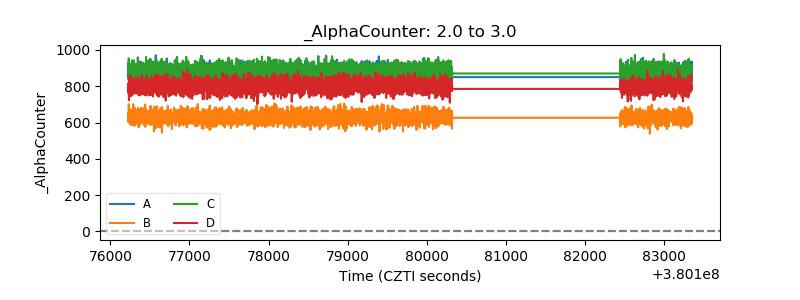 |
| _CPM_Rate | 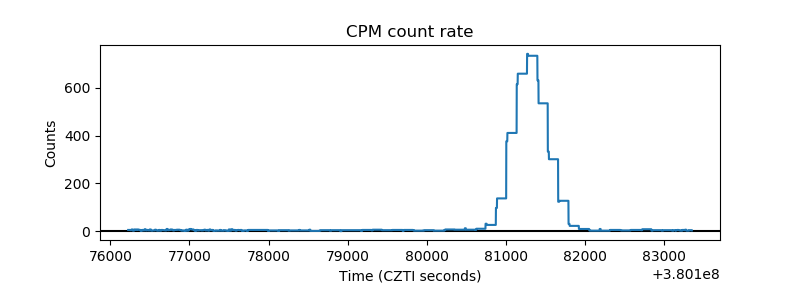 |
| CZT Counter | 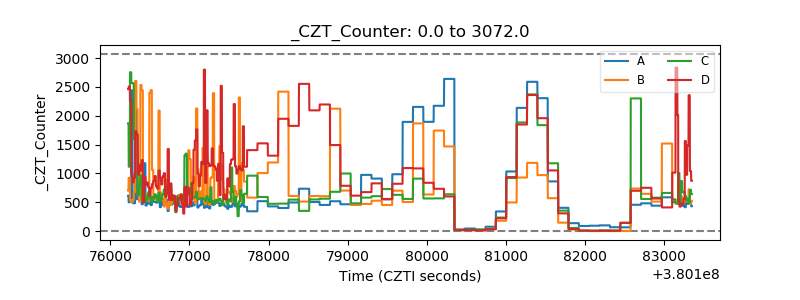 |
| +2.5 Volts monitor |  |
| +5 Volts monitor |  |
| _ROLL_ROT | 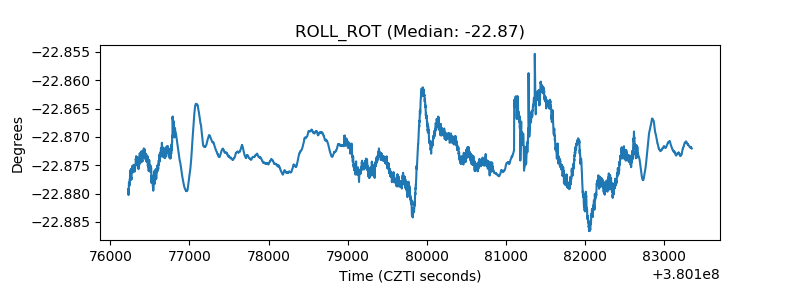 |
| _Roll_DEC | 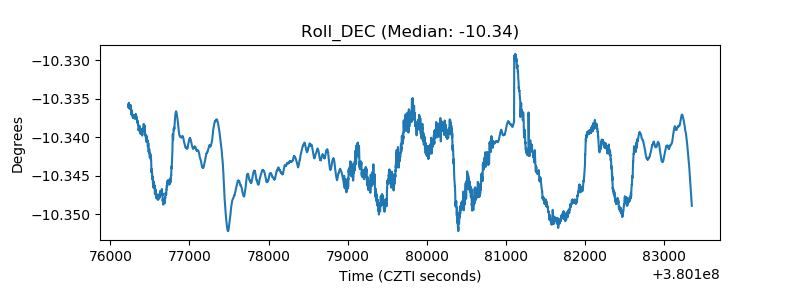 |
| _Roll_RA | 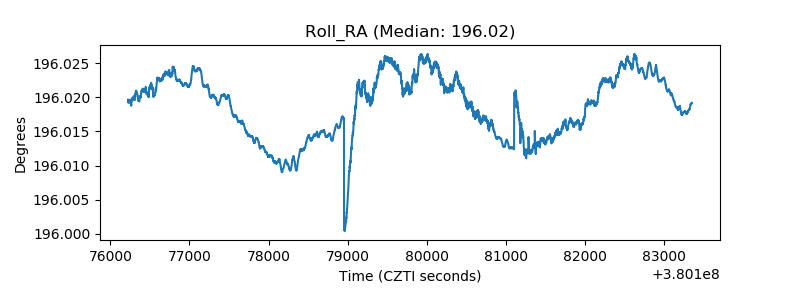 |
| Veto Counter | 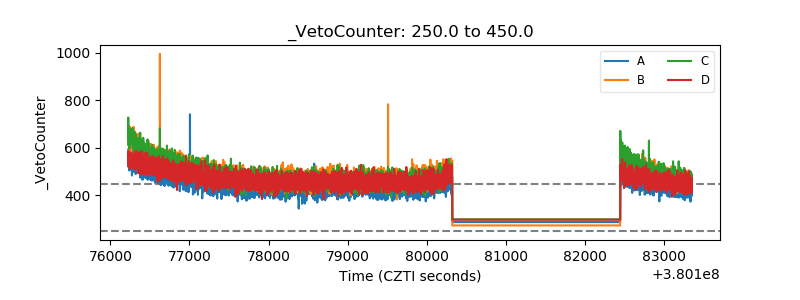 |