| Param | Original file | Final file |
|---|---|---|
| Filename | modeM0/AS1A05_208T01_9000004870_34107cztM0_level2.evt | modeM0/AS1A05_208T01_9000004870_34107cztM0_level2_quad_clean.evt |
| Size (bytes) | 815,270,400 | 65,373,120 |
| Size | 777.5 MB | 62.3 MB |
| Events in quadrant A | 4,955,422 | 371,502 |
| Events in quadrant B | 6,839,095 | 373,461 |
| Events in quadrant C | 5,027,213 | 375,304 |
| Events in quadrant D | 7,376,061 | 349,893 |
| Mode SS | |||
|---|---|---|---|
| Quadrant | BADHDUFLAG | Total packets | Discarded packets |
| A | 0 | 148 | 0 |
| B | 0 | 148 | 0 |
| C | 0 | 148 | 0 |
| D | 0 | 148 | 0 |
| Mode M9 | |||
|---|---|---|---|
| Quadrant | BADHDUFLAG | Total packets | Discarded packets |
| A | 0 | 22 | 0 |
| B | 0 | 22 | 0 |
| C | 0 | 22 | 0 |
| D | 0 | 22 | 0 |
| Mode M0 | |||
|---|---|---|---|
| Quadrant | BADHDUFLAG | Total packets | Discarded packets |
| A | 0 | 19227 | 1 |
| B | 0 | 25092 | 1 |
| C | 0 | 19540 | 1 |
| D | 0 | 26835 | 1 |
| Quadrant | Total seconds | Saturated seconds | Saturation percentage |
|---|---|---|---|
| A | 7311 | 617 | 8.439338% |
| B | 7311 | 1018 | 13.924224% |
| C | 7311 | 153 | 2.092737% |
| D | 7311 | 681 | 9.314731% |
Noise dominated data is calculated using 1-second bins in cleaned event files. If a bin has >2000 counts, and if more than 50% of those come from <1% of pixels, then it is considered to be noise-dominated and hence unusable.
| Quadrant | # 1 sec bins | Bins with >0 counts | Bins with >2000 counts | High rate bins dominated by noise | Noise dominated (total time) | Noise dominated (detector-on time) | Marked lightcurve |
|---|---|---|---|---|---|---|---|
| A | 9434 | 7312 | 528 | 528 | 5.60% | 7.22% | 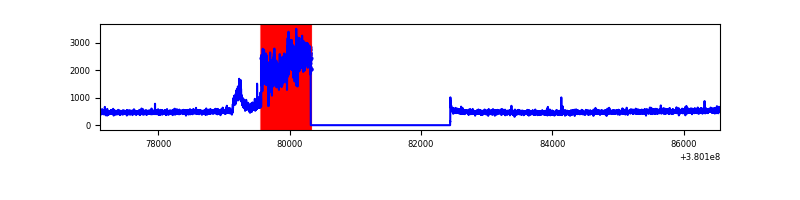 |
| B | 9434 | 7312 | 733 | 733 | 7.77% | 10.02% | 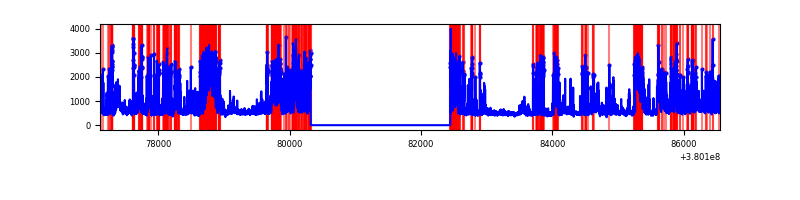 |
| C | 9434 | 7312 | 118 | 118 | 1.25% | 1.61% | 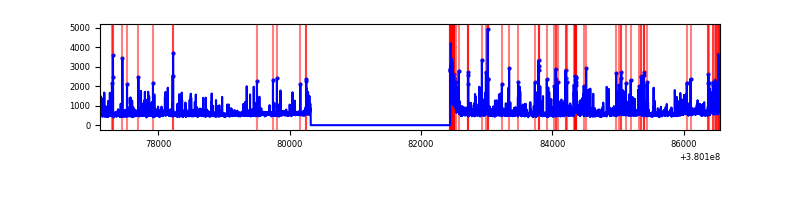 |
| D | 9434 | 7312 | 668 | 668 | 7.08% | 9.14% | 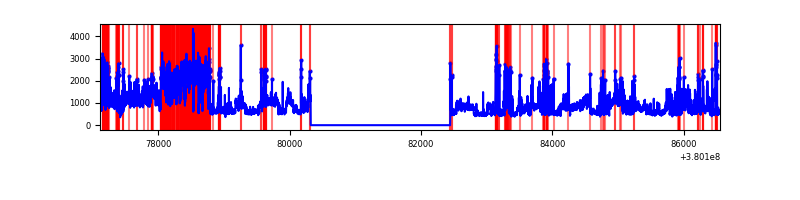 |
Top three noisy pixels from each quadrant. If the there are fewer than three noisy pixels in the level2.evt file, extra rows are filled as -1
| Pixel properties | Quadrant properties | ||||||
|---|---|---|---|---|---|---|---|
| Quadrant | DetID | PixID | Counts | Sigma | Mean | Median | Sigma |
| A | 15 | 17 | 1550639 | 8902.43 | 873 | 857 | 174.1 |
| A | 13 | 6 | 20922 | 115.26 | 873 | 857 | 174.1 |
| A | 13 | 254 | 13619 | 73.31 | 873 | 857 | 174.1 |
| B | 5 | 172 | 3020984 | 18784.45 | 848 | 828 | 160.8 |
| B | 5 | 31 | 249213 | 1544.88 | 848 | 828 | 160.8 |
| B | 4 | 81 | 62298 | 382.32 | 848 | 828 | 160.8 |
| C | 0 | 10 | 679615 | 3350.97 | 877 | 884 | 202.5 |
| C | 0 | 239 | 411969 | 2029.57 | 877 | 884 | 202.5 |
| C | 15 | 214 | 308806 | 1520.25 | 877 | 884 | 202.5 |
| D | 8 | 195 | 1624473 | 7688.32 | 861 | 839 | 211.2 |
| D | 1 | 52 | 1406422 | 6655.8 | 861 | 839 | 211.2 |
| D | 13 | 249 | 324759 | 1533.84 | 861 | 839 | 211.2 |
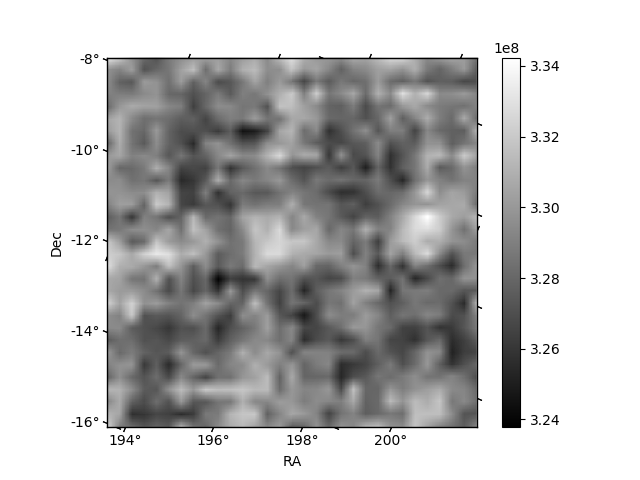
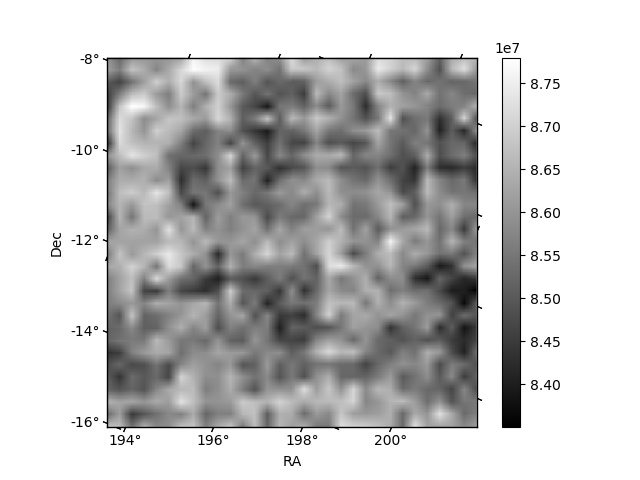
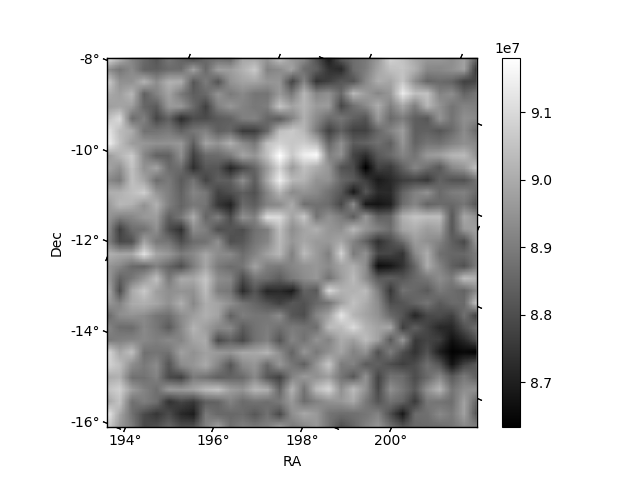
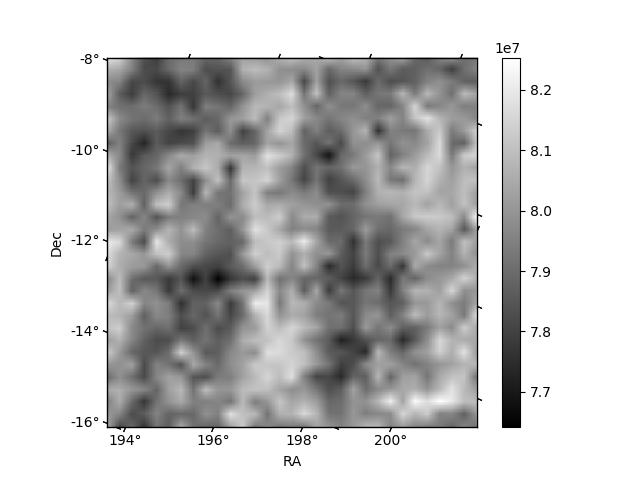
Histogram calculated using DETX and DETY for each event in the final _common_clean file
| Quadrant A | 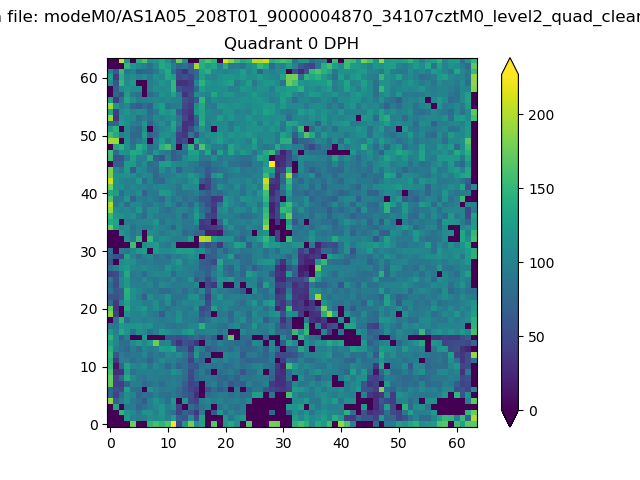 |
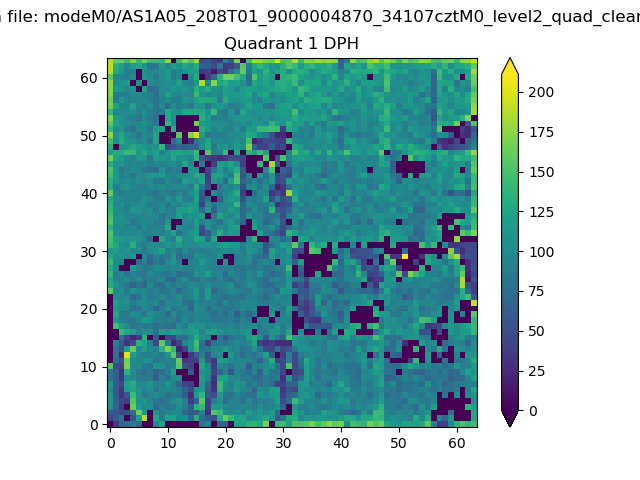 |
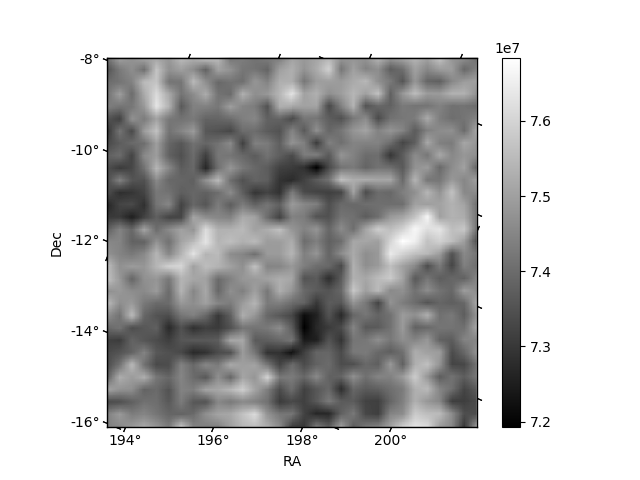
Quadrant B |
|---|---|---|---|
| Quadrant D | 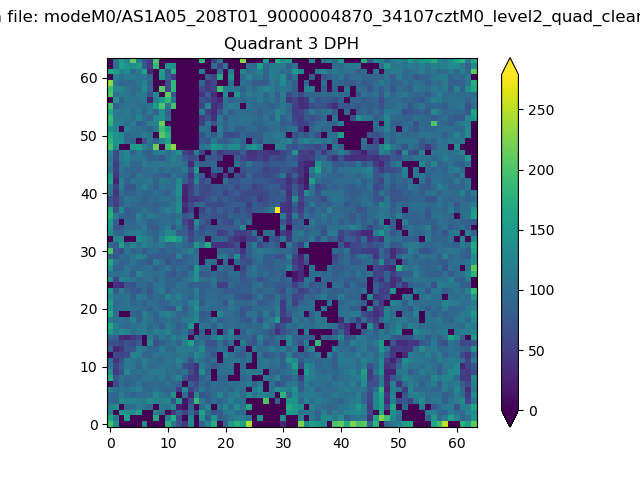 |
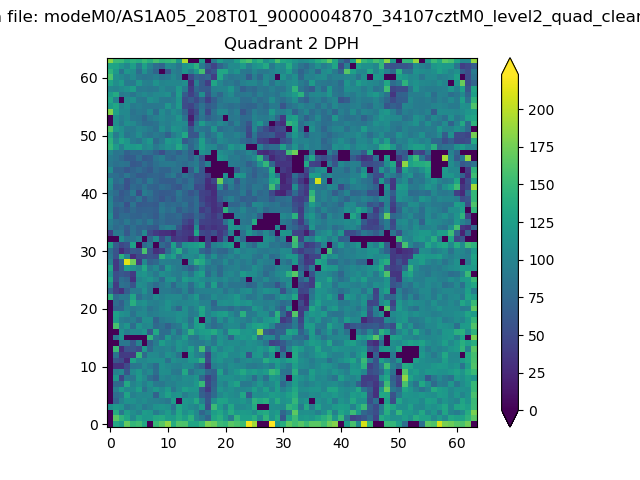 |
Quadrant C |
| Plot type | Count rate plots | Images |
|---|---|---|
| Comparison with Poisson distribution Blue bars denote a histogram of data divided into 1 sec bins. Red curve is a Poisson curve with rate = median count rate of data. |
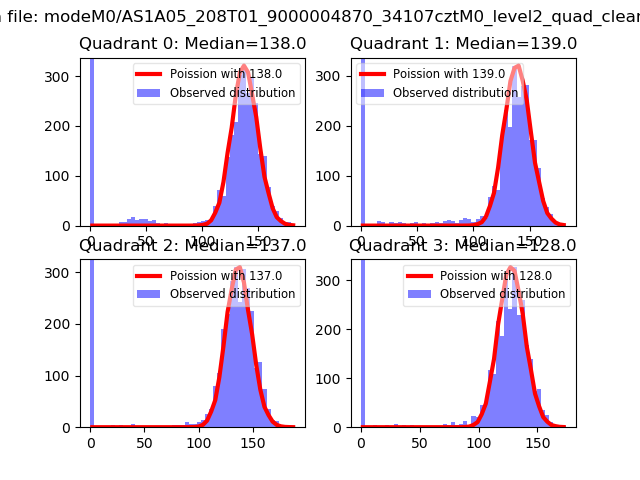 |
 |
| Quadrant-wise count rates Data is divided into 100 sec bins |
 |
|
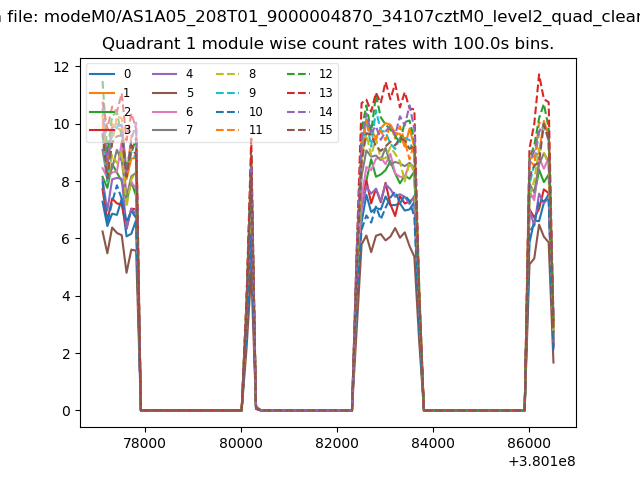
| Module-wise count rates for Quadrant A Data is divided into 100 sec bins |
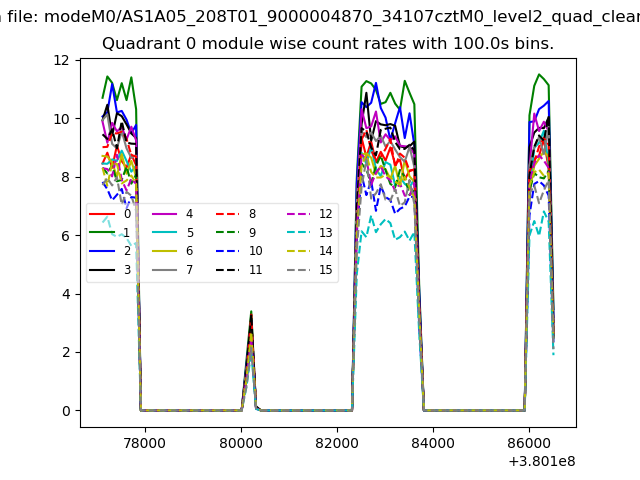 |
 |
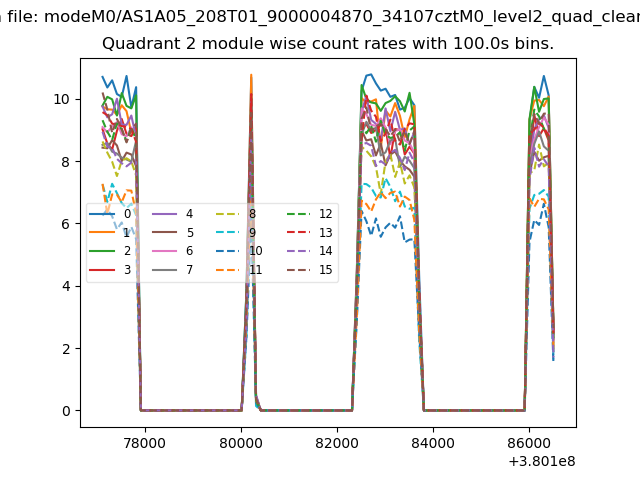
| Module-wise count rates for Quadrant B Data is divided into 100 sec bins |
 |
 |
| Module-wise count rates for Quadrant C Data is divided into 100 sec bins |
 |
 |
| Module-wise count rates for Quadrant D Data is divided into 100 sec bins |
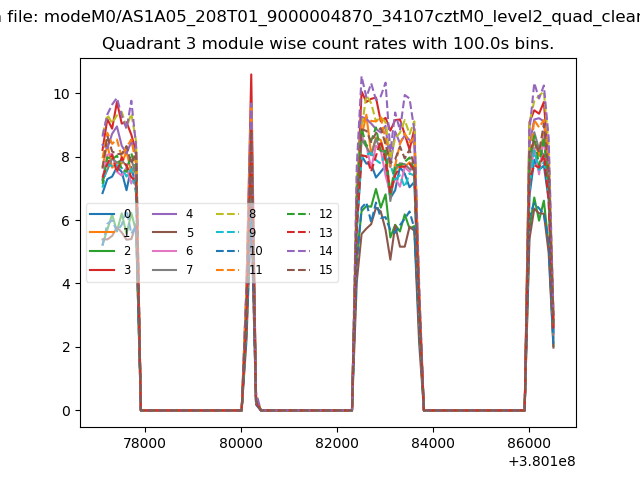 |
 |
| Parameter | Plot |
|---|---|
| CZT HV Monitor | 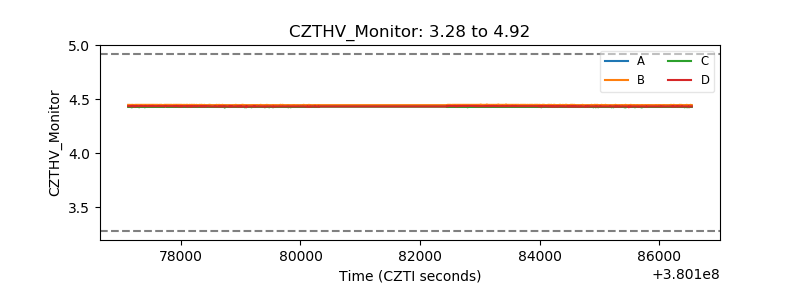 |
| D_VDD | 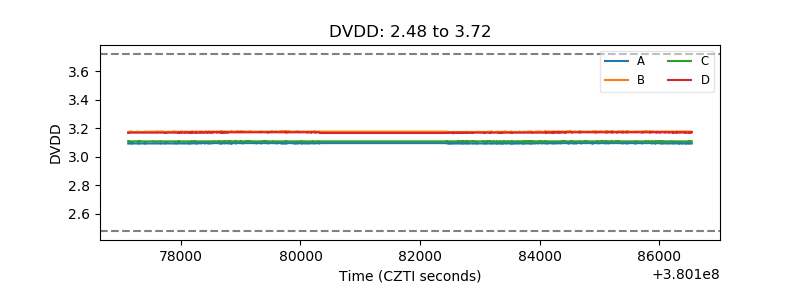 |
| Temperature 1 | 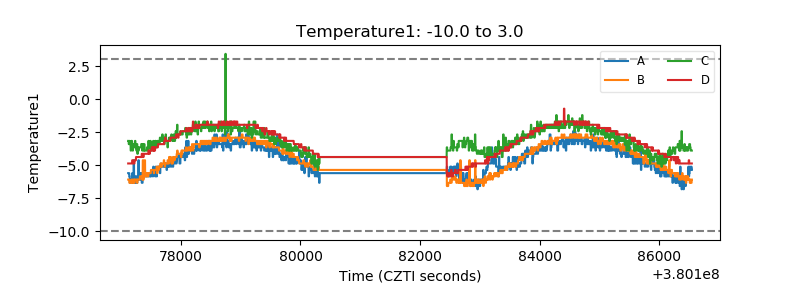 |
| Veto HV Monitor | 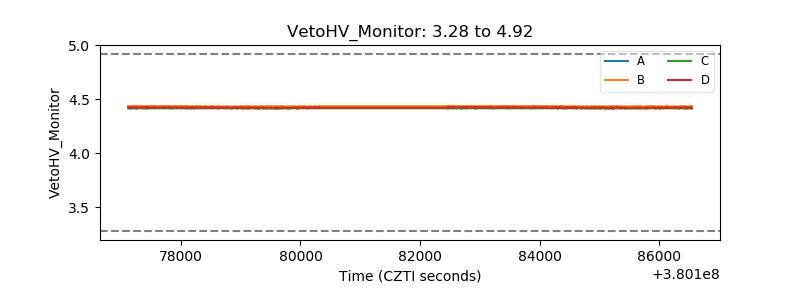 |
| Veto LLD | 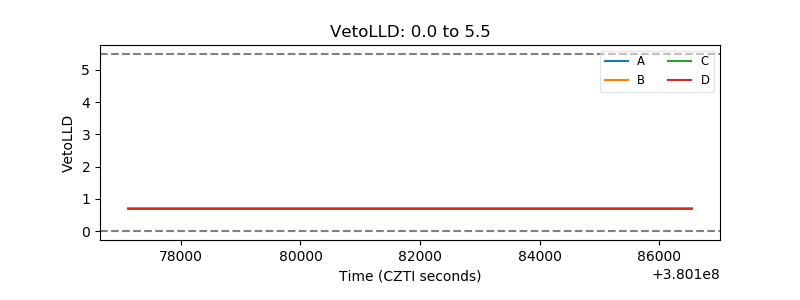 |
| Alpha Counter | 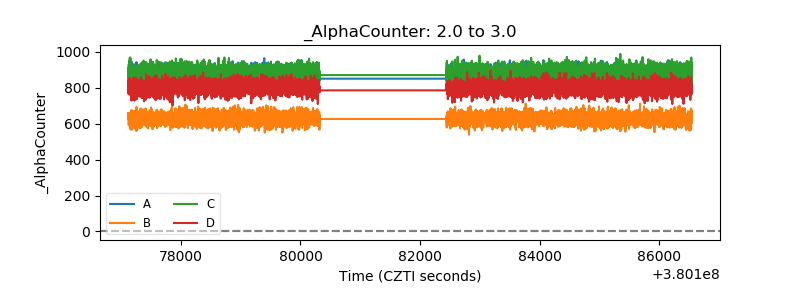 |
| _CPM_Rate | 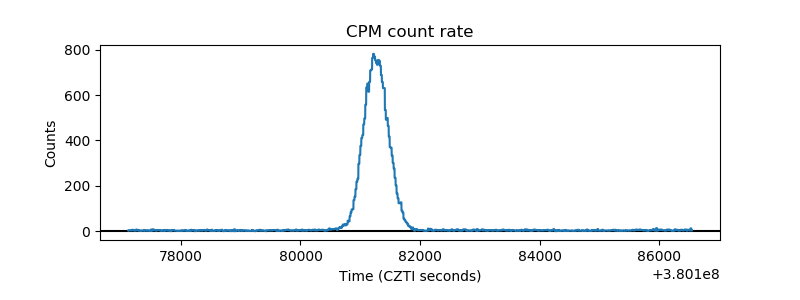 |
| CZT Counter | 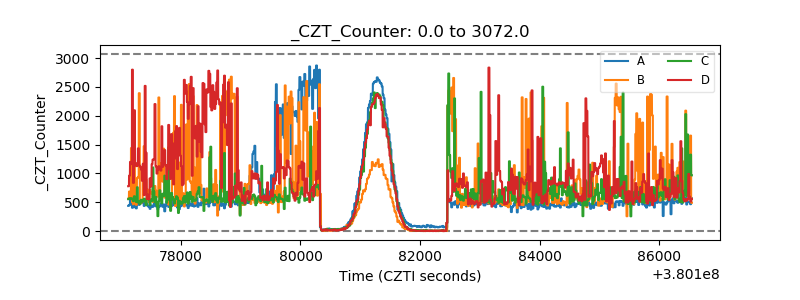 |
| +2.5 Volts monitor |  |
| +5 Volts monitor |  |
| _ROLL_ROT | 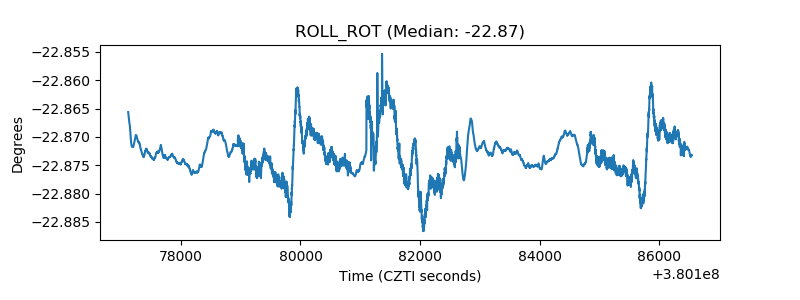 |
| _Roll_DEC | 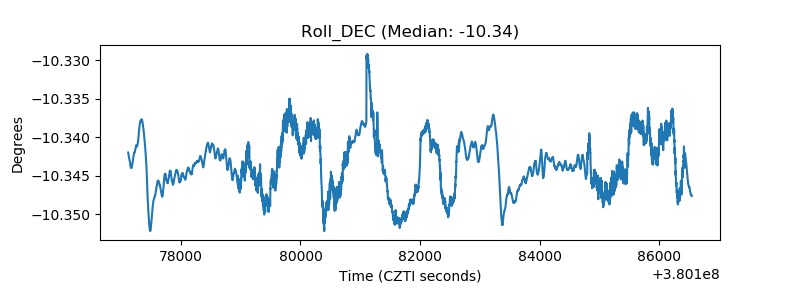 |
| _Roll_RA | 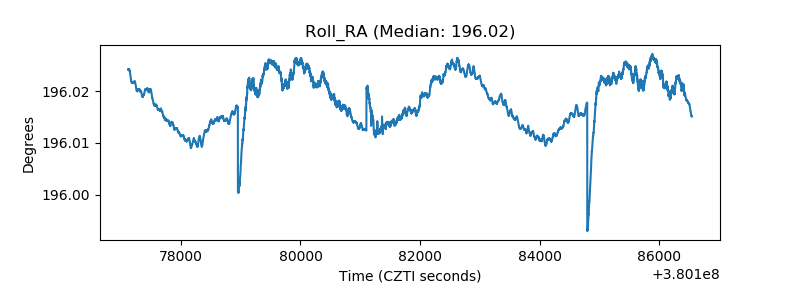 |
| Veto Counter | 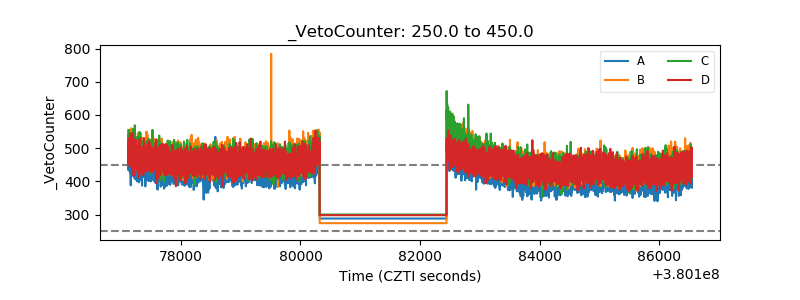 |