| Param | Original file | Final file |
|---|---|---|
| Filename | modeM0/AS1A11_097T08_9000004874cztM0_level2.fits | modeM0/AS1A11_097T08_9000004874cztM0_level2_quad_clean.evt |
| Size (bytes) | 789,753,600 | 744,739,200 |
| Size | 753.2 MB | 710.2 MB |
| Events in quadrant A | 4,918,402 | 4,465,741 |
| Events in quadrant B | 4,657,504 | 4,456,425 |
| Events in quadrant C | 4,709,281 | 4,236,031 |
| Events in quadrant D | 3,966,038 | 3,730,903 |
| Mode M9 | |||
|---|---|---|---|
| Quadrant | BADHDUFLAG | Total packets | Discarded packets |
| A | 0 | 357 | 0 |
| B | 0 | 357 | 0 |
| C | 0 | 356 | 0 |
| D | 0 | 357 | 0 |
| Mode M0 | |||
|---|---|---|---|
| Quadrant | BADHDUFLAG | Total packets | Discarded packets |
| A | 0 | 167573 | 0 |
| B | 0 | 192863 | 0 |
| C | 0 | 201359 | 0 |
| D | 0 | 253921 | 0 |
| Mode SS | |||
|---|---|---|---|
| Quadrant | BADHDUFLAG | Total packets | Discarded packets |
| A | 0 | 1688 | 0 |
| B | 0 | 1690 | 0 |
| C | 0 | 1688 | 0 |
| D | 0 | 1688 | 0 |
| Quadrant | Total seconds | Saturated seconds | Saturation percentage |
|---|---|---|---|
| A | 82721 | 97 | 0.117262% |
| B | 82665 | 1493 | 1.806085% |
| C | 82690 | 1656 | 2.002661% |
| D | 82504 | 4435 | 5.375497% |
Noise dominated data is calculated using 1-second bins in cleaned event files. If a bin has >2000 counts, and if more than 50% of those come from <1% of pixels, then it is considered to be noise-dominated and hence unusable.
| Quadrant | # 1 sec bins | Bins with >0 counts | Bins with >2000 counts | High rate bins dominated by noise | Noise dominated (total time) | Noise dominated (detector-on time) | Marked lightcurve |
|---|---|---|---|---|---|---|---|
| A | 123684 | 82111 | 0 | 0 | 0.00% | 0.00% | 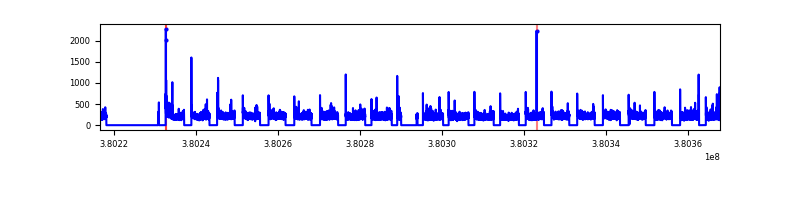 |
| B | 123684 | 82078 | 0 | 0 | 0.00% | 0.00% |  |
| C | 123684 | 82078 | 0 | 0 | 0.00% | 0.00% |  |
| D | 123684 | 82048 | 0 | 0 | 0.00% | 0.00% |  |
Top three noisy pixels from each quadrant. If the there are fewer than three noisy pixels in the level2.evt file, extra rows are filled as -1
| Pixel properties | Quadrant properties | ||||||
|---|---|---|---|---|---|---|---|
| Quadrant | DetID | PixID | Counts | Sigma | Mean | Median | Sigma |
| A | 9 | 19 | 4064 | 9.01 | 1282 | 1201 | 317.9 |
| A | 7 | 110 | 3883 | 8.44 | 1282 | 1201 | 317.9 |
| A | 0 | 29 | 3774 | 8.09 | 1282 | 1201 | 317.9 |
| B | 2 | 9 | 4023 | 11.67 | 1234 | 1179 | 243.7 |
| B | 3 | 80 | 3569 | 9.81 | 1234 | 1179 | 243.7 |
| B | 2 | 8 | 3306 | 8.73 | 1234 | 1179 | 243.7 |
| C | 1 | 81 | 3945 | 8.78 | 1245 | 1165 | 316.7 |
| C | 1 | 80 | 3770 | 8.22 | 1245 | 1165 | 316.7 |
| C | 3 | 202 | 3632 | 7.79 | 1245 | 1165 | 316.7 |
| D | 4 | 160 | 2992 | 6.5 | 1137 | 1040 | 300.3 |
| D | 10 | 113 | 2955 | 6.38 | 1137 | 1040 | 300.3 |
| D | 6 | 231 | 2893 | 6.17 | 1137 | 1040 | 300.3 |
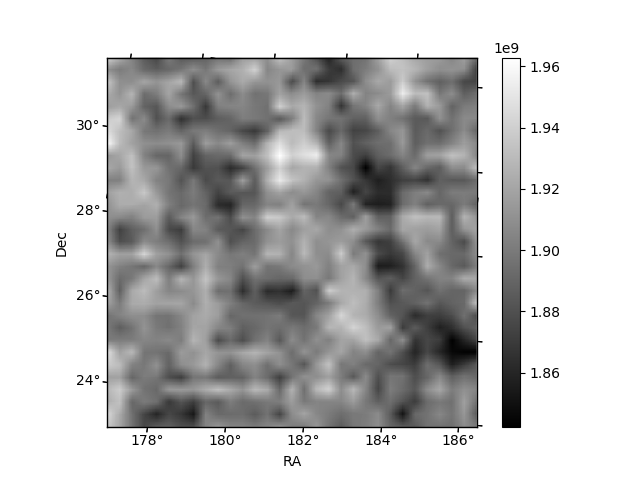
Histogram calculated using DETX and DETY for each event in the final _common_clean file
| Quadrant A | 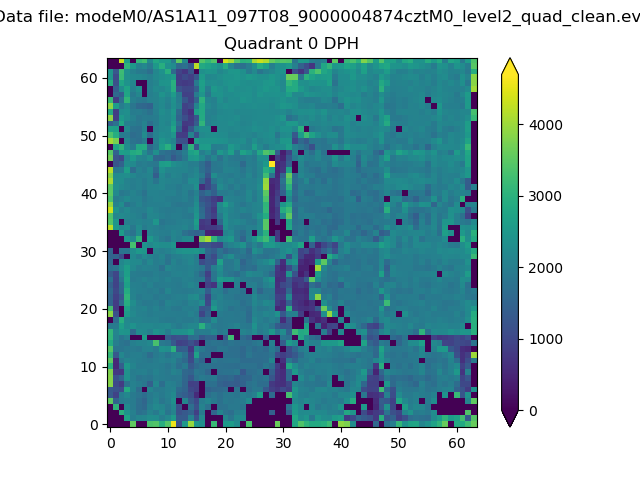 |
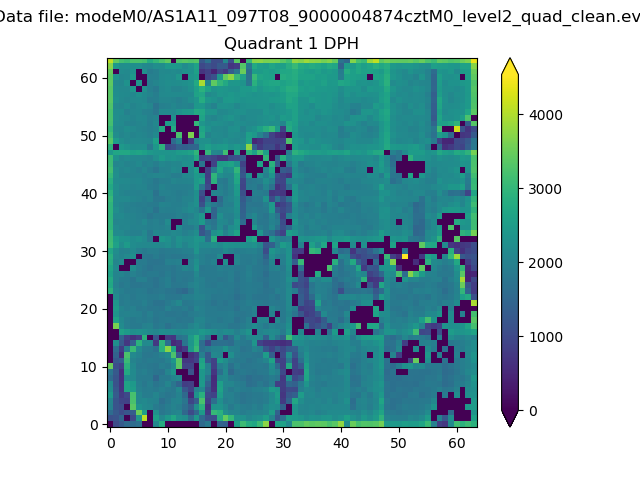 |
Quadrant B |
|---|---|---|---|
| Quadrant D | 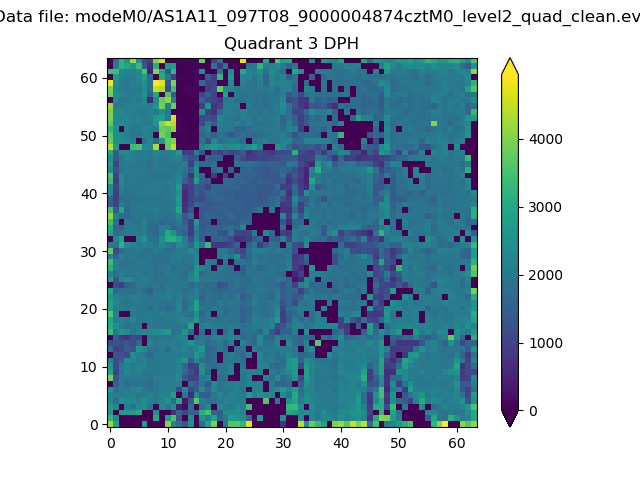 |
 |
Quadrant C |
| Plot type | Count rate plots | Images |
|---|---|---|
| Comparison with Poisson distribution Blue bars denote a histogram of data divided into 1 sec bins. Red curve is a Poisson curve with rate = median count rate of data. |
 |
 |
| Quadrant-wise count rates Data is divided into 100 sec bins |
 |
|
| Module-wise count rates for Quadrant A Data is divided into 100 sec bins |
 |
 |
| Module-wise count rates for Quadrant B Data is divided into 100 sec bins |
 |
 |
| Module-wise count rates for Quadrant C Data is divided into 100 sec bins |
 |
 |
| Module-wise count rates for Quadrant D Data is divided into 100 sec bins |
 |
 |
| Parameter | Plot |
|---|---|
| CZT HV Monitor |  |
| D_VDD |  |
| Temperature 1 |  |
| Veto HV Monitor |  |
| Veto LLD |  |
| Alpha Counter |  |
| _CPM_Rate | 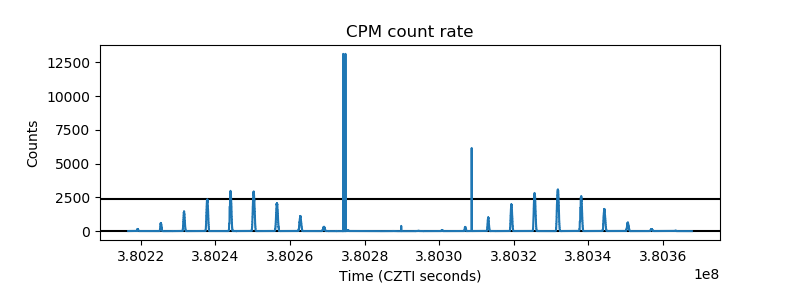 |
| CZT Counter |  |
| +2.5 Volts monitor |  |
| +5 Volts monitor |  |
| _ROLL_ROT |  |
| _Roll_DEC |  |
| _Roll_RA |  |
| Veto Counter |  |