| Param | Original file | Final file |
|---|---|---|
| Filename | modeM0/AS1A11_097T08_9000004874_34112cztM0_level2.evt | modeM0/AS1A11_097T08_9000004874_34112cztM0_level2_quad_clean.evt |
| Size (bytes) | 652,602,240 | 121,354,560 |
| Size | 622.4 MB | 115.7 MB |
| Events in quadrant A | 3,638,717 | 792,749 |
| Events in quadrant B | 4,416,978 | 801,318 |
| Events in quadrant C | 5,220,557 | 779,703 |
| Events in quadrant D | 5,953,478 | 752,482 |
| Mode M9 | |||
|---|---|---|---|
| Quadrant | BADHDUFLAG | Total packets | Discarded packets |
| A | 0 | 29 | 0 |
| B | 0 | 29 | 0 |
| C | 0 | 29 | 0 |
| D | 0 | 29 | 0 |
| Mode M0 | |||
|---|---|---|---|
| Quadrant | BADHDUFLAG | Total packets | Discarded packets |
| A | 0 | 15985 | 3 |
| B | 0 | 18224 | 2 |
| C | 0 | 20590 | 2 |
| D | 0 | 23055 | 2 |
| Mode SS | |||
|---|---|---|---|
| Quadrant | BADHDUFLAG | Total packets | Discarded packets |
| A | 0 | 162 | 0 |
| B | 0 | 162 | 0 |
| C | 0 | 162 | 0 |
| D | 0 | 162 | 0 |
| Quadrant | Total seconds | Saturated seconds | Saturation percentage |
|---|---|---|---|
| A | 7900 | 6 | 0.075949% |
| B | 7900 | 115 | 1.455696% |
| C | 7900 | 236 | 2.987342% |
| D | 7900 | 130 | 1.645570% |
Noise dominated data is calculated using 1-second bins in cleaned event files. If a bin has >2000 counts, and if more than 50% of those come from <1% of pixels, then it is considered to be noise-dominated and hence unusable.
| Quadrant | # 1 sec bins | Bins with >0 counts | Bins with >2000 counts | High rate bins dominated by noise | Noise dominated (total time) | Noise dominated (detector-on time) | Marked lightcurve |
|---|---|---|---|---|---|---|---|
| A | 10797 | 7902 | 0 | 0 | 0.00% | 0.00% | 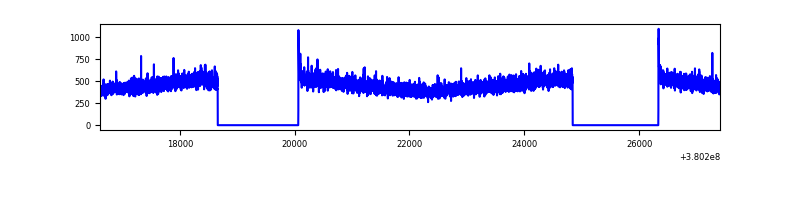 |
| B | 10797 | 7902 | 57 | 57 | 0.53% | 0.72% | 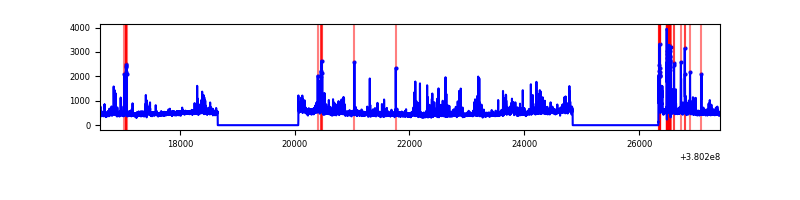 |
| C | 10797 | 7902 | 159 | 159 | 1.47% | 2.01% | 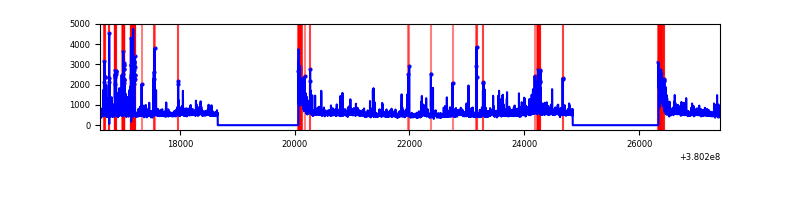 |
| D | 10797 | 7902 | 95 | 95 | 0.88% | 1.20% | 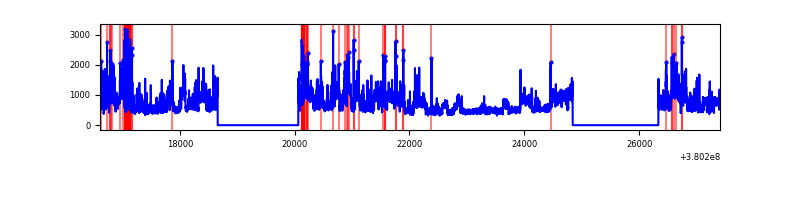 |
Top three noisy pixels from each quadrant. If the there are fewer than three noisy pixels in the level2.evt file, extra rows are filled as -1
| Pixel properties | Quadrant properties | ||||||
|---|---|---|---|---|---|---|---|
| Quadrant | DetID | PixID | Counts | Sigma | Mean | Median | Sigma |
| A | 10 | 83 | 22651 | 115.0 | 932 | 912 | 189.0 |
| A | 13 | 6 | 19042 | 95.91 | 932 | 912 | 189.0 |
| A | 13 | 254 | 14021 | 69.35 | 932 | 912 | 189.0 |
| B | 5 | 172 | 510153 | 2847.98 | 921 | 896 | 178.8 |
| B | 0 | 182 | 79241 | 438.14 | 921 | 896 | 178.8 |
| B | 0 | 190 | 77133 | 426.35 | 921 | 896 | 178.8 |
| C | 0 | 10 | 989108 | 4769.98 | 891 | 896 | 207.2 |
| C | 14 | 254 | 346187 | 1666.68 | 891 | 896 | 207.2 |
| C | 15 | 214 | 336597 | 1620.39 | 891 | 896 | 207.2 |
| D | 8 | 195 | 1601236 | 6613.57 | 889 | 873 | 242.0 |
| D | 2 | 249 | 272957 | 1124.4 | 889 | 873 | 242.0 |
| D | 7 | 223 | 232405 | 956.82 | 889 | 873 | 242.0 |
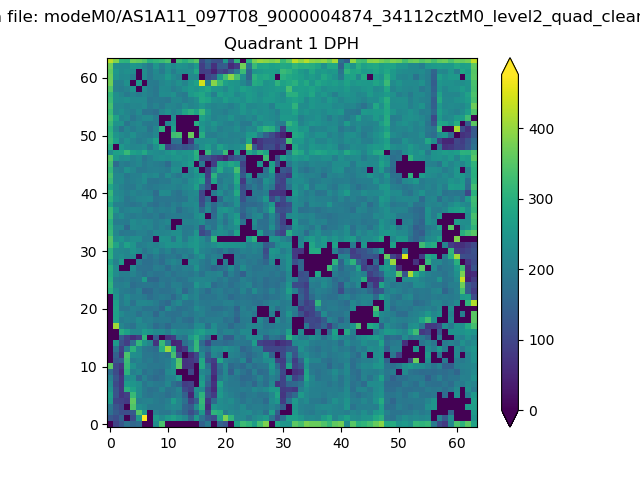
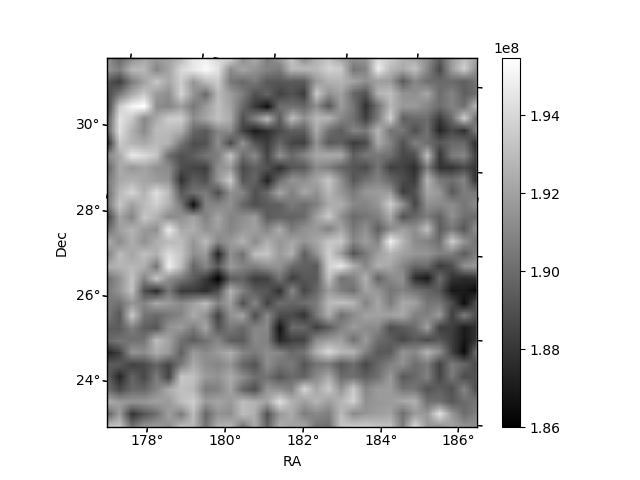
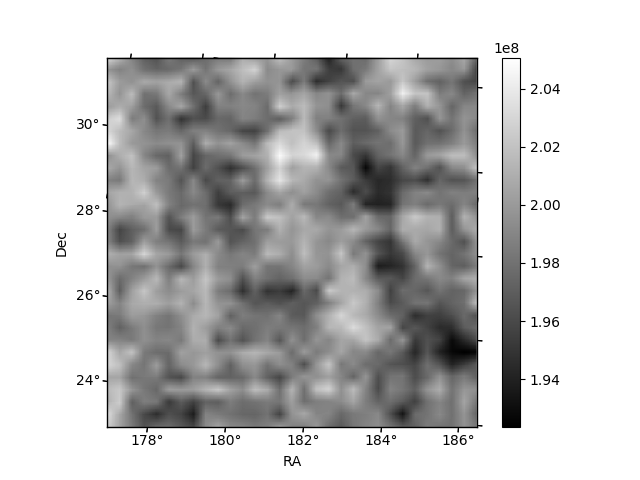
Histogram calculated using DETX and DETY for each event in the final _common_clean file
| Quadrant A |  |
 |
Quadrant B |
|---|---|---|---|
| Quadrant D |  |
 |
Quadrant C |
| Plot type | Count rate plots | Images |
|---|---|---|
| Comparison with Poisson distribution Blue bars denote a histogram of data divided into 1 sec bins. Red curve is a Poisson curve with rate = median count rate of data. |
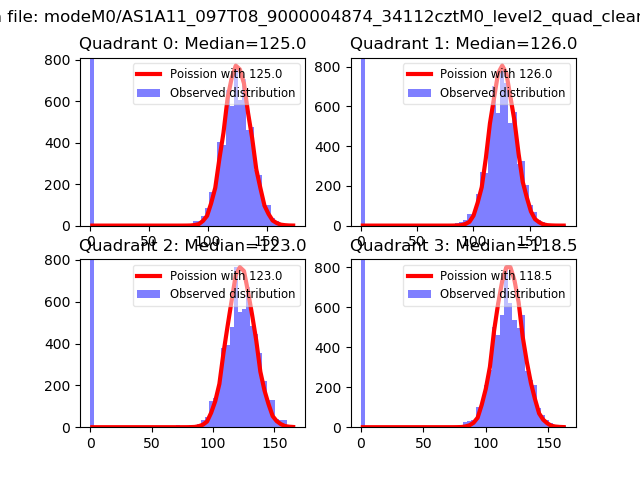 |
 |
| Quadrant-wise count rates Data is divided into 100 sec bins |
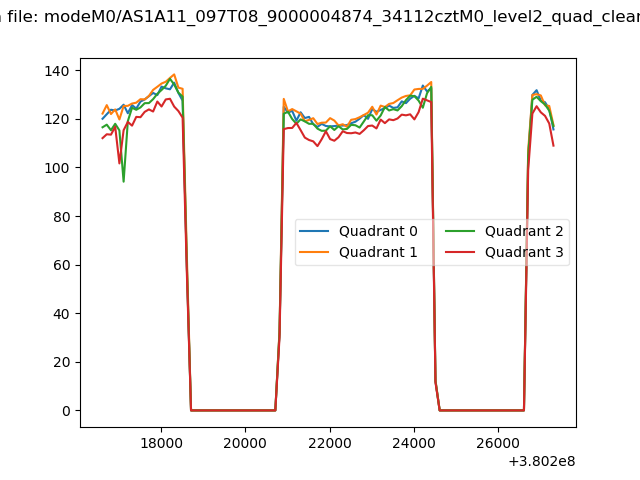 |
|
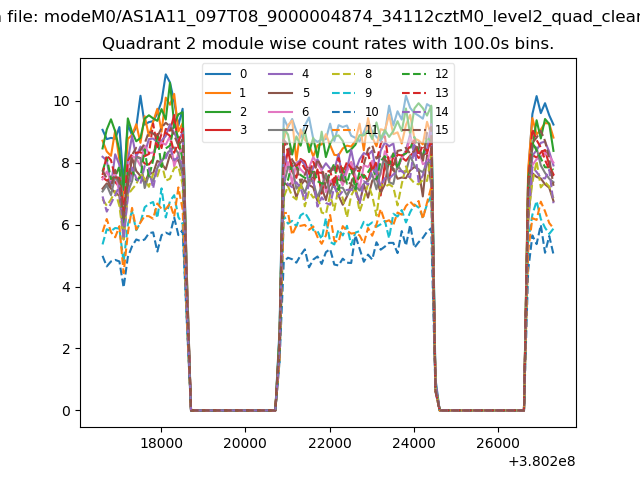
| Module-wise count rates for Quadrant A Data is divided into 100 sec bins |
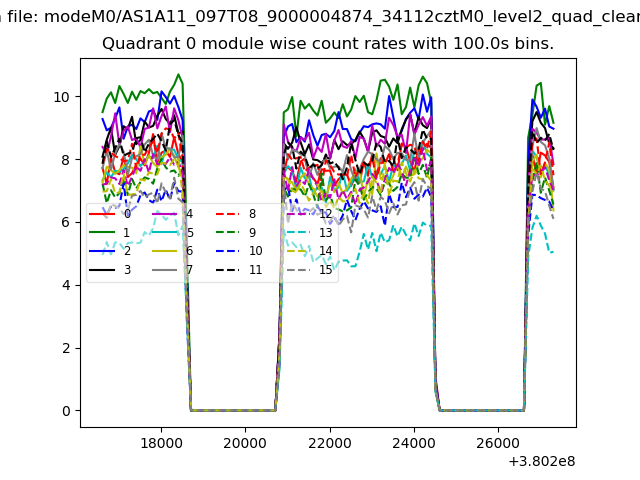 |
 |
| Module-wise count rates for Quadrant B Data is divided into 100 sec bins |
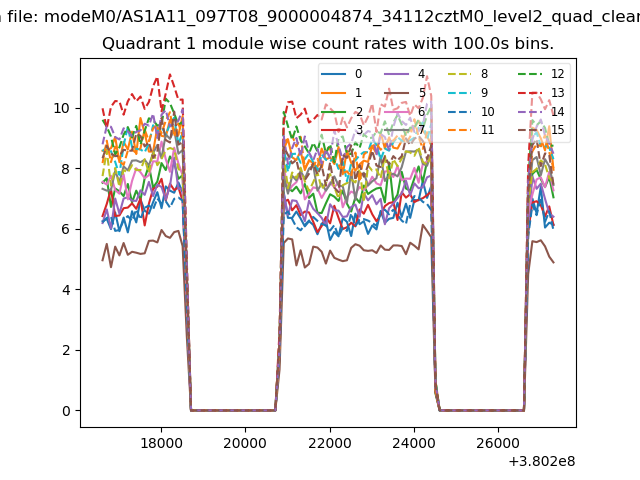 |
 |
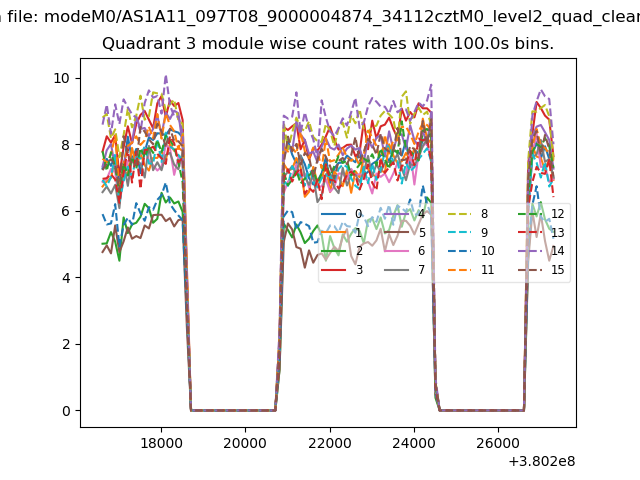
| Module-wise count rates for Quadrant C Data is divided into 100 sec bins |
 |
 |
| Module-wise count rates for Quadrant D Data is divided into 100 sec bins |
 |
 |
| Parameter | Plot |
|---|---|
| CZT HV Monitor | 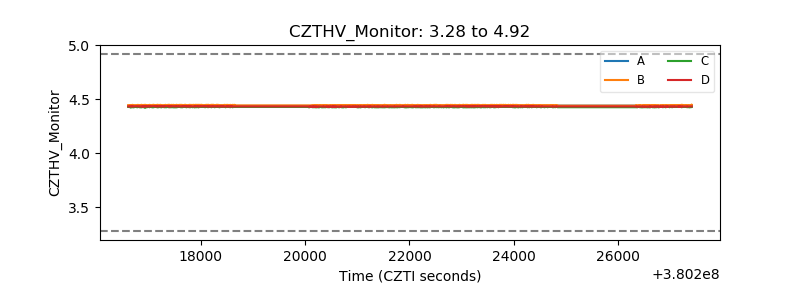 |
| D_VDD | 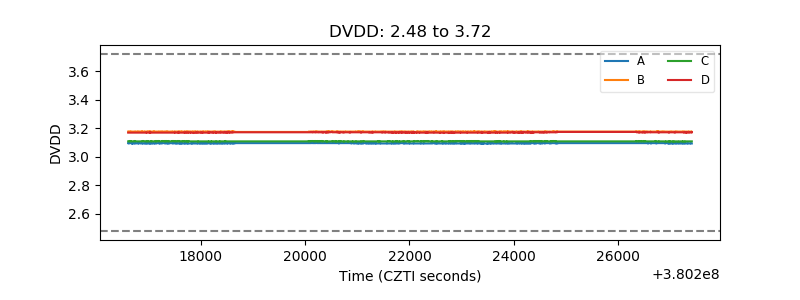 |
| Temperature 1 | 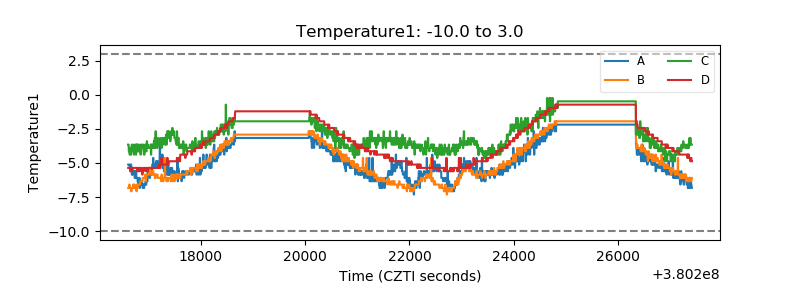 |
| Veto HV Monitor | 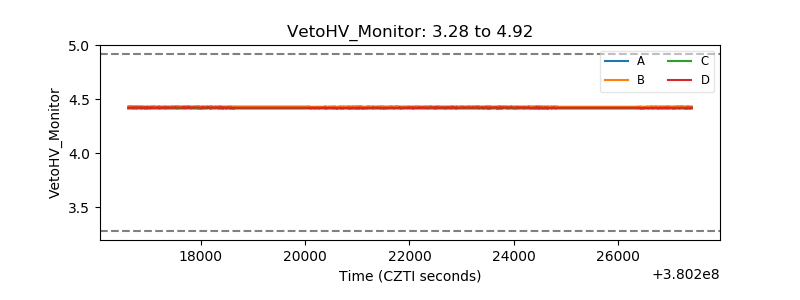 |
| Veto LLD | 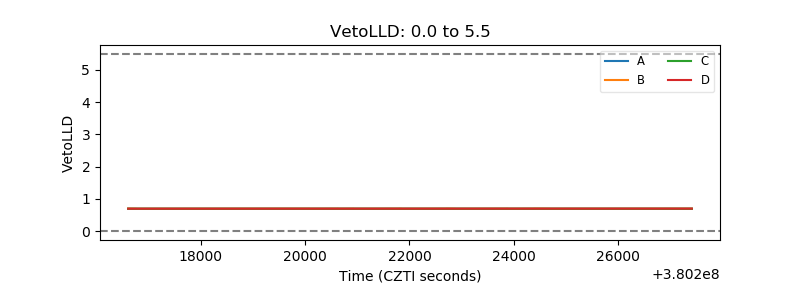 |
| Alpha Counter | 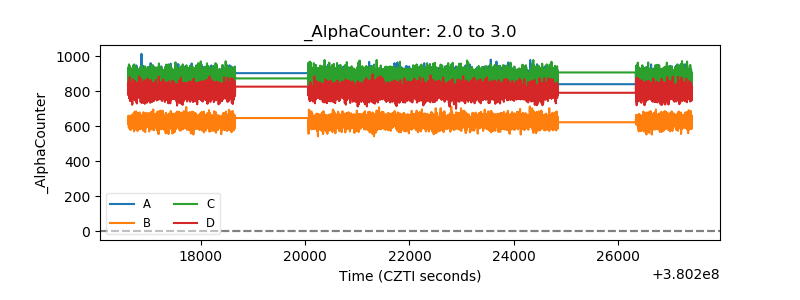 |
| _CPM_Rate | 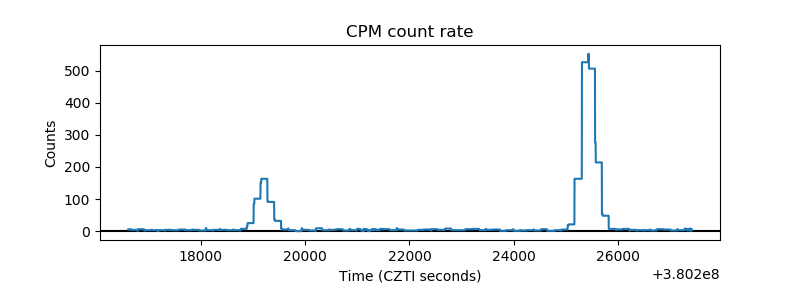 |
| CZT Counter | 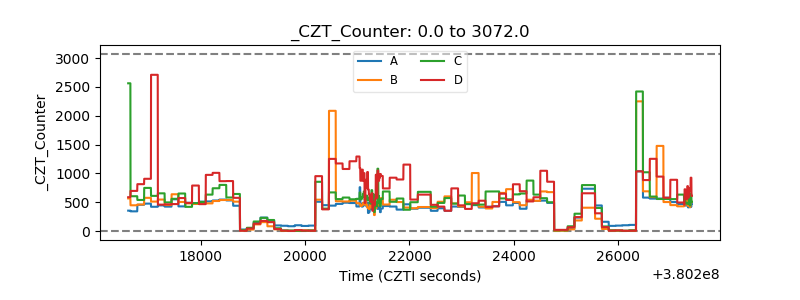 |
| +2.5 Volts monitor |  |
| +5 Volts monitor |  |
| _ROLL_ROT | 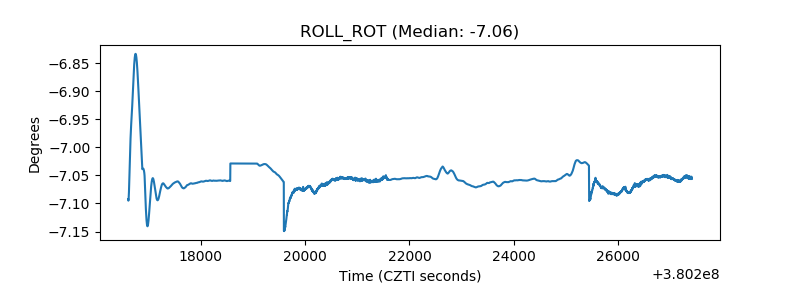 |
| _Roll_DEC | 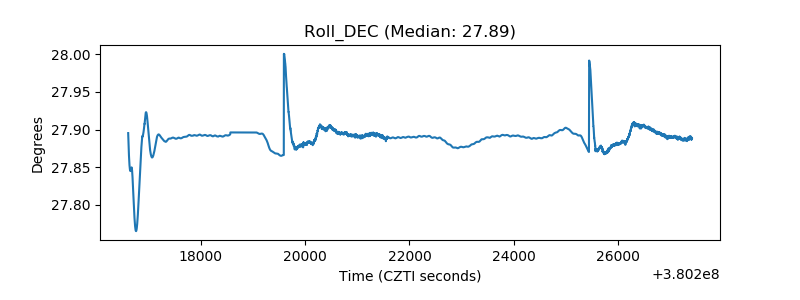 |
| _Roll_RA | 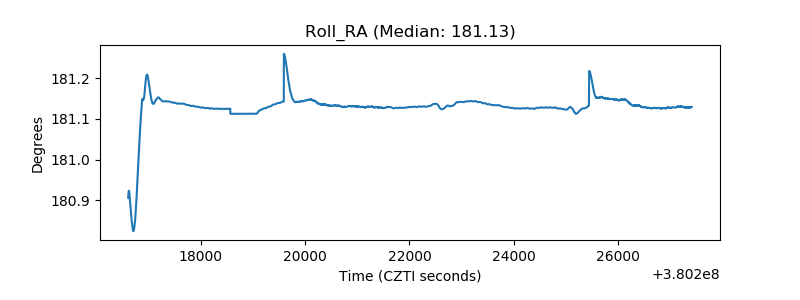 |
| Veto Counter | 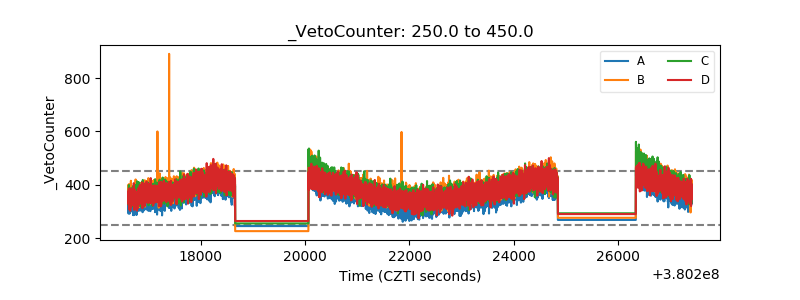 |