| Param | Original file | Final file |
|---|---|---|
| Filename | modeM0/AS1A11_097T08_9000004874_34116cztM0_level2.evt | modeM0/AS1A11_097T08_9000004874_34116cztM0_level2_quad_clean.evt |
| Size (bytes) | 495,524,160 | 81,377,280 |
| Size | 472.6 MB | 77.6 MB |
| Events in quadrant A | 2,532,558 | 537,312 |
| Events in quadrant B | 3,179,120 | 552,415 |
| Events in quadrant C | 3,692,427 | 525,997 |
| Events in quadrant D | 5,239,991 | 473,489 |
| Mode M9 | |||
|---|---|---|---|
| Quadrant | BADHDUFLAG | Total packets | Discarded packets |
| A | 0 | 37 | 0 |
| B | 0 | 37 | 0 |
| C | 0 | 37 | 0 |
| D | 0 | 37 | 0 |
| Mode M0 | |||
|---|---|---|---|
| Quadrant | BADHDUFLAG | Total packets | Discarded packets |
| A | 0 | 10937 | 3 |
| B | 0 | 12900 | 2 |
| C | 0 | 14313 | 2 |
| D | 0 | 19308 | 2 |
| Mode SS | |||
|---|---|---|---|
| Quadrant | BADHDUFLAG | Total packets | Discarded packets |
| A | 0 | 110 | 0 |
| B | 0 | 110 | 0 |
| C | 0 | 110 | 0 |
| D | 0 | 110 | 0 |
| Quadrant | Total seconds | Saturated seconds | Saturation percentage |
|---|---|---|---|
| A | 5358 | 5 | 0.093318% |
| B | 5358 | 52 | 0.970511% |
| C | 5358 | 201 | 3.751400% |
| D | 5358 | 511 | 9.537141% |
Noise dominated data is calculated using 1-second bins in cleaned event files. If a bin has >2000 counts, and if more than 50% of those come from <1% of pixels, then it is considered to be noise-dominated and hence unusable.
| Quadrant | # 1 sec bins | Bins with >0 counts | Bins with >2000 counts | High rate bins dominated by noise | Noise dominated (total time) | Noise dominated (detector-on time) | Marked lightcurve |
|---|---|---|---|---|---|---|---|
| A | 9003 | 5360 | 0 | 0 | 0.00% | 0.00% | 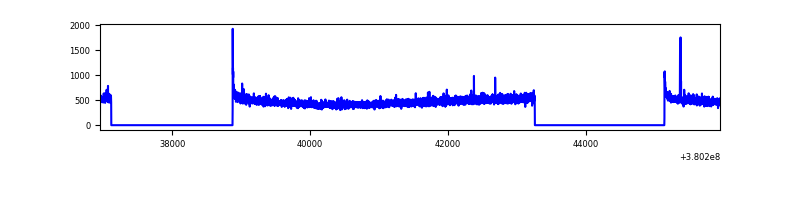 |
| B | 9003 | 5360 | 22 | 22 | 0.24% | 0.41% | 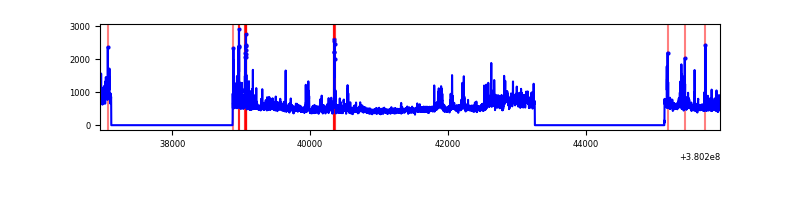 |
| C | 9003 | 5360 | 173 | 173 | 1.92% | 3.23% | 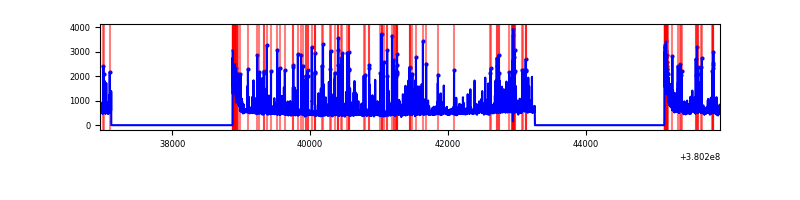 |
| D | 9003 | 5360 | 450 | 450 | 5.00% | 8.40% | 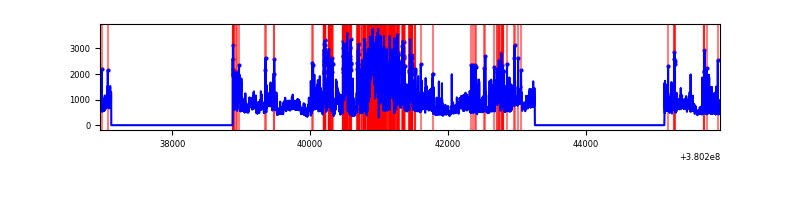 |
Top three noisy pixels from each quadrant. If the there are fewer than three noisy pixels in the level2.evt file, extra rows are filled as -1
| Pixel properties | Quadrant properties | ||||||
|---|---|---|---|---|---|---|---|
| Quadrant | DetID | PixID | Counts | Sigma | Mean | Median | Sigma |
| A | 10 | 83 | 19962 | 148.97 | 643 | 632 | 129.8 |
| A | 13 | 6 | 14303 | 105.36 | 643 | 632 | 129.8 |
| A | 13 | 254 | 9487 | 68.24 | 643 | 632 | 129.8 |
| B | 0 | 189 | 182125 | 1486.45 | 644 | 629 | 122.1 |
| B | 5 | 172 | 153189 | 1249.47 | 644 | 629 | 122.1 |
| B | 0 | 190 | 80768 | 656.34 | 644 | 629 | 122.1 |
| C | 0 | 10 | 815381 | 5702.22 | 617 | 622 | 142.9 |
| C | 15 | 214 | 230676 | 1610.07 | 617 | 622 | 142.9 |
| C | 14 | 254 | 155102 | 1081.15 | 617 | 622 | 142.9 |
| D | 2 | 250 | 1452416 | 9269.57 | 594 | 580 | 156.6 |
| D | 8 | 195 | 733611 | 4680.2 | 594 | 580 | 156.6 |
| D | 13 | 249 | 206095 | 1312.16 | 594 | 580 | 156.6 |
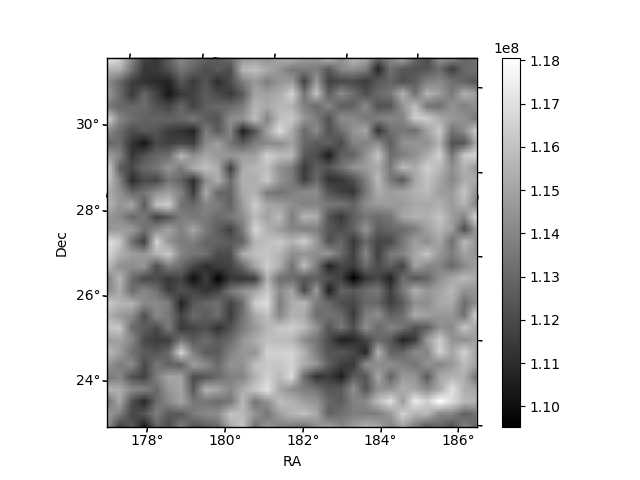
Histogram calculated using DETX and DETY for each event in the final _common_clean file
| Quadrant A | 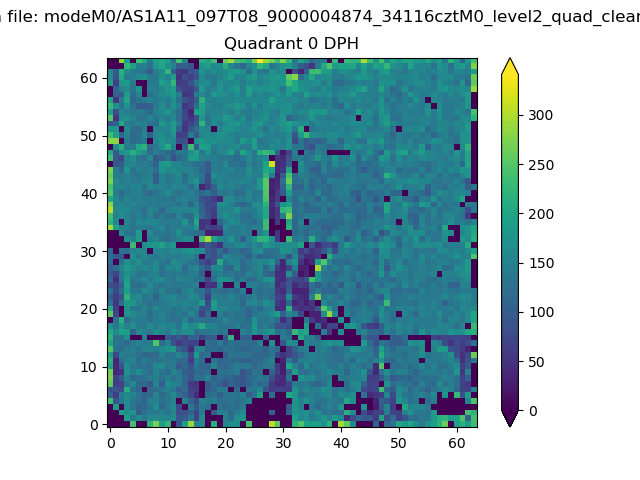 |
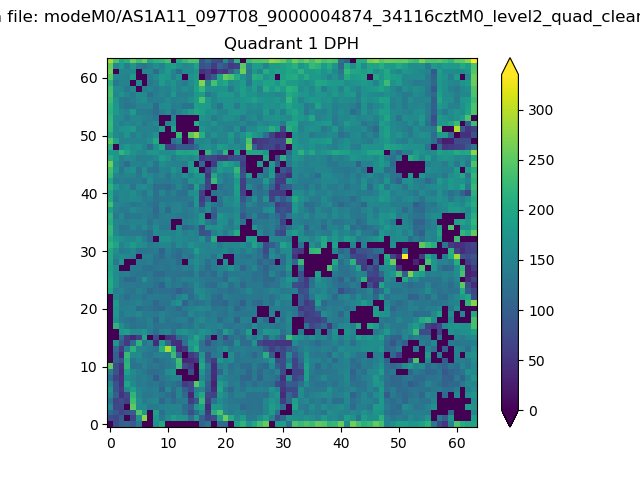 |
Quadrant B |
|---|---|---|---|
| Quadrant D | 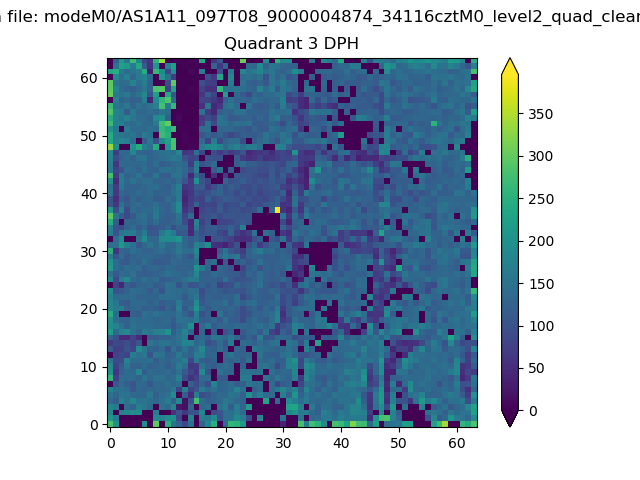 |
 |
Quadrant C |
| Plot type | Count rate plots | Images |
|---|---|---|
| Comparison with Poisson distribution Blue bars denote a histogram of data divided into 1 sec bins. Red curve is a Poisson curve with rate = median count rate of data. |
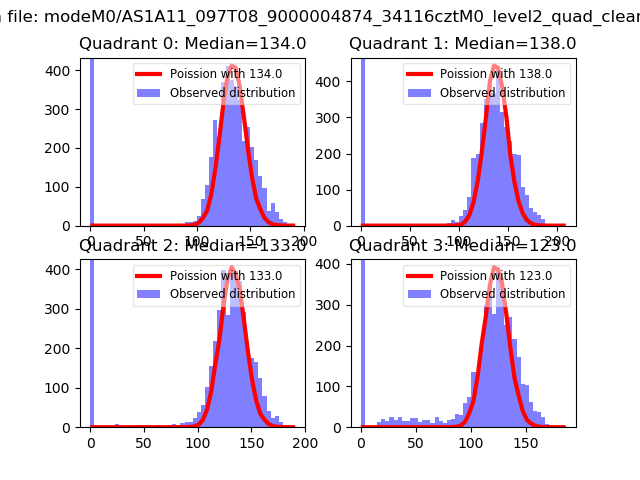 |
 |
| Quadrant-wise count rates Data is divided into 100 sec bins |
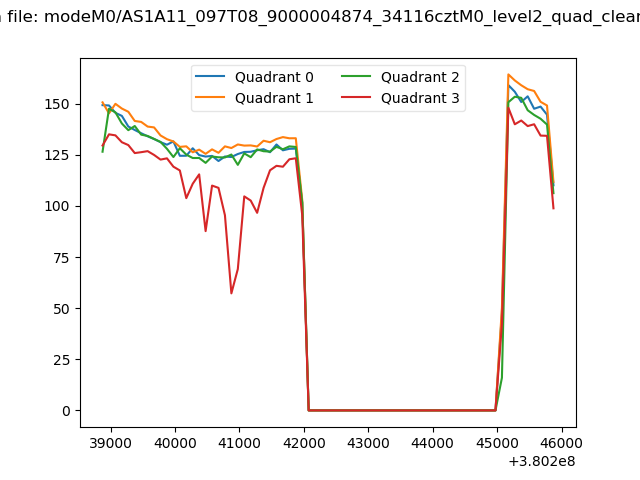 |
|
| Module-wise count rates for Quadrant A Data is divided into 100 sec bins |
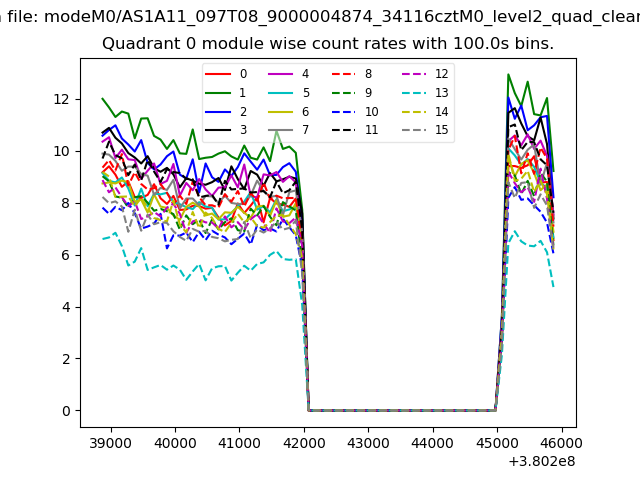 |
 |
| Module-wise count rates for Quadrant B Data is divided into 100 sec bins |
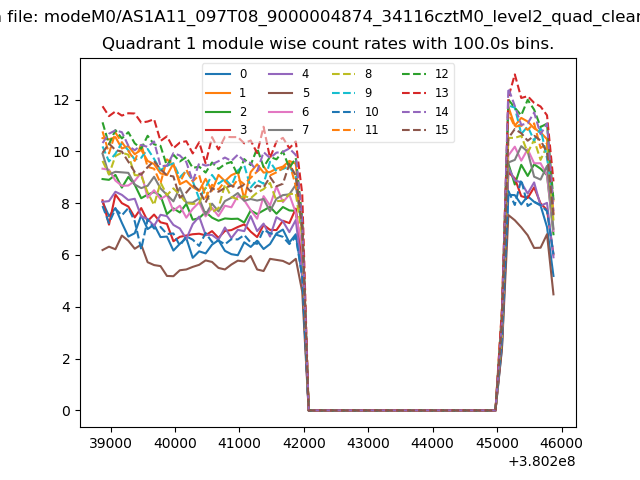 |
 |
| Module-wise count rates for Quadrant C Data is divided into 100 sec bins |
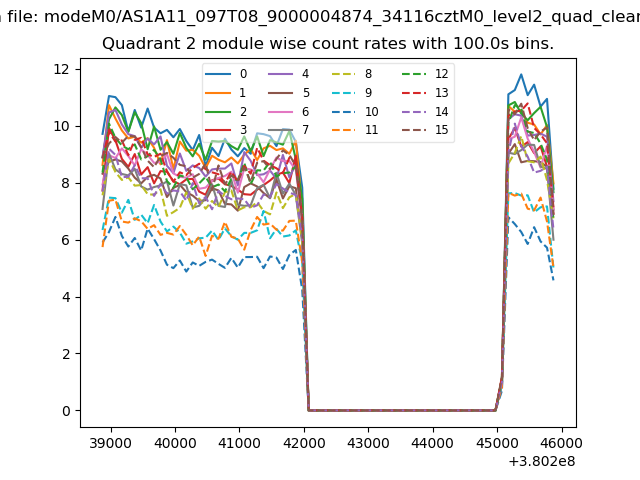 |
 |
| Module-wise count rates for Quadrant D Data is divided into 100 sec bins |
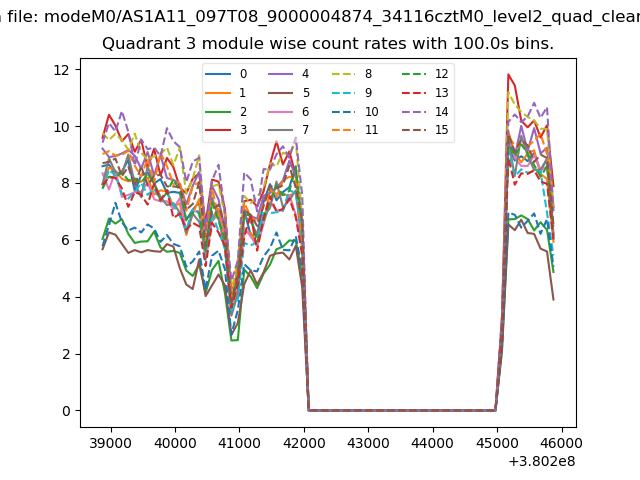 |
 |
| Parameter | Plot |
|---|---|
| CZT HV Monitor | 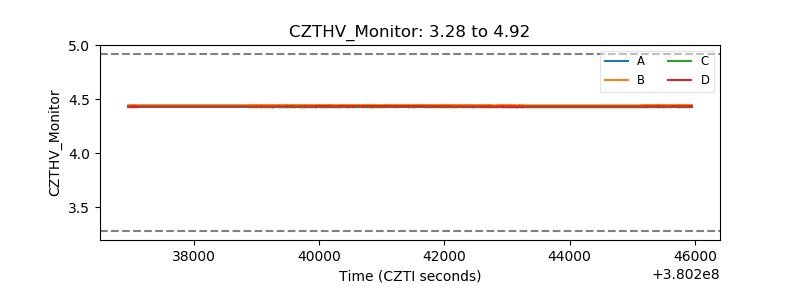 |
| D_VDD | 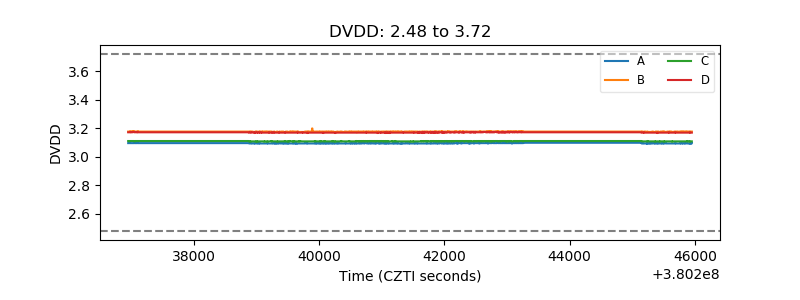 |
| Temperature 1 | 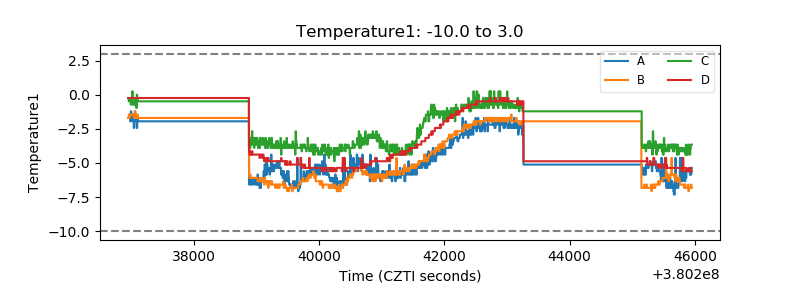 |
| Veto HV Monitor | 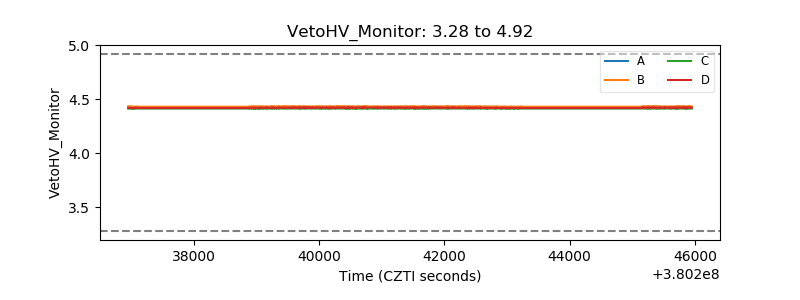 |
| Veto LLD | 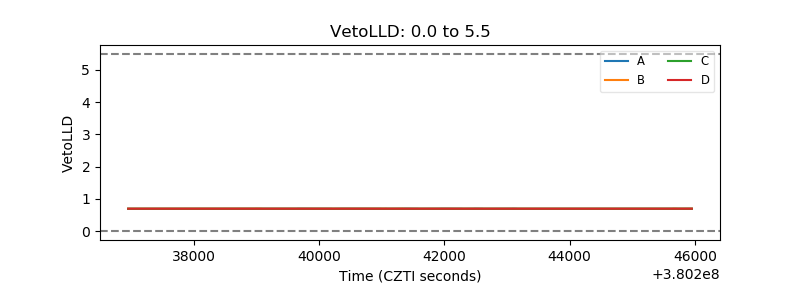 |
| Alpha Counter | 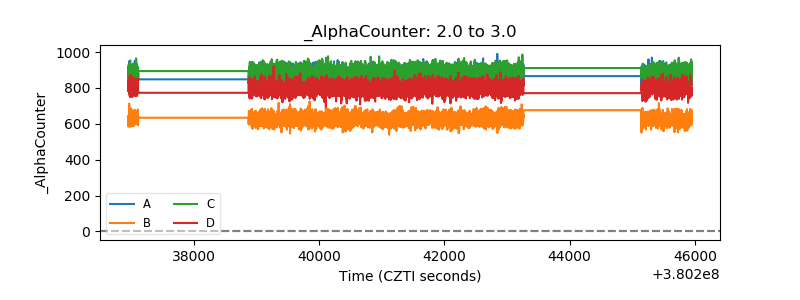 |
| _CPM_Rate | 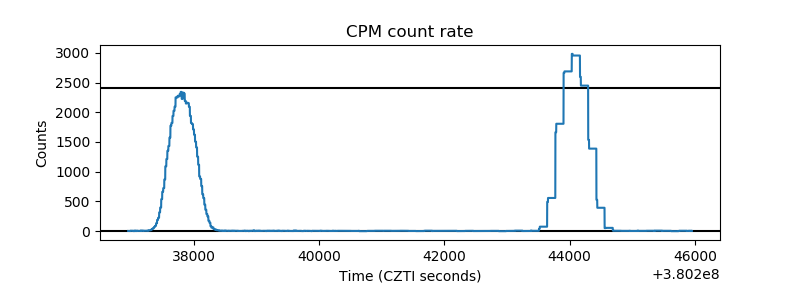 |
| CZT Counter |  |
| +2.5 Volts monitor |  |
| +5 Volts monitor |  |
| _ROLL_ROT | 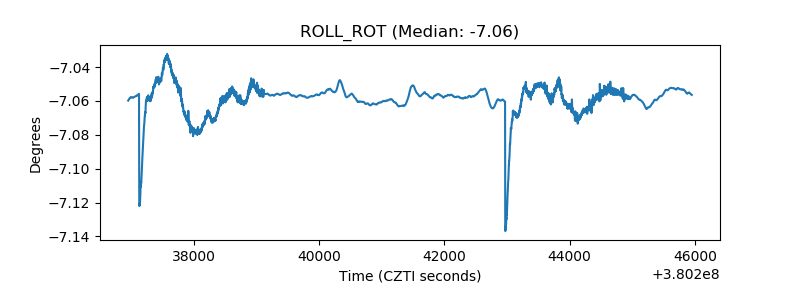 |
| _Roll_DEC | 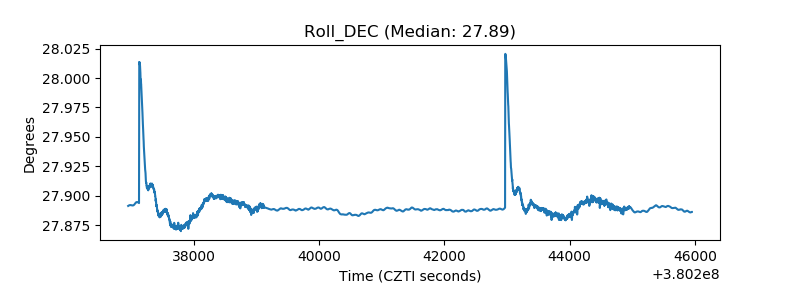 |
| _Roll_RA | 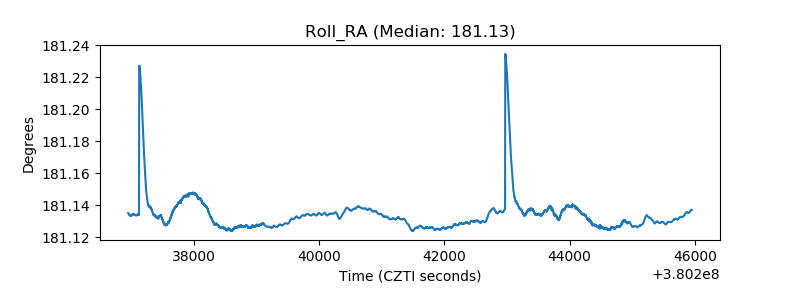 |
| Veto Counter | 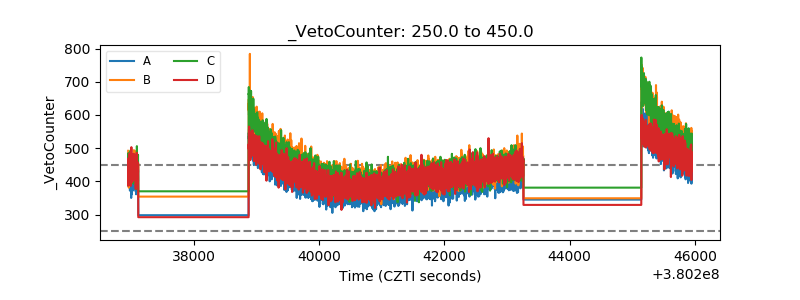 |