| Param | Original file | Final file |
|---|---|---|
| Filename | modeM0/AS1A11_097T08_9000004874_34118cztM0_level2.evt | modeM0/AS1A11_097T08_9000004874_34118cztM0_level2_quad_clean.evt |
| Size (bytes) | 462,026,880 | 75,954,240 |
| Size | 440.6 MB | 72.4 MB |
| Events in quadrant A | 2,559,204 | 493,481 |
| Events in quadrant B | 3,173,783 | 508,413 |
| Events in quadrant C | 3,457,013 | 480,744 |
| Events in quadrant D | 4,445,740 | 448,829 |
| Mode M9 | |||
|---|---|---|---|
| Quadrant | BADHDUFLAG | Total packets | Discarded packets |
| A | 0 | 30 | 0 |
| B | 0 | 30 | 0 |
| C | 0 | 30 | 0 |
| D | 0 | 31 | 0 |
| Mode M0 | |||
|---|---|---|---|
| Quadrant | BADHDUFLAG | Total packets | Discarded packets |
| A | 0 | 10678 | 3 |
| B | 0 | 12715 | 2 |
| C | 0 | 13629 | 2 |
| D | 0 | 16808 | 2 |
| Mode SS | |||
|---|---|---|---|
| Quadrant | BADHDUFLAG | Total packets | Discarded packets |
| A | 0 | 108 | 0 |
| B | 0 | 108 | 0 |
| C | 0 | 108 | 0 |
| D | 0 | 108 | 0 |
| Quadrant | Total seconds | Saturated seconds | Saturation percentage |
|---|---|---|---|
| A | 5259 | 6 | 0.114090% |
| B | 5259 | 87 | 1.654307% |
| C | 5259 | 125 | 2.376878% |
| D | 5259 | 308 | 5.856627% |
Noise dominated data is calculated using 1-second bins in cleaned event files. If a bin has >2000 counts, and if more than 50% of those come from <1% of pixels, then it is considered to be noise-dominated and hence unusable.
| Quadrant | # 1 sec bins | Bins with >0 counts | Bins with >2000 counts | High rate bins dominated by noise | Noise dominated (total time) | Noise dominated (detector-on time) | Marked lightcurve |
|---|---|---|---|---|---|---|---|
| A | 7352 | 5260 | 0 | 0 | 0.00% | 0.00% | 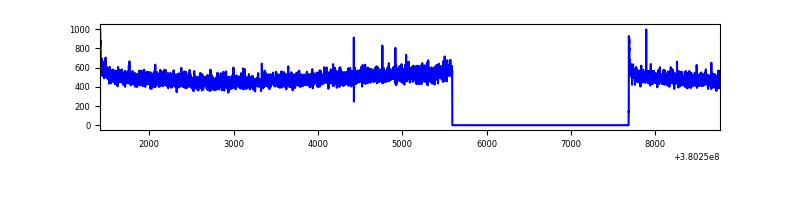 |
| B | 7352 | 5260 | 51 | 51 | 0.69% | 0.97% | 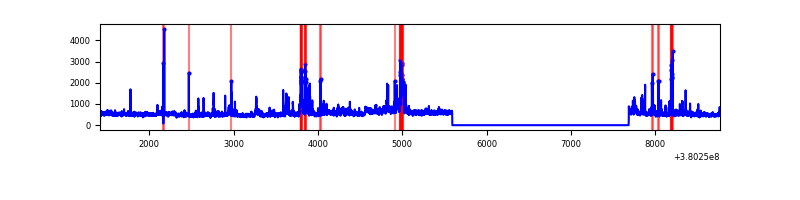 |
| C | 7352 | 5260 | 114 | 114 | 1.55% | 2.17% | 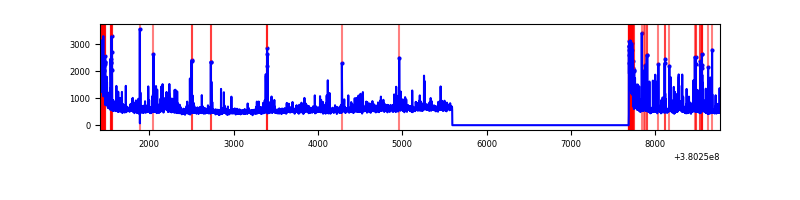 |
| D | 7352 | 5260 | 309 | 309 | 4.20% | 5.87% | 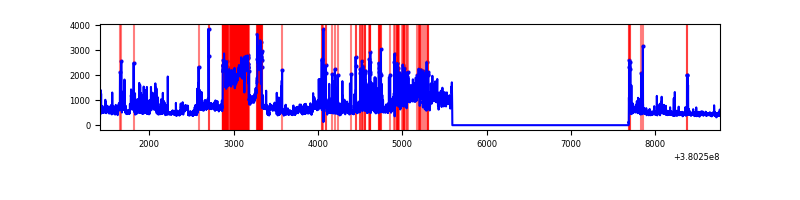 |
Top three noisy pixels from each quadrant. If the there are fewer than three noisy pixels in the level2.evt file, extra rows are filled as -1
| Pixel properties | Quadrant properties | ||||||
|---|---|---|---|---|---|---|---|
| Quadrant | DetID | PixID | Counts | Sigma | Mean | Median | Sigma |
| A | 10 | 83 | 20108 | 148.96 | 655 | 641 | 130.7 |
| A | 13 | 6 | 11148 | 80.4 | 655 | 641 | 130.7 |
| A | 13 | 254 | 9238 | 65.78 | 655 | 641 | 130.7 |
| B | 5 | 172 | 356509 | 2894.84 | 652 | 637 | 122.9 |
| B | 0 | 219 | 95525 | 771.87 | 652 | 637 | 122.9 |
| B | 0 | 229 | 50249 | 403.57 | 652 | 637 | 122.9 |
| C | 0 | 10 | 704596 | 4900.84 | 627 | 633 | 143.6 |
| C | 15 | 214 | 230379 | 1599.44 | 627 | 633 | 143.6 |
| C | 14 | 254 | 23736 | 160.84 | 627 | 633 | 143.6 |
| D | 15 | 0 | 647285 | 4196.5 | 617 | 602 | 154.1 |
| D | 8 | 195 | 525645 | 3407.14 | 617 | 602 | 154.1 |
| D | 10 | 118 | 297347 | 1925.66 | 617 | 602 | 154.1 |
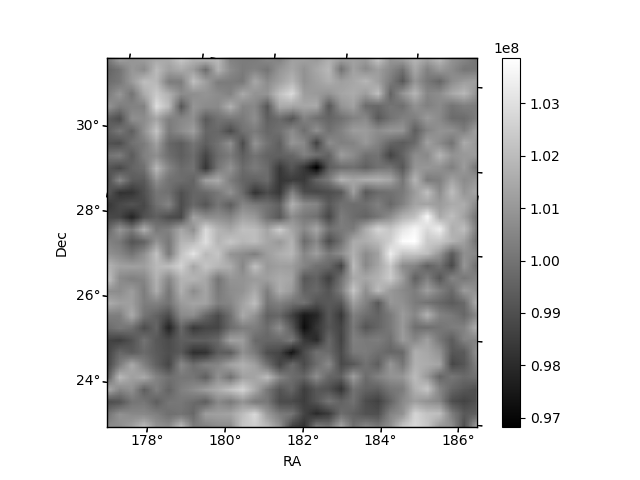
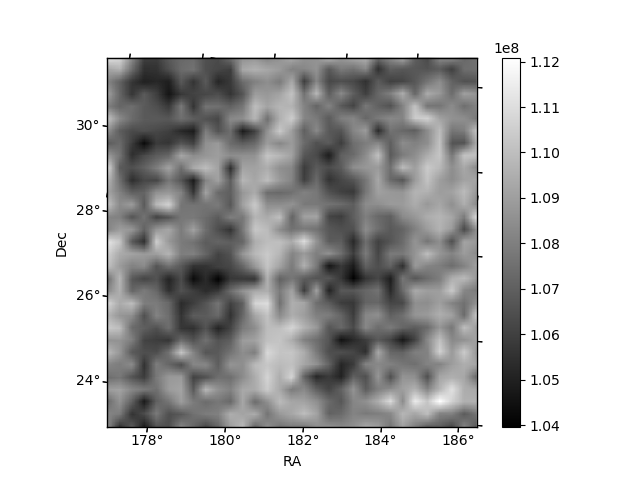
Histogram calculated using DETX and DETY for each event in the final _common_clean file
| Quadrant A | 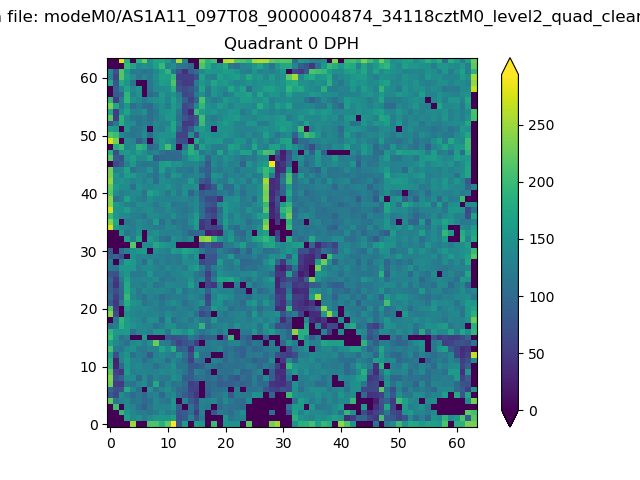 |
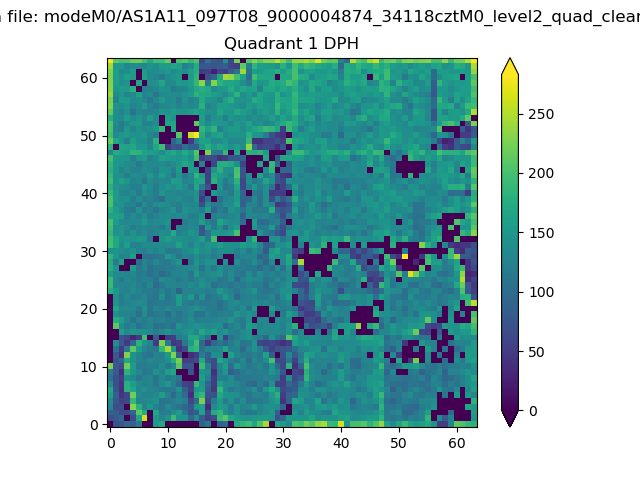 |
Quadrant B |
|---|---|---|---|
| Quadrant D | 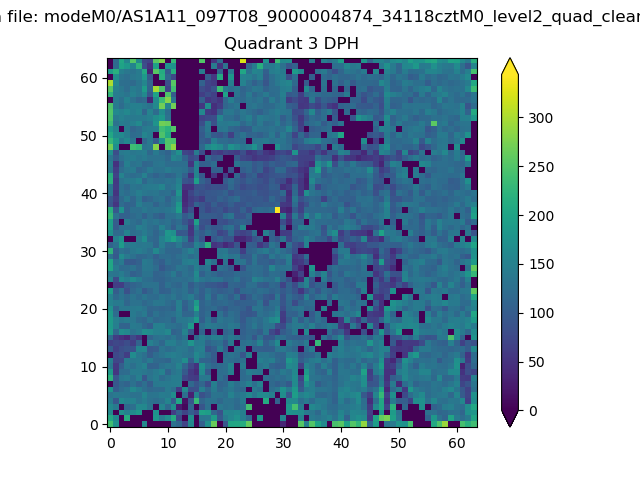 |
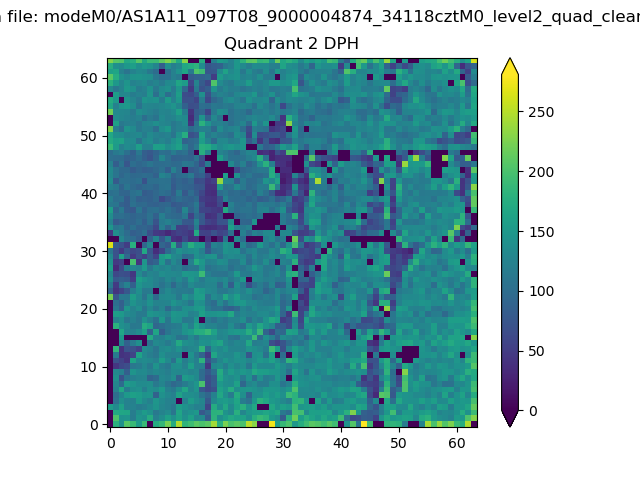 |
Quadrant C |
| Plot type | Count rate plots | Images |
|---|---|---|
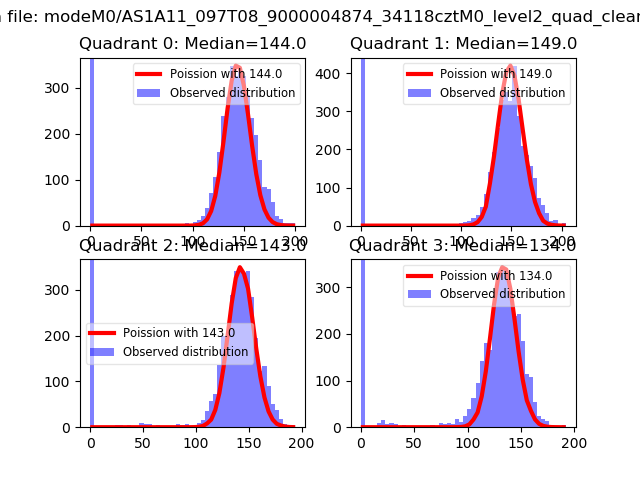
| Comparison with Poisson distribution Blue bars denote a histogram of data divided into 1 sec bins. Red curve is a Poisson curve with rate = median count rate of data. |
 |
 |
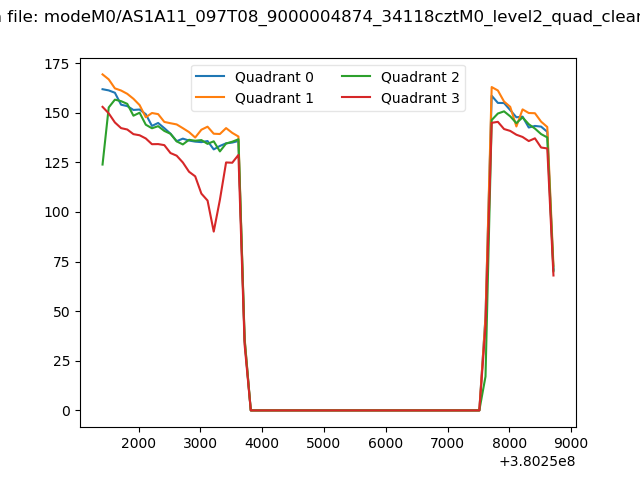
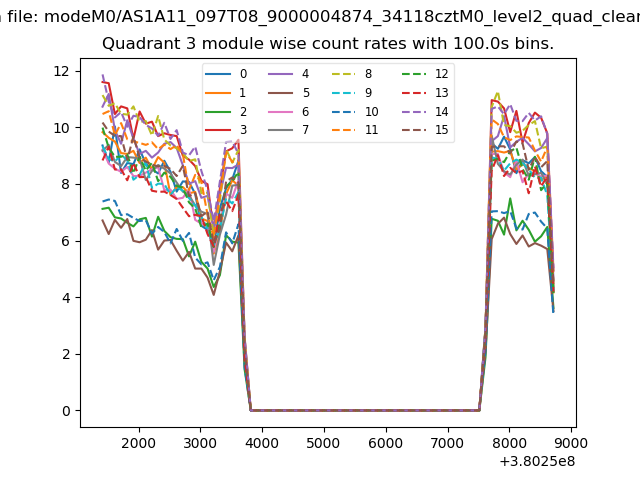
| Quadrant-wise count rates Data is divided into 100 sec bins |
 |
|
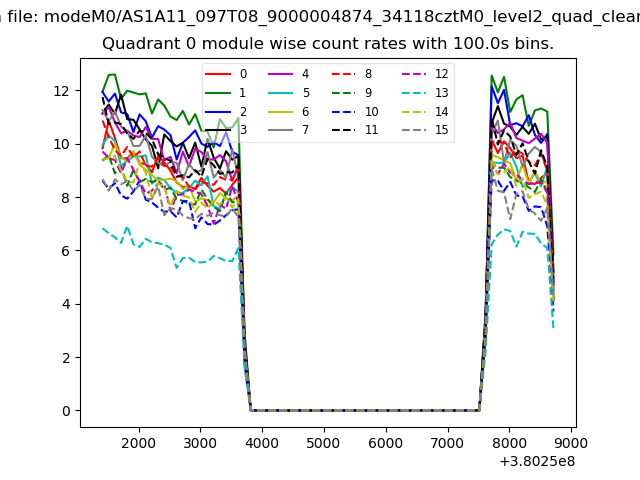
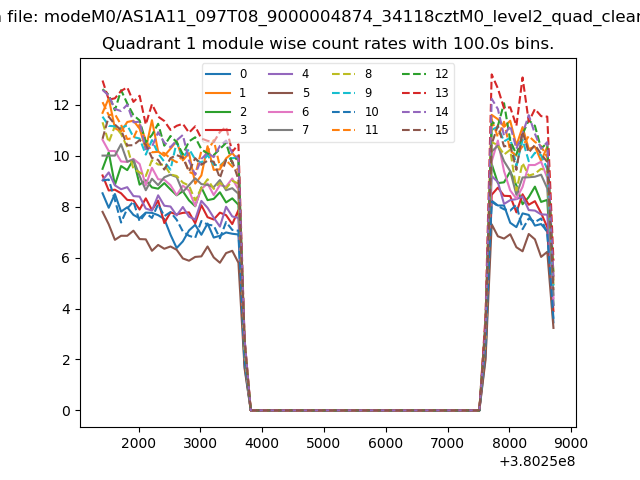
| Module-wise count rates for Quadrant A Data is divided into 100 sec bins |
 |
 |
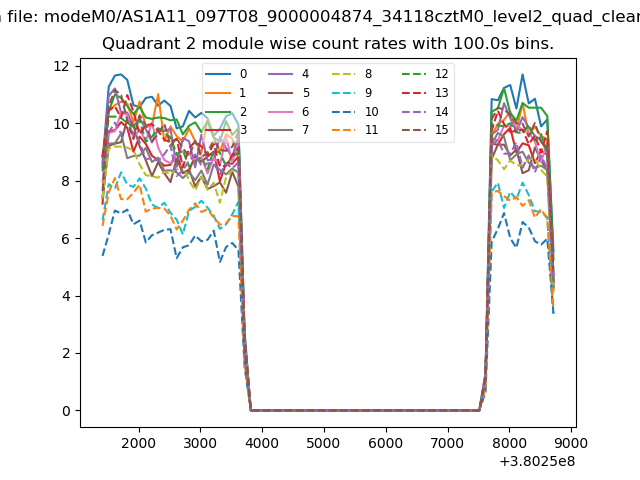
| Module-wise count rates for Quadrant B Data is divided into 100 sec bins |
 |
 |
| Module-wise count rates for Quadrant C Data is divided into 100 sec bins |
 |
 |
| Module-wise count rates for Quadrant D Data is divided into 100 sec bins |
 |
 |
| Parameter | Plot |
|---|---|
| CZT HV Monitor | 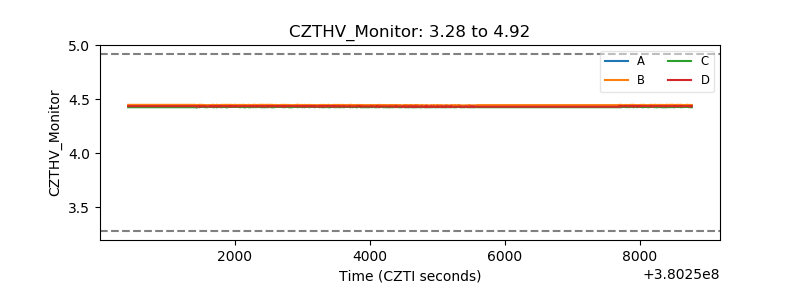 |
| D_VDD | 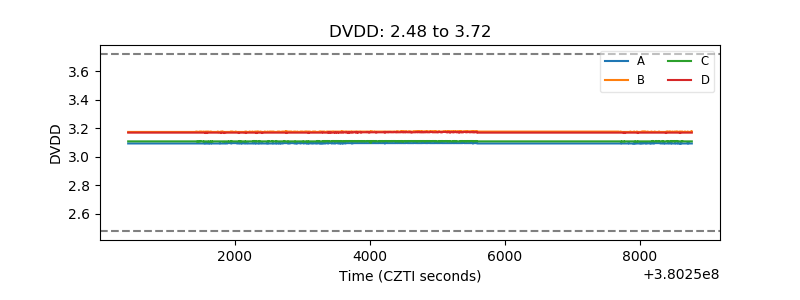 |
| Temperature 1 | 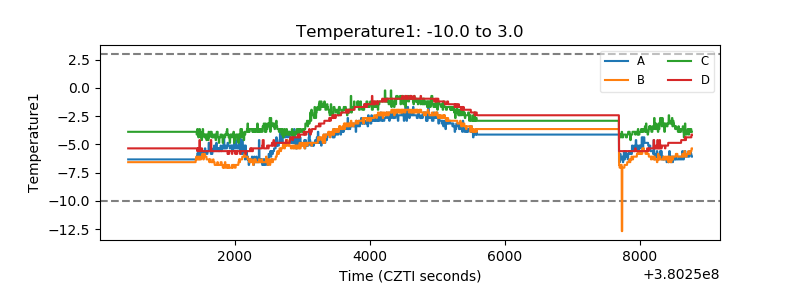 |
| Veto HV Monitor | 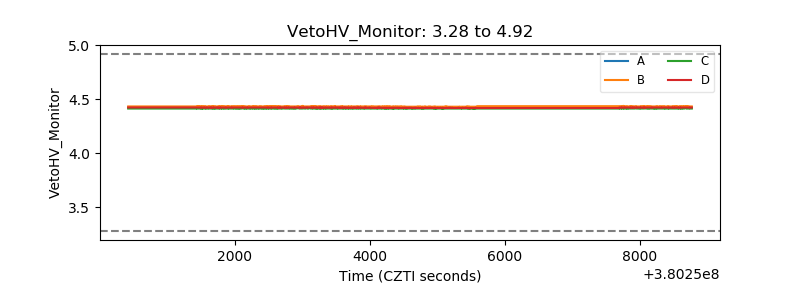 |
| Veto LLD | 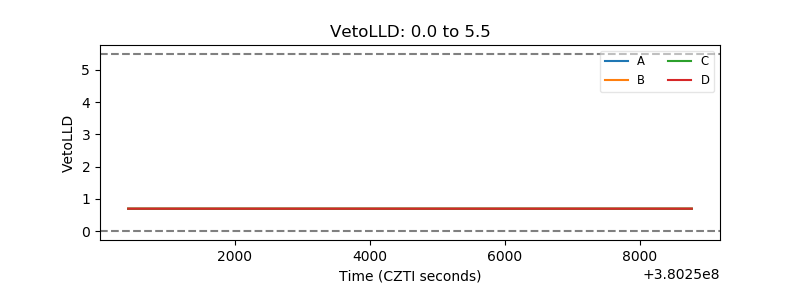 |
| Alpha Counter | 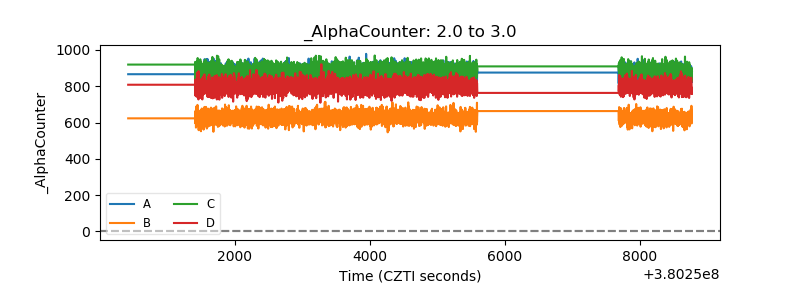 |
| _CPM_Rate | 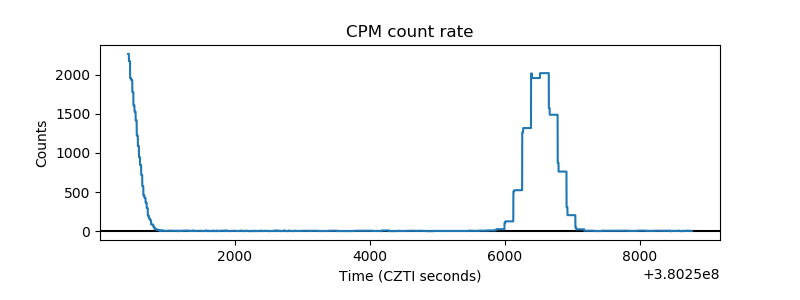 |
| CZT Counter | 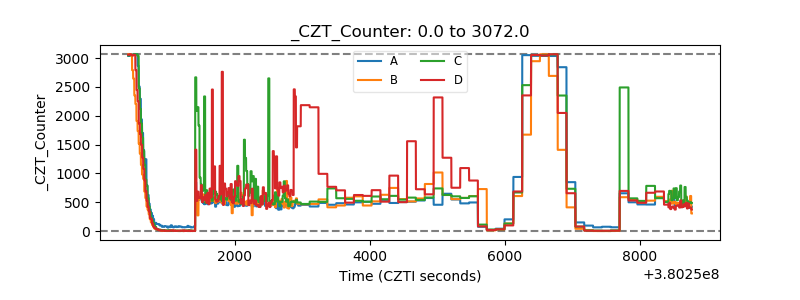 |
| +2.5 Volts monitor |  |
| +5 Volts monitor | 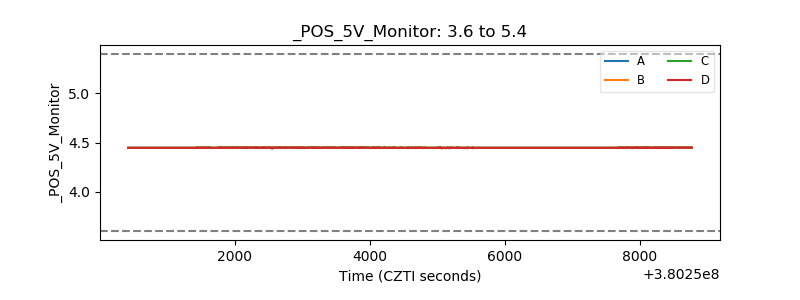 |
| _ROLL_ROT | 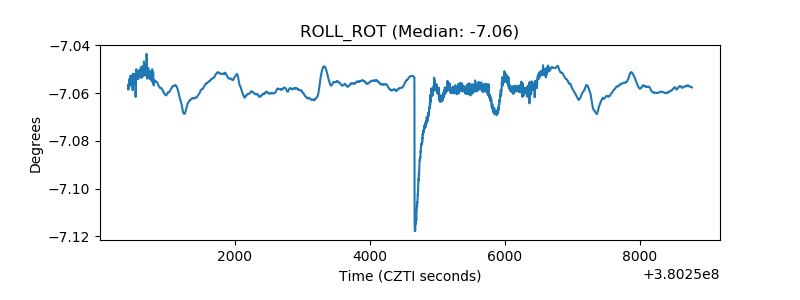 |
| _Roll_DEC |  |
| _Roll_RA | 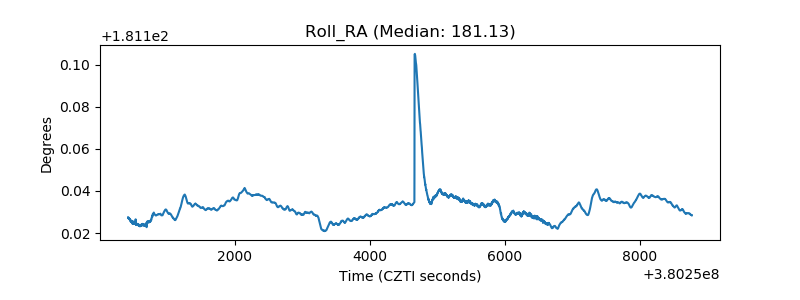 |
| Veto Counter | 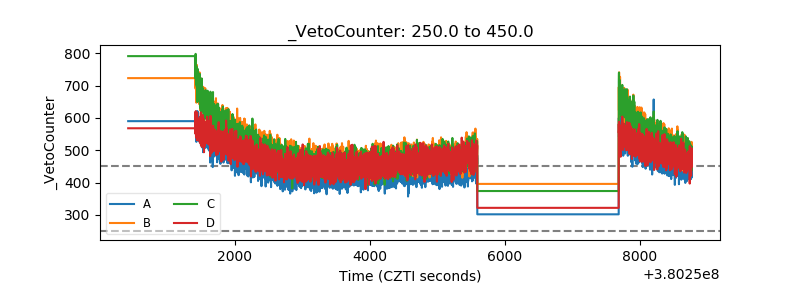 |