| Param | Original file | Final file |
|---|---|---|
| Filename | modeM0/AS1A11_097T08_9000004874_34119cztM0_level2.evt | modeM0/AS1A11_097T08_9000004874_34119cztM0_level2_quad_clean.evt |
| Size (bytes) | 454,207,680 | 64,788,480 |
| Size | 433.2 MB | 61.8 MB |
| Events in quadrant A | 2,474,543 | 409,411 |
| Events in quadrant B | 3,091,630 | 417,411 |
| Events in quadrant C | 3,712,228 | 394,828 |
| Events in quadrant D | 4,131,387 | 382,753 |
| Mode M9 | |||
|---|---|---|---|
| Quadrant | BADHDUFLAG | Total packets | Discarded packets |
| A | 0 | 22 | 0 |
| B | 0 | 22 | 0 |
| C | 0 | 22 | 0 |
| D | 0 | 22 | 0 |
| Mode M0 | |||
|---|---|---|---|
| Quadrant | BADHDUFLAG | Total packets | Discarded packets |
| A | 0 | 10322 | 3 |
| B | 0 | 12193 | 2 |
| C | 0 | 14255 | 2 |
| D | 0 | 15641 | 2 |
| Mode SS | |||
|---|---|---|---|
| Quadrant | BADHDUFLAG | Total packets | Discarded packets |
| A | 0 | 104 | 0 |
| B | 0 | 104 | 0 |
| C | 0 | 104 | 0 |
| D | 0 | 104 | 0 |
| Quadrant | Total seconds | Saturated seconds | Saturation percentage |
|---|---|---|---|
| A | 5097 | 8 | 0.156955% |
| B | 5097 | 156 | 3.060624% |
| C | 5097 | 157 | 3.080243% |
| D | 5097 | 420 | 8.240141% |
Noise dominated data is calculated using 1-second bins in cleaned event files. If a bin has >2000 counts, and if more than 50% of those come from <1% of pixels, then it is considered to be noise-dominated and hence unusable.
| Quadrant | # 1 sec bins | Bins with >0 counts | Bins with >2000 counts | High rate bins dominated by noise | Noise dominated (total time) | Noise dominated (detector-on time) | Marked lightcurve |
|---|---|---|---|---|---|---|---|
| A | 7249 | 5098 | 0 | 0 | 0.00% | 0.00% | 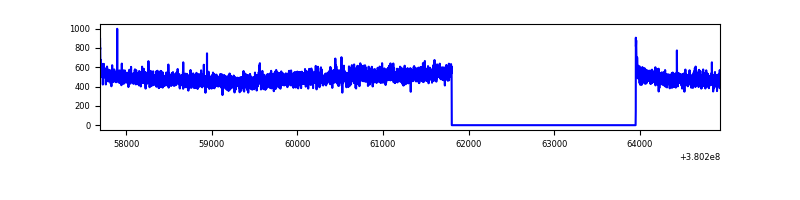 |
| B | 7249 | 5098 | 94 | 94 | 1.30% | 1.84% | 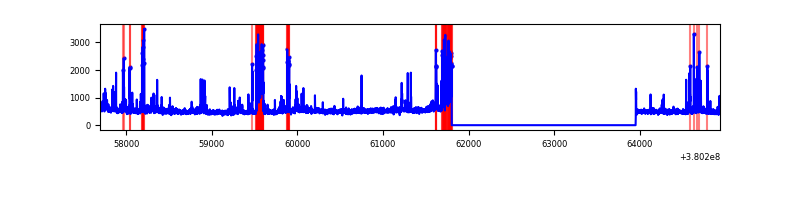 |
| C | 7249 | 5098 | 157 | 157 | 2.17% | 3.08% | 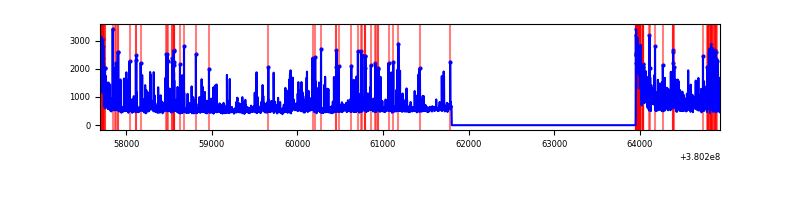 |
| D | 7249 | 5098 | 366 | 366 | 5.05% | 7.18% | 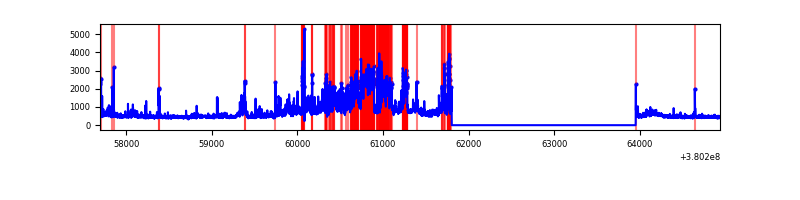 |
Top three noisy pixels from each quadrant. If the there are fewer than three noisy pixels in the level2.evt file, extra rows are filled as -1
| Pixel properties | Quadrant properties | ||||||
|---|---|---|---|---|---|---|---|
| Quadrant | DetID | PixID | Counts | Sigma | Mean | Median | Sigma |
| A | 10 | 83 | 18980 | 144.29 | 633 | 621 | 127.2 |
| A | 13 | 6 | 11615 | 86.41 | 633 | 621 | 127.2 |
| A | 13 | 254 | 8261 | 60.05 | 633 | 621 | 127.2 |
| B | 5 | 172 | 489198 | 4172.07 | 623 | 610 | 117.1 |
| B | 4 | 251 | 47446 | 399.93 | 623 | 610 | 117.1 |
| B | 0 | 190 | 25034 | 208.56 | 623 | 610 | 117.1 |
| C | 0 | 10 | 1114780 | 7998.3 | 601 | 606 | 139.3 |
| C | 15 | 214 | 224090 | 1604.32 | 601 | 606 | 139.3 |
| C | 14 | 67 | 13359 | 91.55 | 601 | 606 | 139.3 |
| D | 10 | 118 | 706993 | 4879.26 | 589 | 573 | 144.8 |
| D | 8 | 195 | 523307 | 3610.54 | 589 | 573 | 144.8 |
| D | 12 | 128 | 106153 | 729.24 | 589 | 573 | 144.8 |
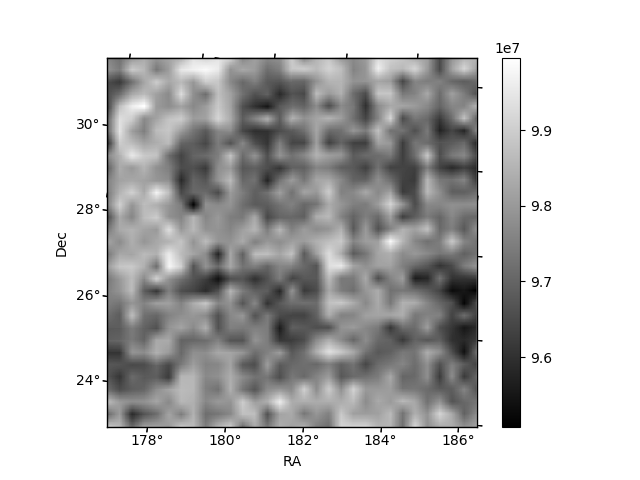
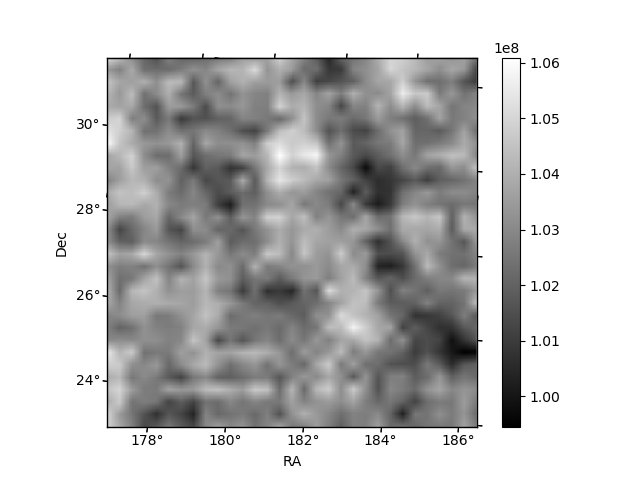
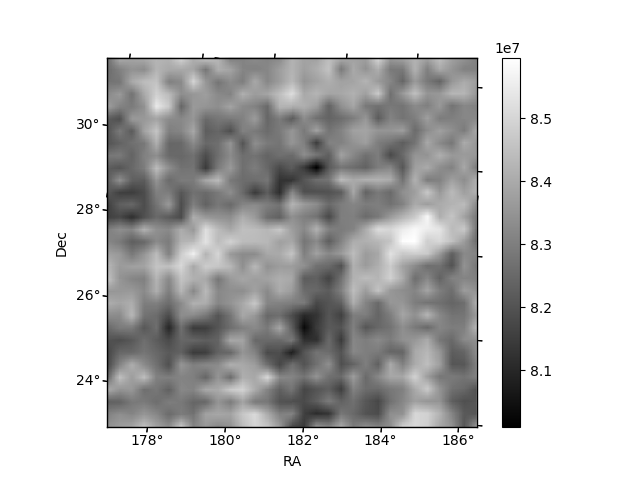
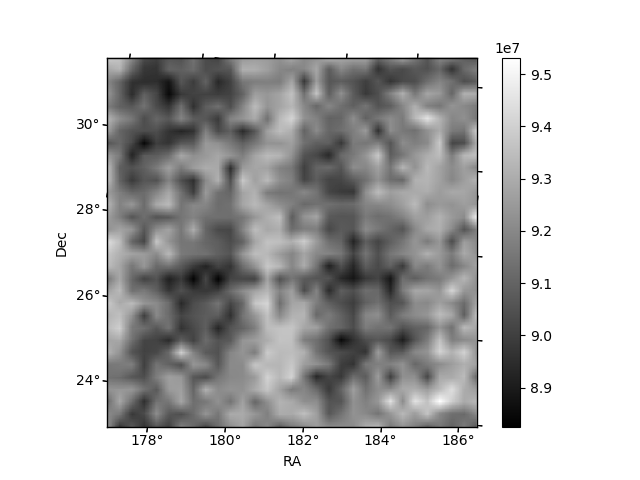
Histogram calculated using DETX and DETY for each event in the final _common_clean file
| Quadrant A | 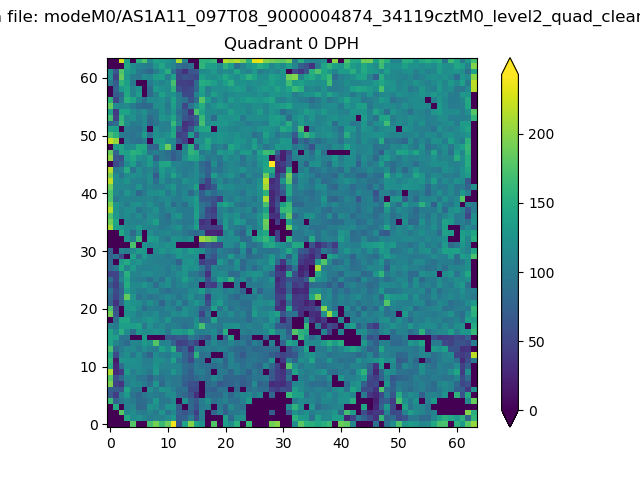 |
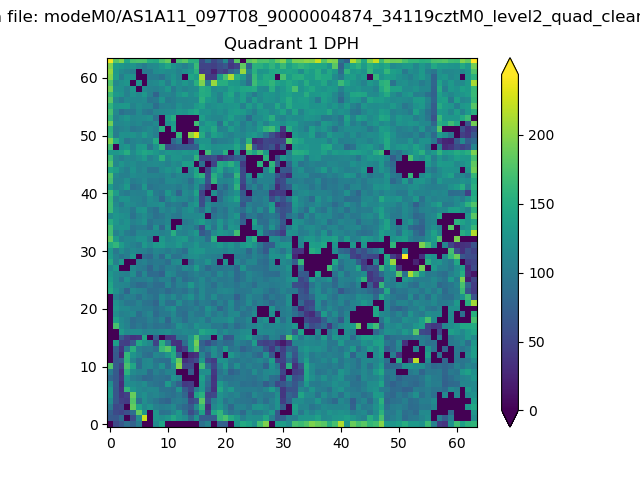 |
Quadrant B |
|---|---|---|---|
| Quadrant D | 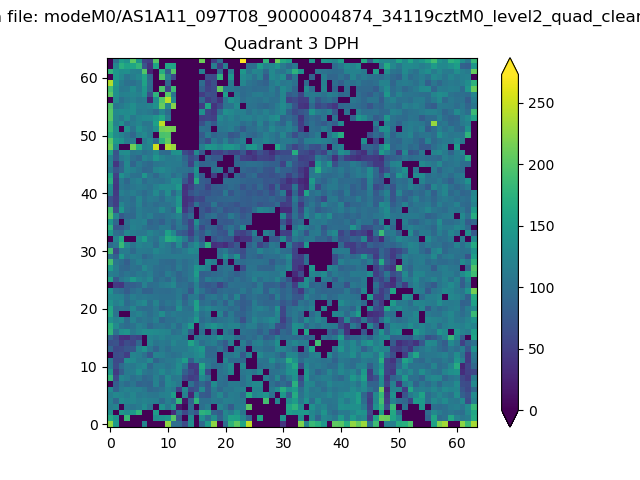 |
 |
Quadrant C |
| Plot type | Count rate plots | Images |
|---|---|---|
| Comparison with Poisson distribution Blue bars denote a histogram of data divided into 1 sec bins. Red curve is a Poisson curve with rate = median count rate of data. |
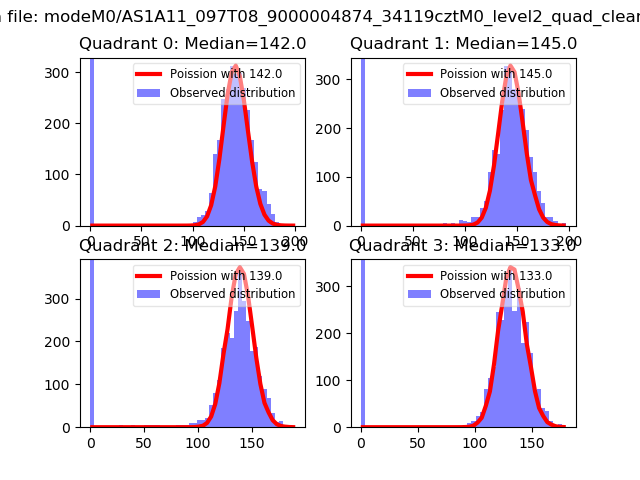 |
 |
| Quadrant-wise count rates Data is divided into 100 sec bins |
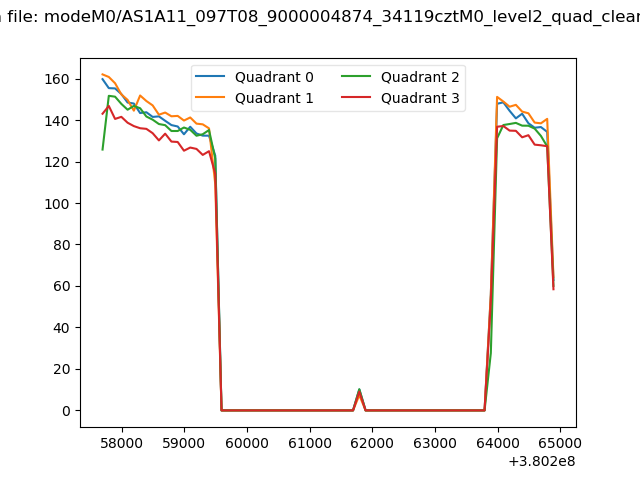 |
|
| Module-wise count rates for Quadrant A Data is divided into 100 sec bins |
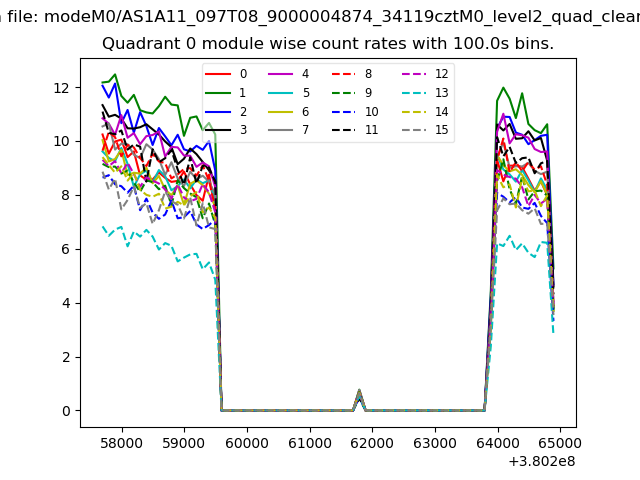 |
 |
| Module-wise count rates for Quadrant B Data is divided into 100 sec bins |
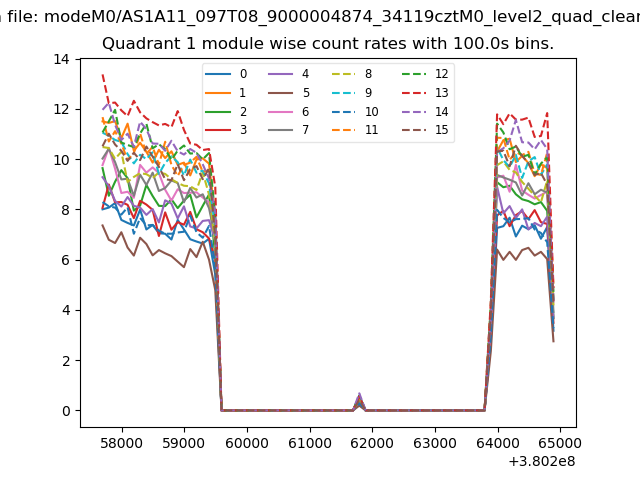 |
 |
| Module-wise count rates for Quadrant C Data is divided into 100 sec bins |
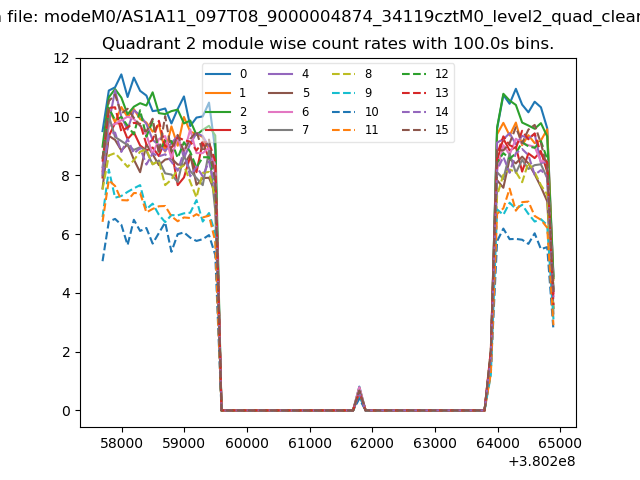 |
 |
| Module-wise count rates for Quadrant D Data is divided into 100 sec bins |
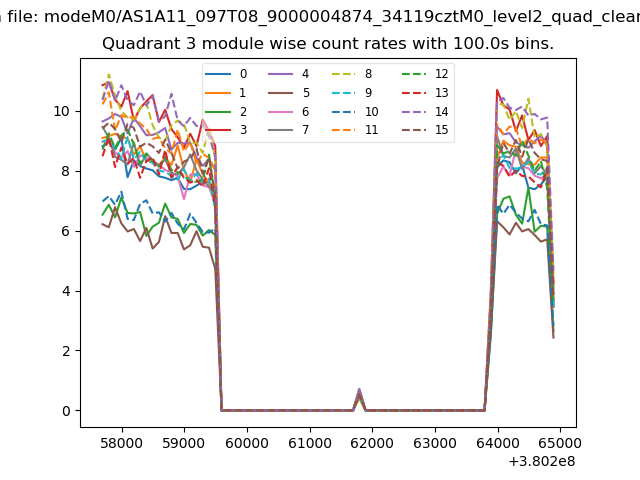 |
 |
| Parameter | Plot |
|---|---|
| CZT HV Monitor | 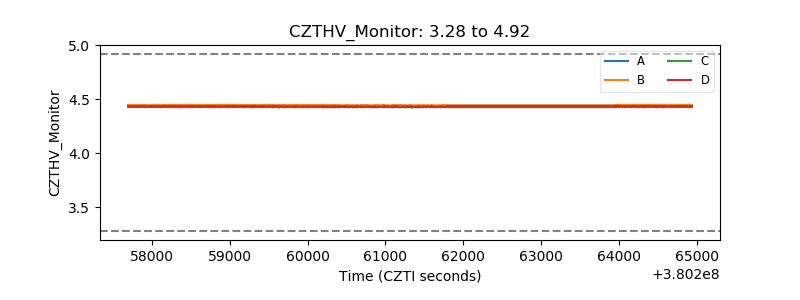 |
| D_VDD | 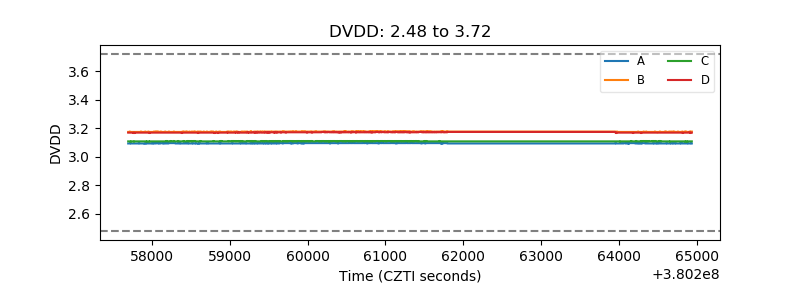 |
| Temperature 1 | 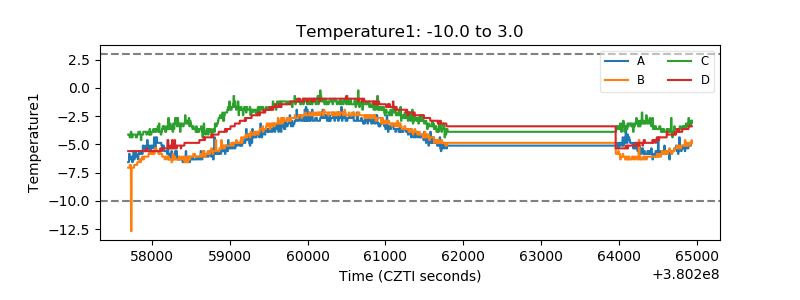 |
| Veto HV Monitor |  |
| Veto LLD | 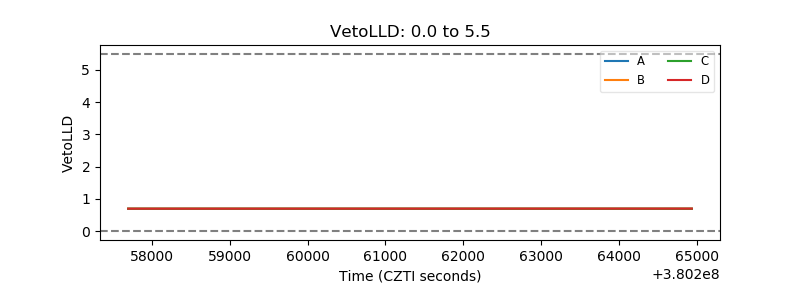 |
| Alpha Counter | 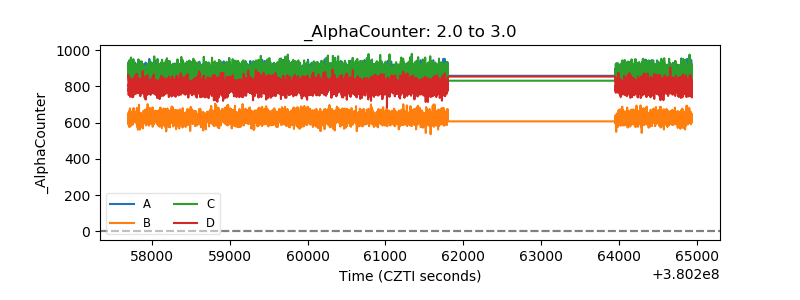 |
| _CPM_Rate | 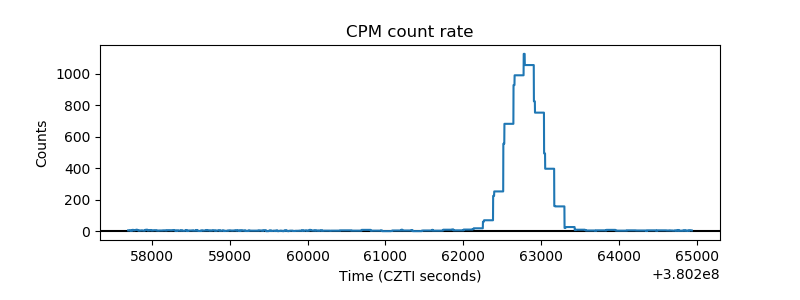 |
| CZT Counter |  |
| +2.5 Volts monitor |  |
| +5 Volts monitor | 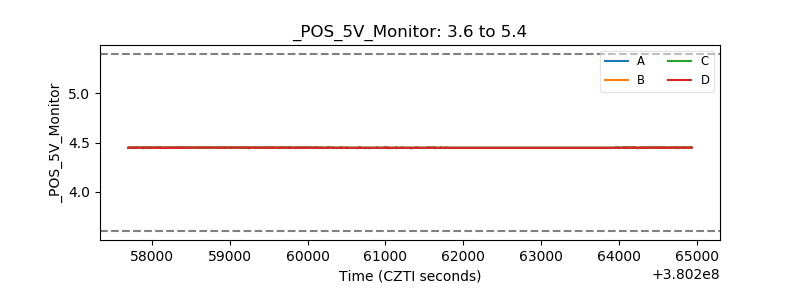 |
| _ROLL_ROT | 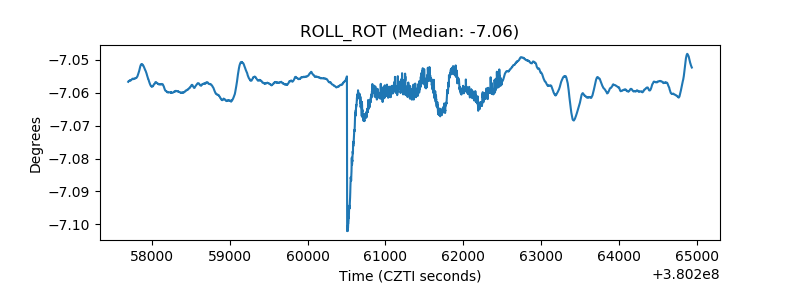 |
| _Roll_DEC | 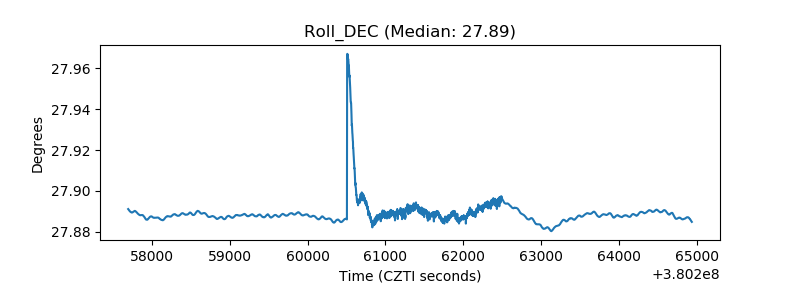 |
| _Roll_RA |  |
| Veto Counter | 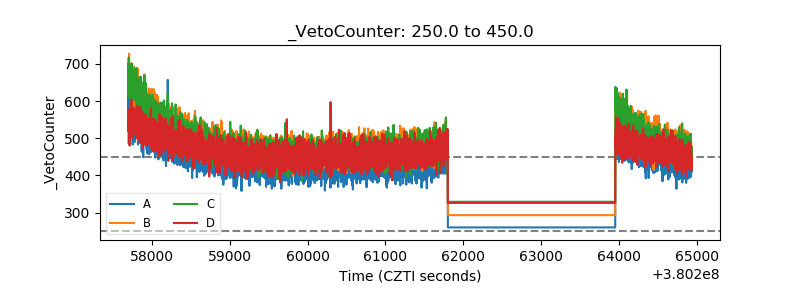 |