| Param | Original file | Final file |
|---|---|---|
| Filename | modeM0/AS1A11_097T08_9000004874_34122cztM0_level2.evt | modeM0/AS1A11_097T08_9000004874_34122cztM0_level2_quad_clean.evt |
| Size (bytes) | 2,302,318,080 | 306,607,680 |
| Size | 2.1 GB | 292.4 MB |
| Events in quadrant A | 12,727,529 | 1,905,734 |
| Events in quadrant B | 16,223,527 | 1,928,376 |
| Events in quadrant C | 17,443,614 | 1,846,934 |
| Events in quadrant D | 21,533,949 | 1,768,663 |
| Mode M9 | |||
|---|---|---|---|
| Quadrant | BADHDUFLAG | Total packets | Discarded packets |
| A | 0 | 125 | 0 |
| B | 0 | 125 | 0 |
| C | 0 | 125 | 0 |
| D | 0 | 126 | 0 |
| Mode M0 | |||
|---|---|---|---|
| Quadrant | BADHDUFLAG | Total packets | Discarded packets |
| A | 0 | 53978 | 7 |
| B | 0 | 64657 | 6 |
| C | 0 | 68325 | 6 |
| D | 0 | 82392 | 6 |
| Mode SS | |||
|---|---|---|---|
| Quadrant | BADHDUFLAG | Total packets | Discarded packets |
| A | 0 | 544 | 0 |
| B | 0 | 544 | 0 |
| C | 0 | 544 | 0 |
| D | 0 | 544 | 0 |
| Quadrant | Total seconds | Saturated seconds | Saturation percentage |
|---|---|---|---|
| A | 26714 | 25 | 0.093584% |
| B | 26714 | 763 | 2.856180% |
| C | 26714 | 603 | 2.257243% |
| D | 26714 | 1501 | 5.618777% |
Noise dominated data is calculated using 1-second bins in cleaned event files. If a bin has >2000 counts, and if more than 50% of those come from <1% of pixels, then it is considered to be noise-dominated and hence unusable.
| Quadrant | # 1 sec bins | Bins with >0 counts | Bins with >2000 counts | High rate bins dominated by noise | Noise dominated (total time) | Noise dominated (detector-on time) | Marked lightcurve |
|---|---|---|---|---|---|---|---|
| A | 38490 | 26720 | 0 | 0 | 0.00% | 0.00% | 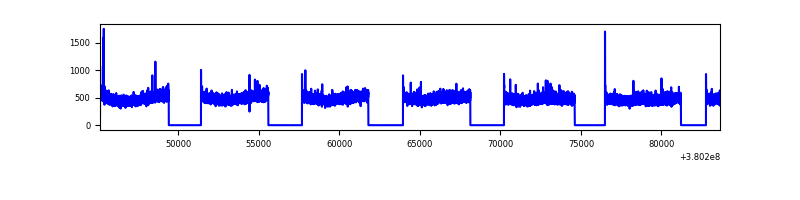 |
| B | 38490 | 26720 | 495 | 495 | 1.29% | 1.85% | 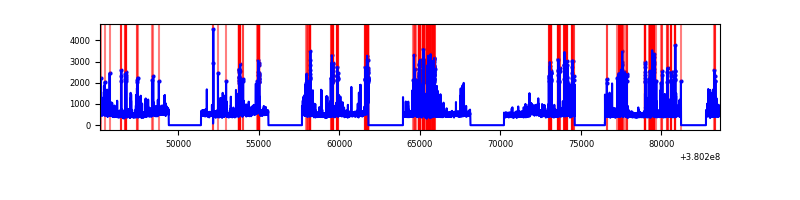 |
| C | 38490 | 26720 | 555 | 555 | 1.44% | 2.08% |  |
| D | 38490 | 26720 | 1332 | 1332 | 3.46% | 4.99% | 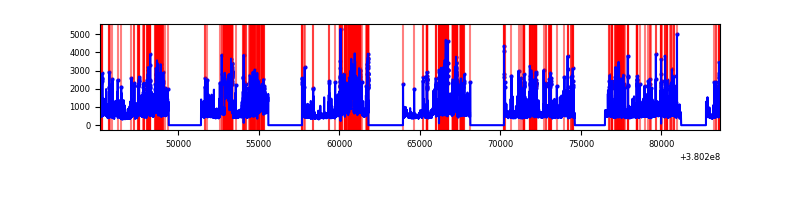 |
Top three noisy pixels from each quadrant. If the there are fewer than three noisy pixels in the level2.evt file, extra rows are filled as -1
| Pixel properties | Quadrant properties | ||||||
|---|---|---|---|---|---|---|---|
| Quadrant | DetID | PixID | Counts | Sigma | Mean | Median | Sigma |
| A | 10 | 83 | 76584 | 113.11 | 3261 | 3198 | 648.8 |
| A | 13 | 6 | 58098 | 84.62 | 3261 | 3198 | 648.8 |
| A | 13 | 254 | 48378 | 69.63 | 3261 | 3198 | 648.8 |
| B | 5 | 172 | 2596970 | 4310.96 | 3210 | 3132 | 601.7 |
| B | 0 | 219 | 269779 | 443.17 | 3210 | 3132 | 601.7 |
| B | 0 | 189 | 137634 | 223.54 | 3210 | 3132 | 601.7 |
| C | 0 | 10 | 3353124 | 4707.93 | 3119 | 3144 | 711.6 |
| C | 15 | 214 | 1149535 | 1611.09 | 3119 | 3144 | 711.6 |
| C | 3 | 233 | 389168 | 542.5 | 3119 | 3144 | 711.6 |
| D | 8 | 195 | 2834388 | 3451.59 | 3066 | 3002 | 820.3 |
| D | 10 | 118 | 2025624 | 2465.67 | 3066 | 3002 | 820.3 |
| D | 15 | 0 | 1174024 | 1427.53 | 3066 | 3002 | 820.3 |
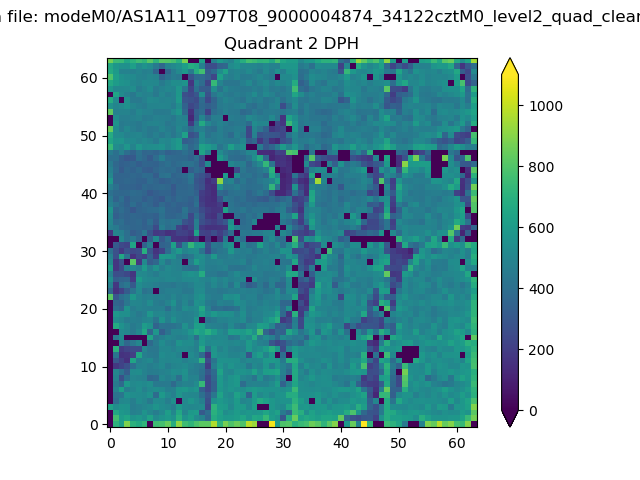
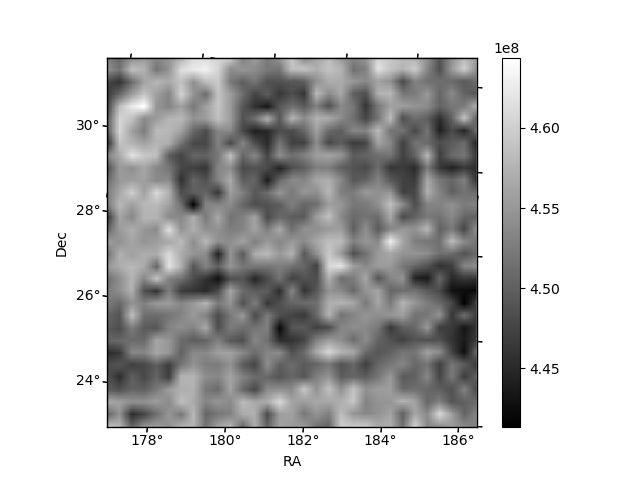
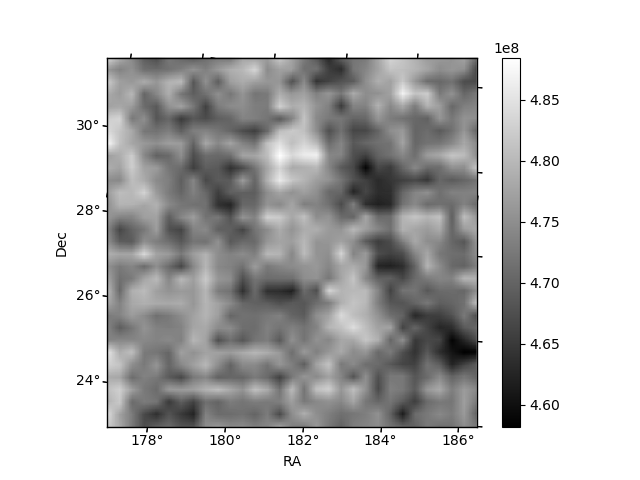
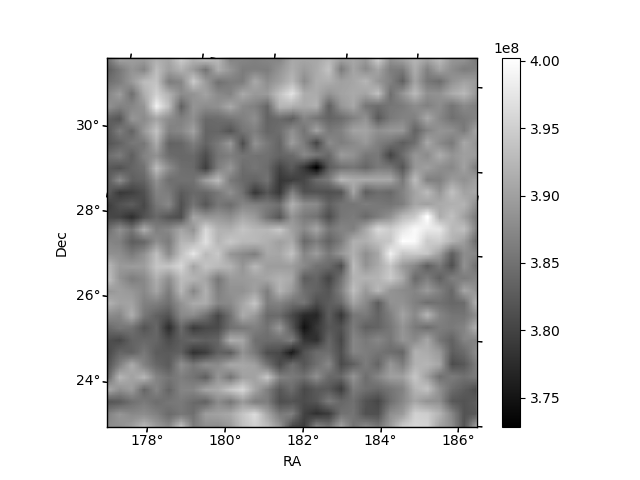
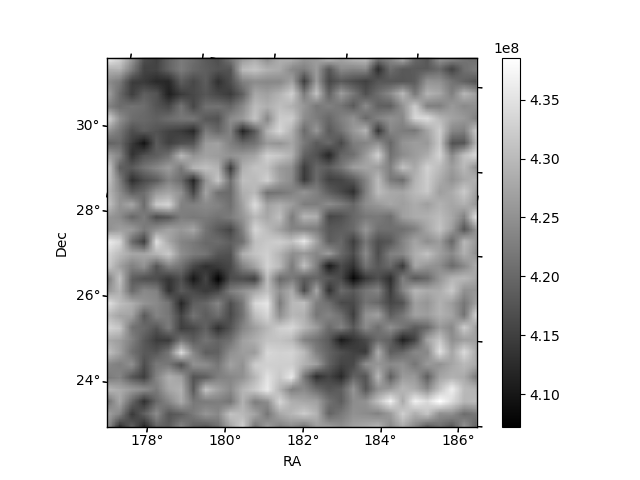
Histogram calculated using DETX and DETY for each event in the final _common_clean file
| Quadrant A | 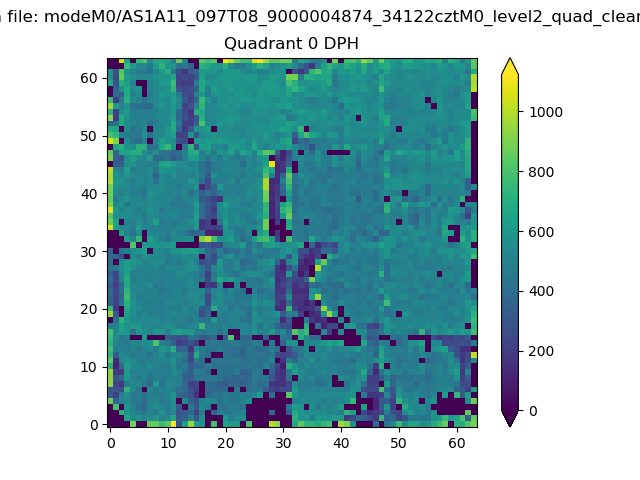 |
 |
Quadrant B |
|---|---|---|---|
| Quadrant D |  |
 |
Quadrant C |
| Plot type | Count rate plots | Images |
|---|---|---|
| Comparison with Poisson distribution Blue bars denote a histogram of data divided into 1 sec bins. Red curve is a Poisson curve with rate = median count rate of data. |
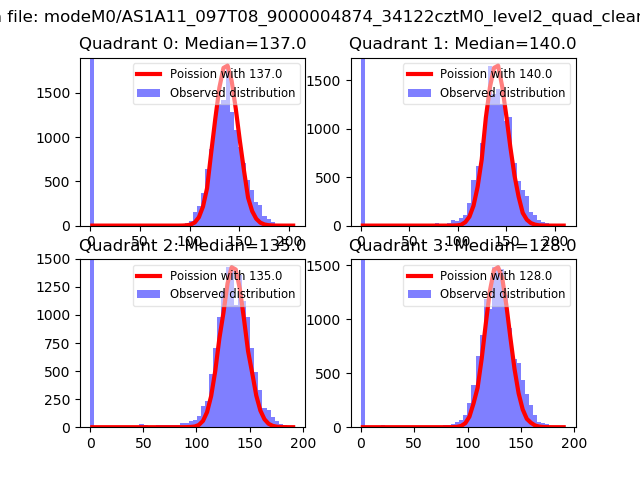 |
 |
| Quadrant-wise count rates Data is divided into 100 sec bins |
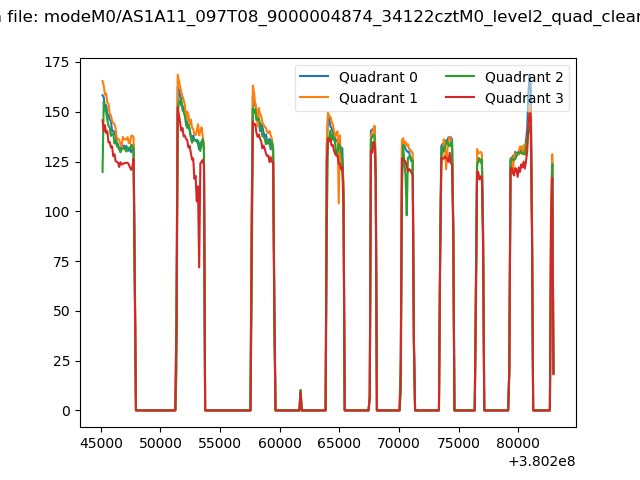 |
|
| Module-wise count rates for Quadrant A Data is divided into 100 sec bins |
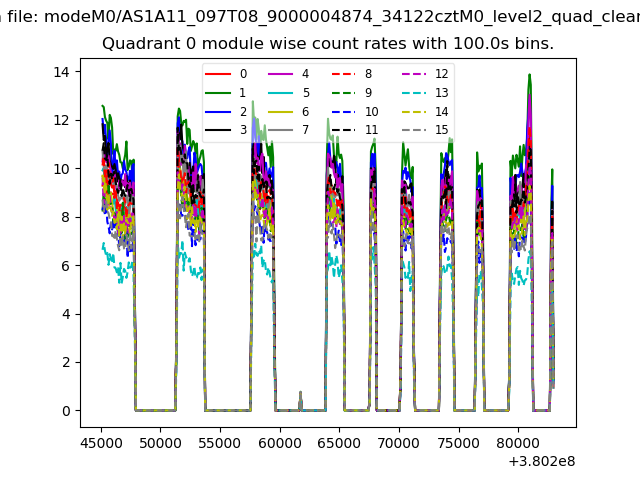 |
 |
| Module-wise count rates for Quadrant B Data is divided into 100 sec bins |
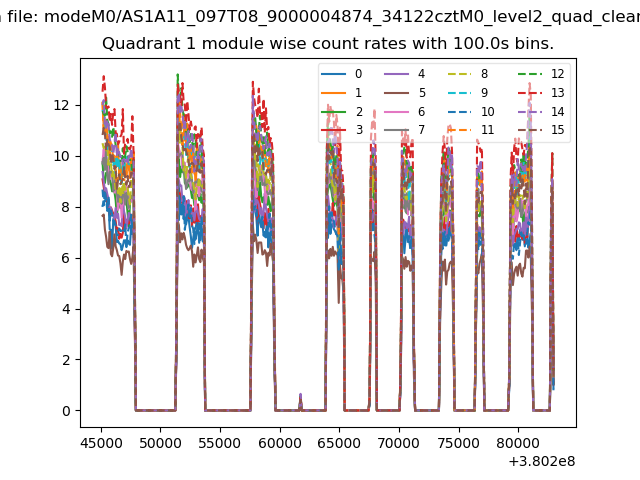 |
 |
| Module-wise count rates for Quadrant C Data is divided into 100 sec bins |
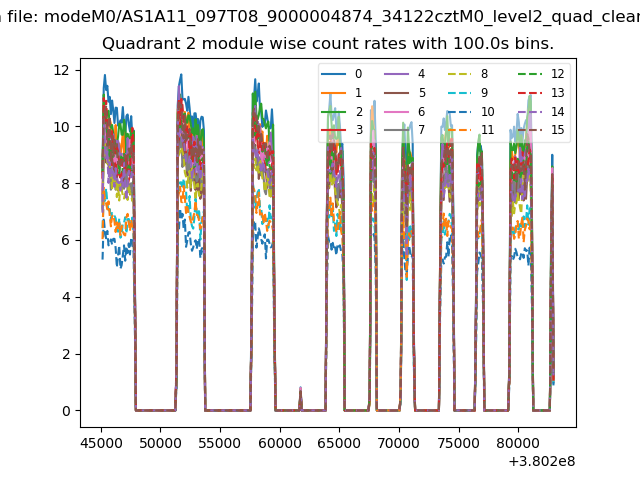 |
 |
| Module-wise count rates for Quadrant D Data is divided into 100 sec bins |
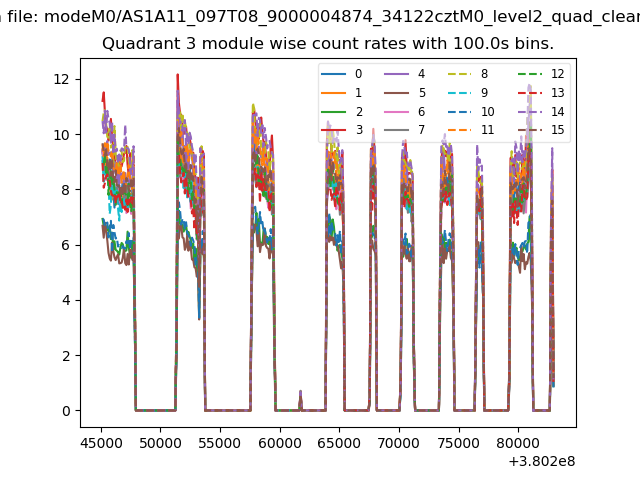 |
 |
| Parameter | Plot |
|---|---|
| CZT HV Monitor | 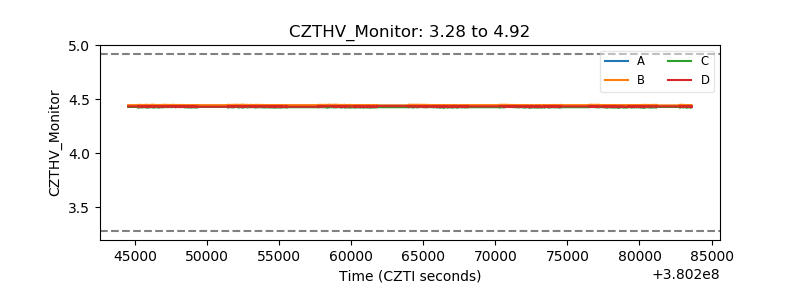 |
| D_VDD | 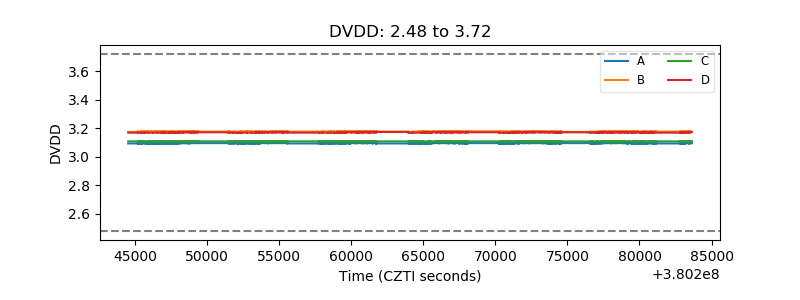 |
| Temperature 1 | 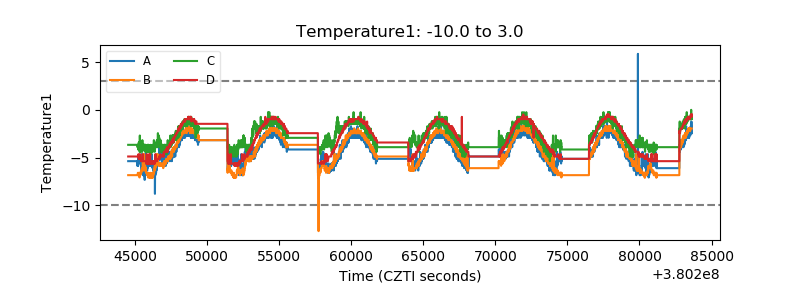 |
| Veto HV Monitor | 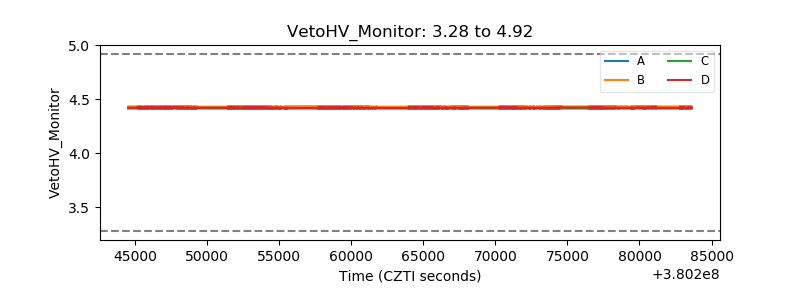 |
| Veto LLD |  |
| Alpha Counter | 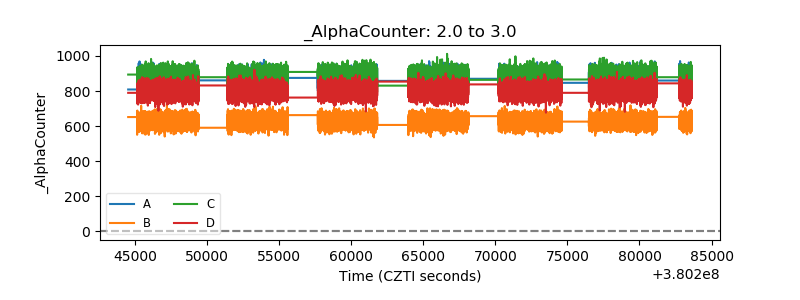 |
| _CPM_Rate | 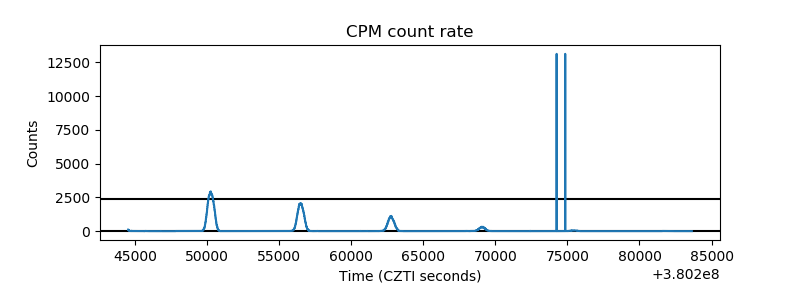 |
| CZT Counter | 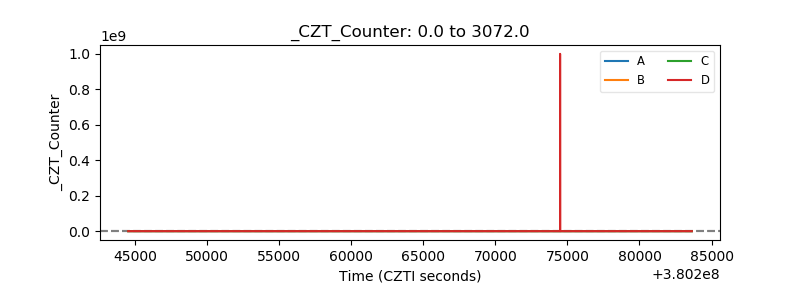 |
| +2.5 Volts monitor |  |
| +5 Volts monitor | 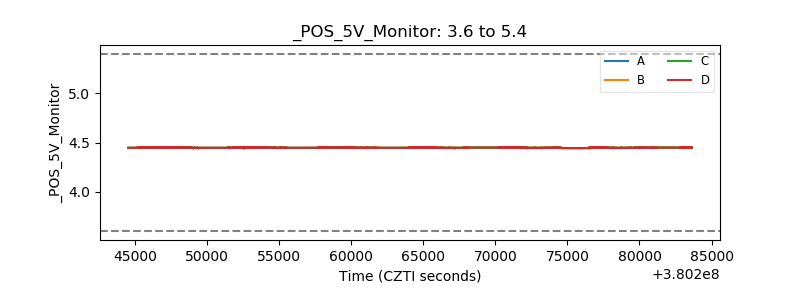 |
| _ROLL_ROT | 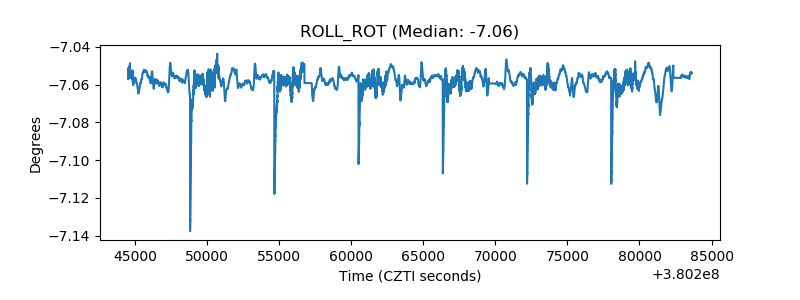 |
| _Roll_DEC | 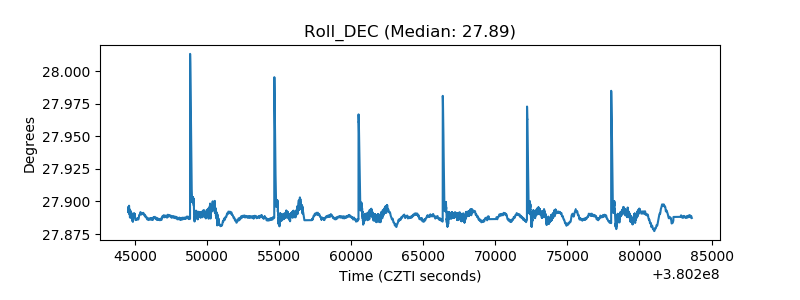 |
| _Roll_RA | 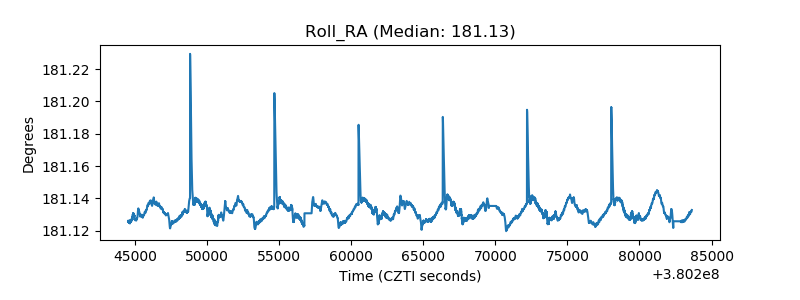 |
| Veto Counter | 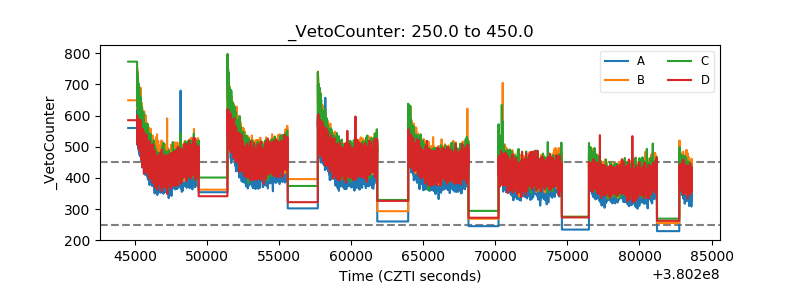 |