| Param | Original file | Final file |
|---|---|---|
| Filename | modeM0/AS1A11_097T08_9000004874_34126cztM0_level2.evt | modeM0/AS1A11_097T08_9000004874_34126cztM0_level2_quad_clean.evt |
| Size (bytes) | 848,675,520 | 144,527,040 |
| Size | 809.4 MB | 137.8 MB |
| Events in quadrant A | 4,984,923 | 923,388 |
| Events in quadrant B | 5,848,789 | 930,615 |
| Events in quadrant C | 5,836,901 | 917,038 |
| Events in quadrant D | 8,296,005 | 852,976 |
| Mode M9 | |||
|---|---|---|---|
| Quadrant | BADHDUFLAG | Total packets | Discarded packets |
| A | 0 | 42 | 0 |
| B | 0 | 42 | 0 |
| C | 0 | 42 | 0 |
| D | 0 | 42 | 0 |
| Mode M0 | |||
|---|---|---|---|
| Quadrant | BADHDUFLAG | Total packets | Discarded packets |
| A | 0 | 22001 | 4 |
| B | 0 | 24337 | 3 |
| C | 0 | 23820 | 3 |
| D | 0 | 32299 | 3 |
| Mode SS | |||
|---|---|---|---|
| Quadrant | BADHDUFLAG | Total packets | Discarded packets |
| A | 0 | 222 | 0 |
| B | 0 | 222 | 0 |
| C | 0 | 222 | 0 |
| D | 0 | 222 | 0 |
| Quadrant | Total seconds | Saturated seconds | Saturation percentage |
|---|---|---|---|
| A | 10882 | 8 | 0.073516% |
| B | 10882 | 72 | 0.661643% |
| C | 10882 | 146 | 1.341665% |
| D | 10882 | 609 | 5.596398% |
Noise dominated data is calculated using 1-second bins in cleaned event files. If a bin has >2000 counts, and if more than 50% of those come from <1% of pixels, then it is considered to be noise-dominated and hence unusable.
| Quadrant | # 1 sec bins | Bins with >0 counts | Bins with >2000 counts | High rate bins dominated by noise | Noise dominated (total time) | Noise dominated (detector-on time) | Marked lightcurve |
|---|---|---|---|---|---|---|---|
| A | 15031 | 10885 | 0 | 0 | 0.00% | 0.00% | 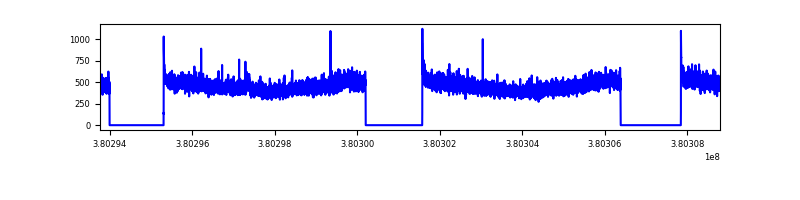 |
| B | 15031 | 10885 | 29 | 29 | 0.19% | 0.27% | 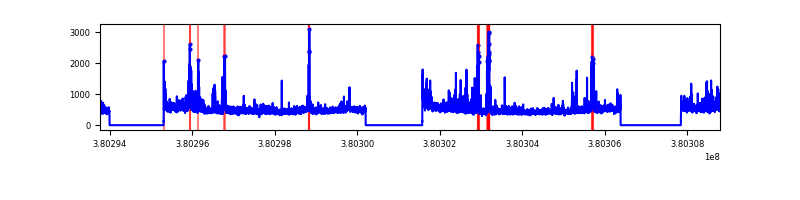 |
| C | 15031 | 10885 | 80 | 80 | 0.53% | 0.73% | 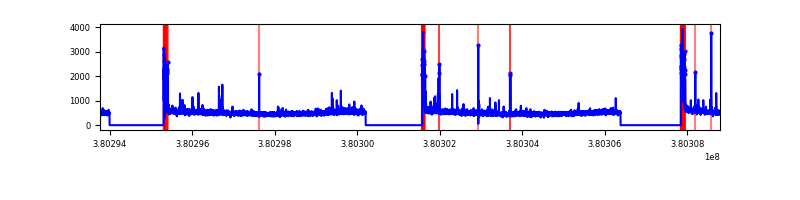 |
| D | 15031 | 10885 | 620 | 620 | 4.12% | 5.70% | 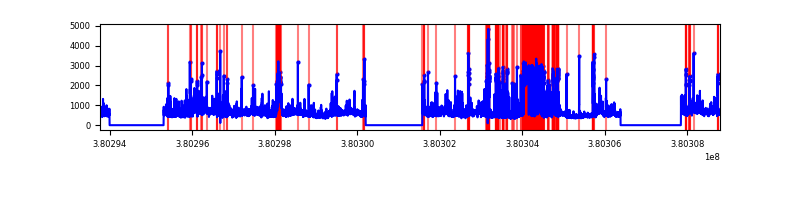 |
Top three noisy pixels from each quadrant. If the there are fewer than three noisy pixels in the level2.evt file, extra rows are filled as -1
| Pixel properties | Quadrant properties | ||||||
|---|---|---|---|---|---|---|---|
| Quadrant | DetID | PixID | Counts | Sigma | Mean | Median | Sigma |
| A | 13 | 6 | 35973 | 136.78 | 1269 | 1244 | 253.9 |
| A | 10 | 83 | 33684 | 127.76 | 1269 | 1244 | 253.9 |
| A | 13 | 254 | 19427 | 71.61 | 1269 | 1244 | 253.9 |
| B | 5 | 172 | 286948 | 1182.12 | 1263 | 1231 | 241.7 |
| B | 0 | 219 | 156258 | 641.41 | 1263 | 1231 | 241.7 |
| B | 0 | 182 | 141129 | 578.81 | 1263 | 1231 | 241.7 |
| C | 0 | 10 | 480076 | 1680.69 | 1227 | 1237 | 284.9 |
| C | 15 | 214 | 467493 | 1636.53 | 1227 | 1237 | 284.9 |
| C | 12 | 250 | 53613 | 183.84 | 1227 | 1237 | 284.9 |
| D | 7 | 223 | 1263227 | 3856.35 | 1206 | 1182 | 327.3 |
| D | 8 | 195 | 1011248 | 3086.39 | 1206 | 1182 | 327.3 |
| D | 10 | 118 | 403785 | 1230.21 | 1206 | 1182 | 327.3 |
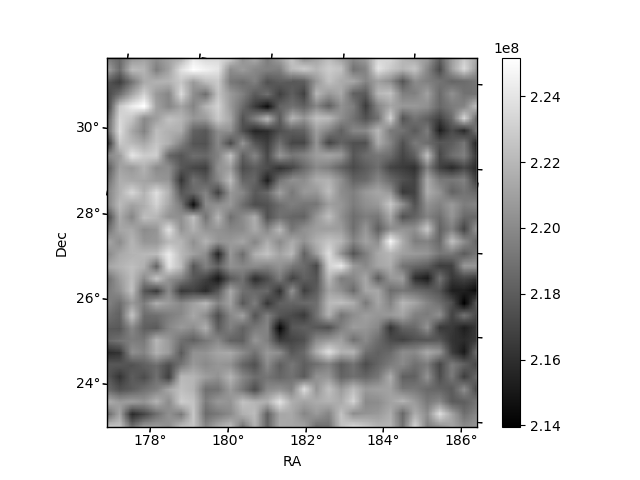
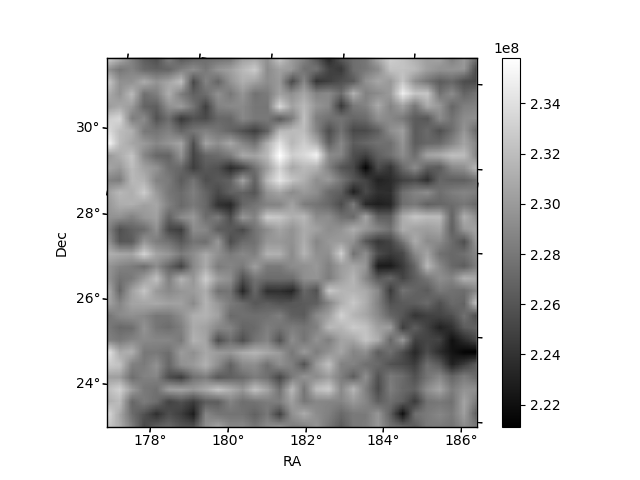
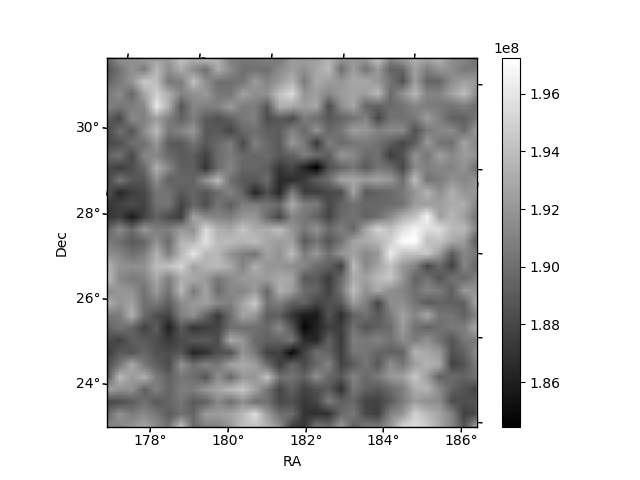
Histogram calculated using DETX and DETY for each event in the final _common_clean file
| Quadrant A | 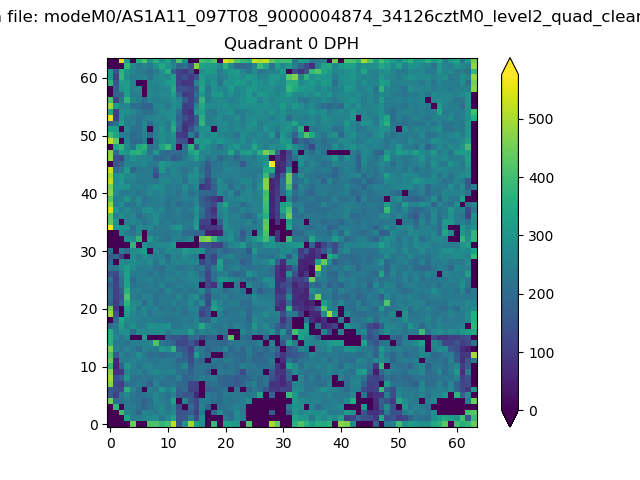 |
 |
Quadrant B |
|---|---|---|---|
| Quadrant D |  |
 |
Quadrant C |
| Plot type | Count rate plots | Images |
|---|---|---|
| Comparison with Poisson distribution Blue bars denote a histogram of data divided into 1 sec bins. Red curve is a Poisson curve with rate = median count rate of data. |
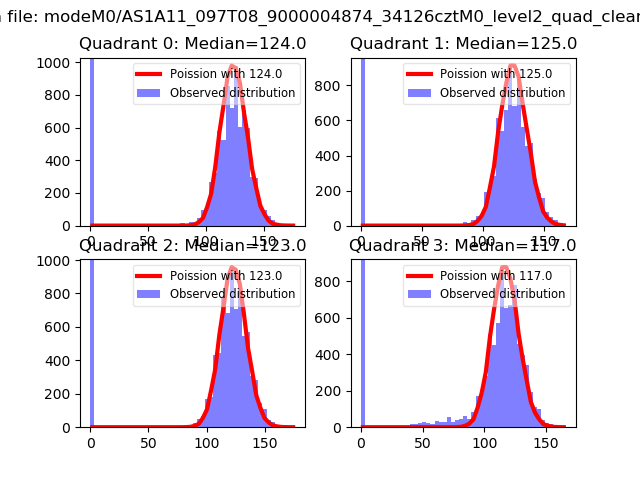 |
 |
| Quadrant-wise count rates Data is divided into 100 sec bins |
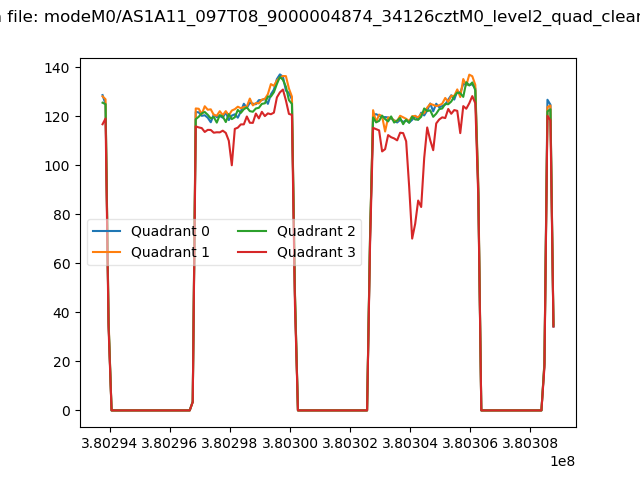 |
|
| Module-wise count rates for Quadrant A Data is divided into 100 sec bins |
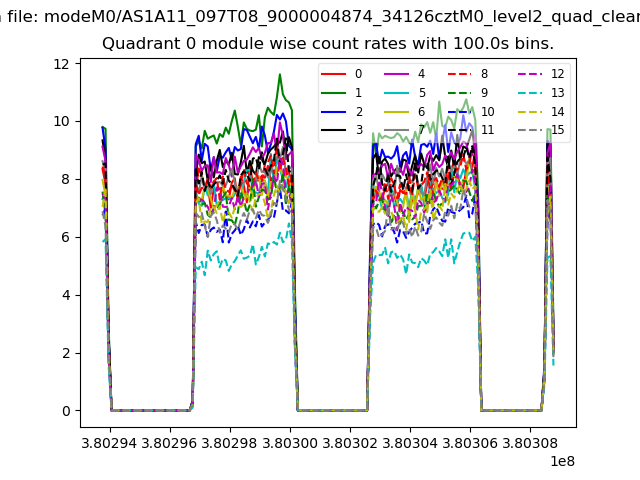 |
 |
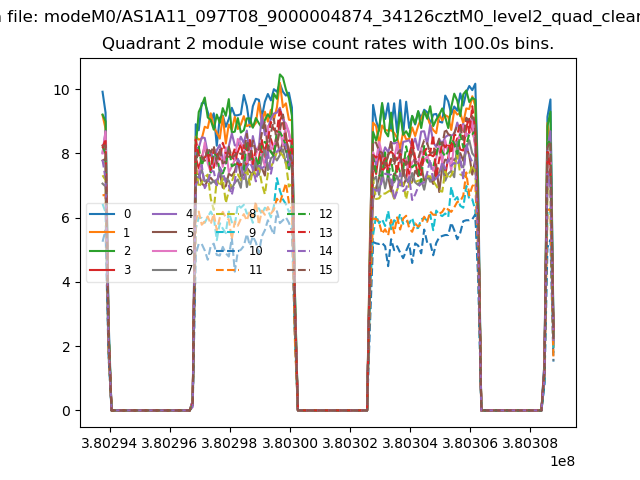
| Module-wise count rates for Quadrant B Data is divided into 100 sec bins |
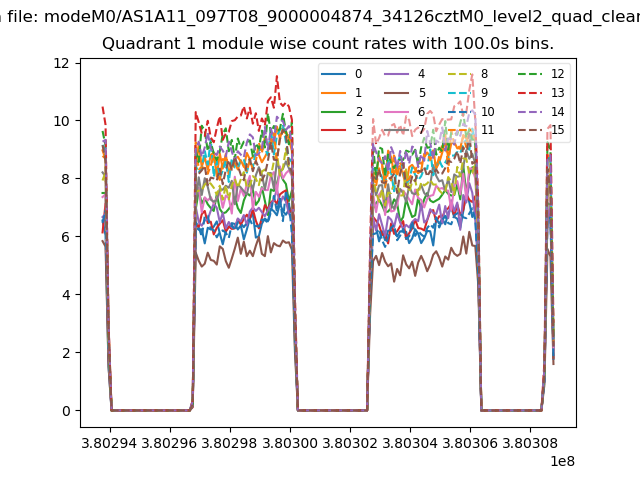 |
 |
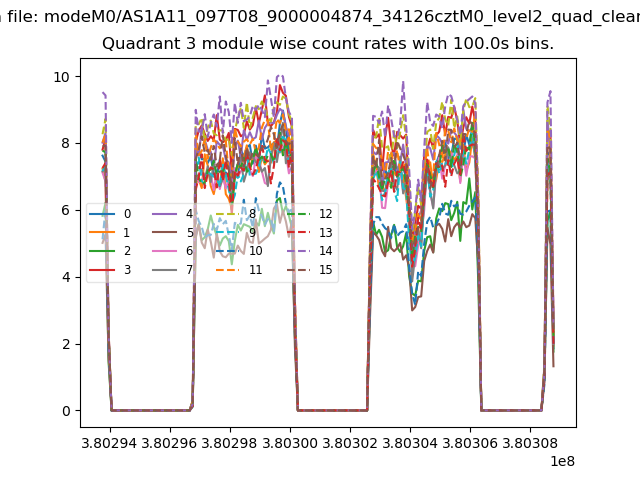
| Module-wise count rates for Quadrant C Data is divided into 100 sec bins |
 |
 |
| Module-wise count rates for Quadrant D Data is divided into 100 sec bins |
 |
 |
| Parameter | Plot |
|---|---|
| CZT HV Monitor | 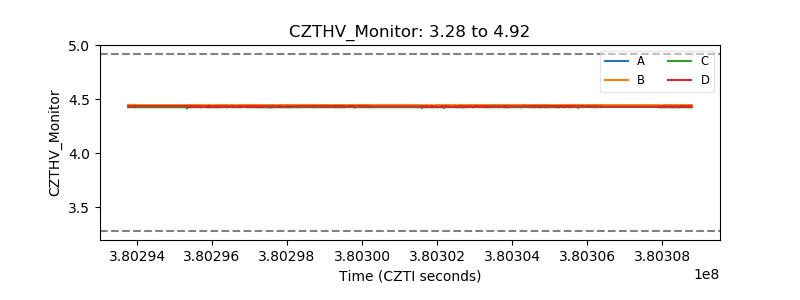 |
| D_VDD | 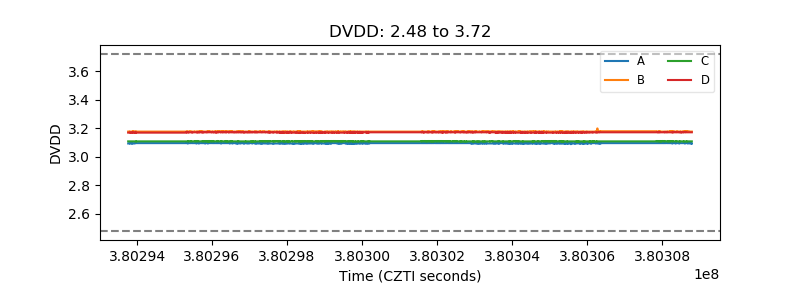 |
| Temperature 1 | 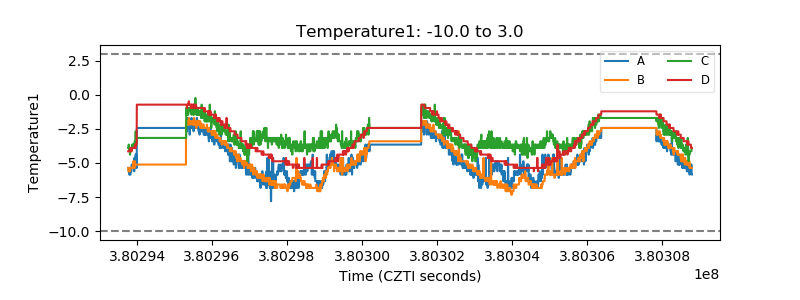 |
| Veto HV Monitor | 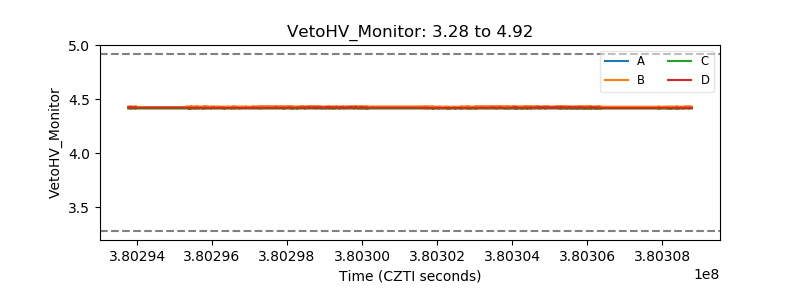 |
| Veto LLD |  |
| Alpha Counter | 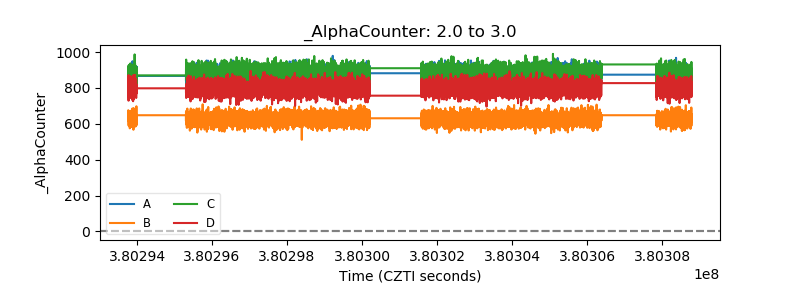 |
| _CPM_Rate | 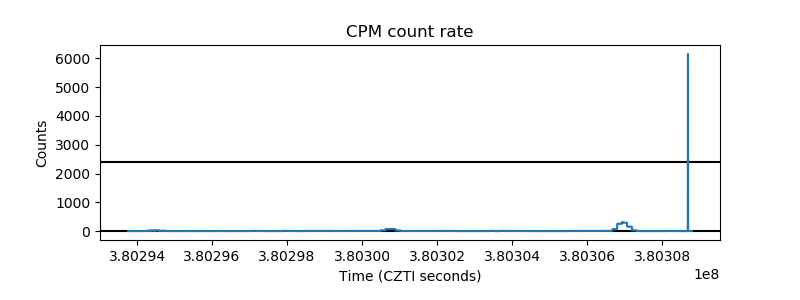 |
| CZT Counter |  |
| +2.5 Volts monitor |  |
| +5 Volts monitor | 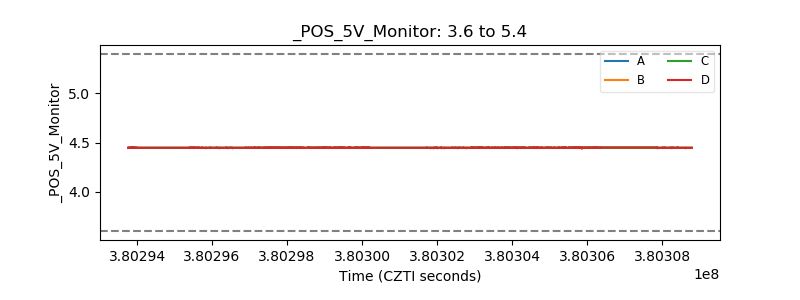 |
| _ROLL_ROT | 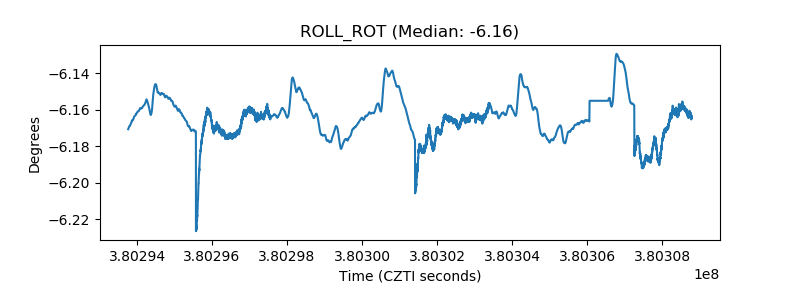 |
| _Roll_DEC | 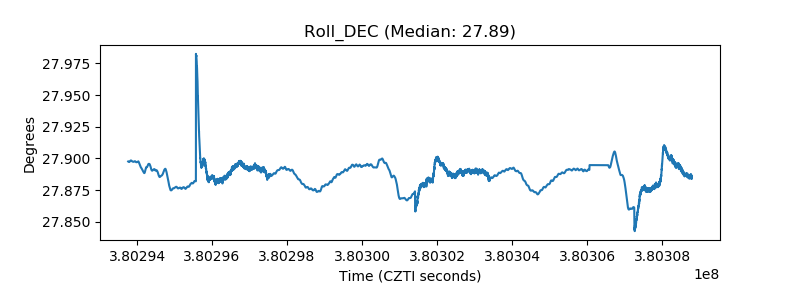 |
| _Roll_RA | 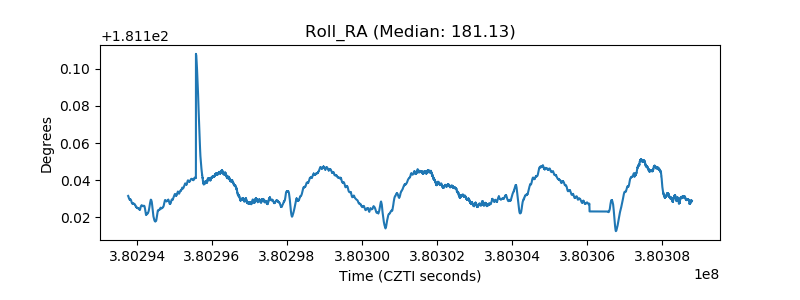 |
| Veto Counter | 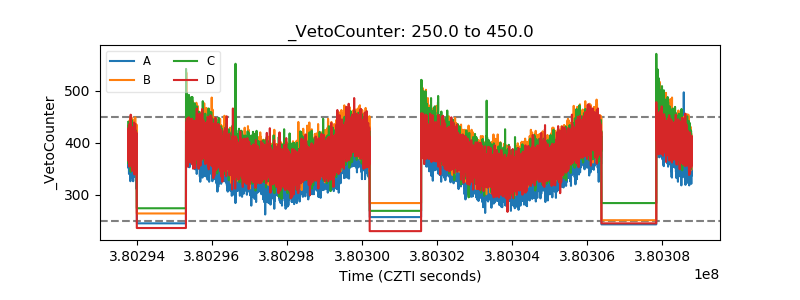 |