| Param | Original file | Final file |
|---|---|---|
| Filename | modeM0/AS1A11_097T08_9000004874_34128cztM0_level2.evt | modeM0/AS1A11_097T08_9000004874_34128cztM0_level2_quad_clean.evt |
| Size (bytes) | 492,644,160 | 88,248,960 |
| Size | 469.8 MB | 84.2 MB |
| Events in quadrant A | 2,707,080 | 577,112 |
| Events in quadrant B | 3,031,031 | 587,116 |
| Events in quadrant C | 3,873,371 | 568,786 |
| Events in quadrant D | 4,910,757 | 529,755 |
| Mode M9 | |||
|---|---|---|---|
| Quadrant | BADHDUFLAG | Total packets | Discarded packets |
| A | 0 | 32 | 0 |
| B | 0 | 32 | 0 |
| C | 0 | 32 | 0 |
| D | 0 | 32 | 0 |
| Mode M0 | |||
|---|---|---|---|
| Quadrant | BADHDUFLAG | Total packets | Discarded packets |
| A | 0 | 11899 | 3 |
| B | 0 | 12832 | 2 |
| C | 0 | 15233 | 2 |
| D | 0 | 18543 | 2 |
| Mode SS | |||
|---|---|---|---|
| Quadrant | BADHDUFLAG | Total packets | Discarded packets |
| A | 0 | 122 | 0 |
| B | 0 | 122 | 0 |
| C | 0 | 122 | 0 |
| D | 0 | 122 | 0 |
| Quadrant | Total seconds | Saturated seconds | Saturation percentage |
|---|---|---|---|
| A | 5857 | 6 | 0.102442% |
| B | 5857 | 19 | 0.324398% |
| C | 5857 | 147 | 2.509817% |
| D | 5857 | 475 | 8.109954% |
Noise dominated data is calculated using 1-second bins in cleaned event files. If a bin has >2000 counts, and if more than 50% of those come from <1% of pixels, then it is considered to be noise-dominated and hence unusable.
| Quadrant | # 1 sec bins | Bins with >0 counts | Bins with >2000 counts | High rate bins dominated by noise | Noise dominated (total time) | Noise dominated (detector-on time) | Marked lightcurve |
|---|---|---|---|---|---|---|---|
| A | 9113 | 5859 | 0 | 0 | 0.00% | 0.00% | 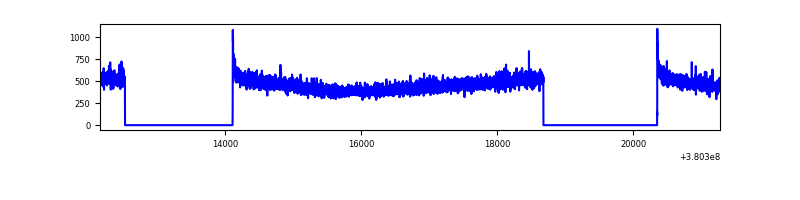 |
| B | 9113 | 5859 | 8 | 8 | 0.09% | 0.14% | 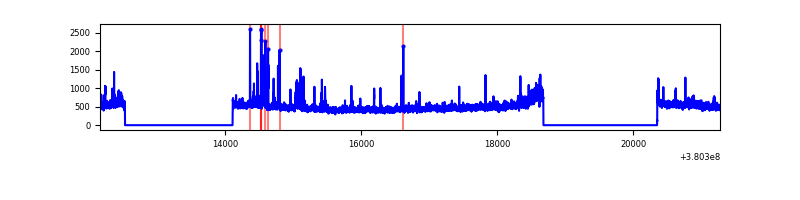 |
| C | 9113 | 5859 | 99 | 99 | 1.09% | 1.69% | 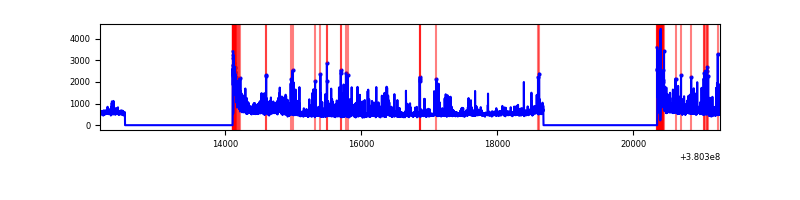 |
| D | 9113 | 5859 | 452 | 452 | 4.96% | 7.71% | 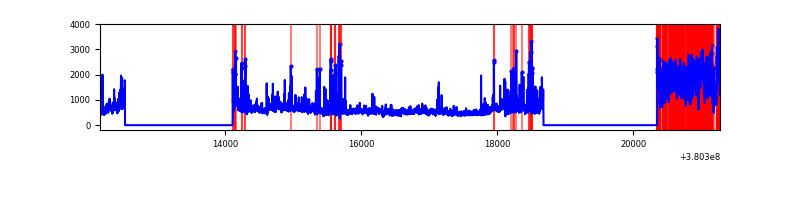 |
Top three noisy pixels from each quadrant. If the there are fewer than three noisy pixels in the level2.evt file, extra rows are filled as -1
| Pixel properties | Quadrant properties | ||||||
|---|---|---|---|---|---|---|---|
| Quadrant | DetID | PixID | Counts | Sigma | Mean | Median | Sigma |
| A | 10 | 83 | 21081 | 145.7 | 690 | 677 | 140.0 |
| A | 13 | 6 | 15770 | 107.78 | 690 | 677 | 140.0 |
| A | 13 | 254 | 10436 | 69.69 | 690 | 677 | 140.0 |
| B | 5 | 172 | 71088 | 529.96 | 690 | 673 | 132.9 |
| B | 0 | 189 | 60911 | 453.36 | 690 | 673 | 132.9 |
| B | 0 | 229 | 45113 | 334.47 | 690 | 673 | 132.9 |
| C | 0 | 10 | 995598 | 6463.69 | 665 | 673 | 153.9 |
| C | 15 | 214 | 250671 | 1624.15 | 665 | 673 | 153.9 |
| C | 12 | 250 | 7749 | 45.97 | 665 | 673 | 153.9 |
| D | 10 | 118 | 852725 | 4798.72 | 651 | 637 | 177.6 |
| D | 8 | 195 | 551102 | 3100.07 | 651 | 637 | 177.6 |
| D | 14 | 52 | 331856 | 1865.33 | 651 | 637 | 177.6 |
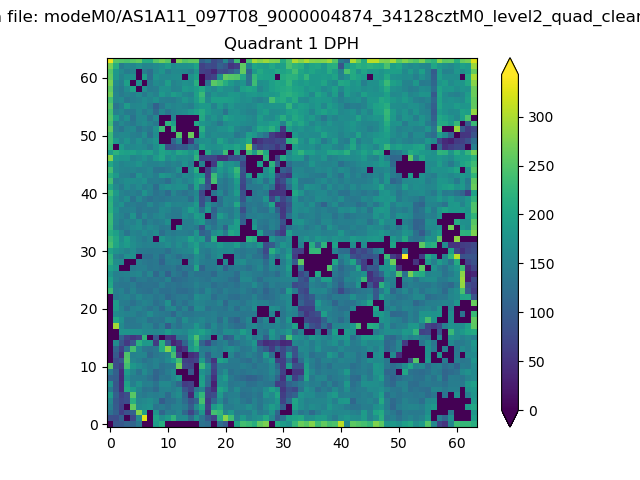
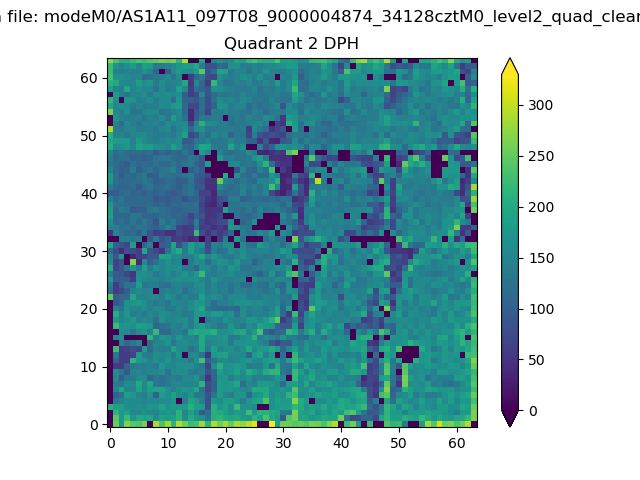
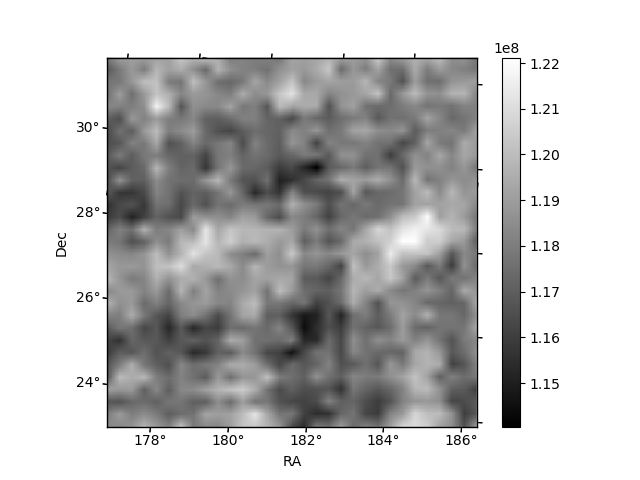
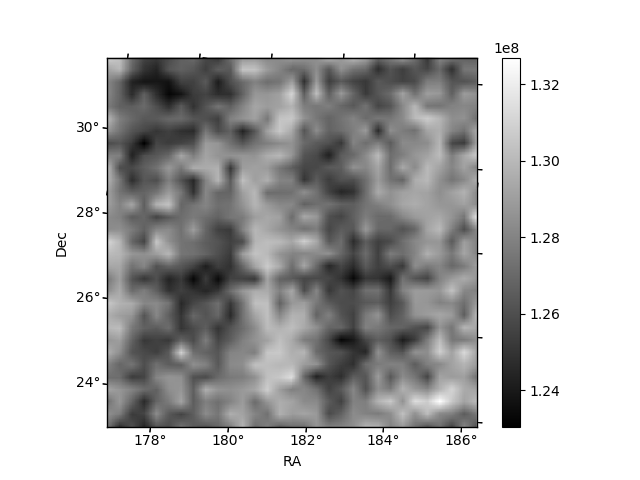
Histogram calculated using DETX and DETY for each event in the final _common_clean file
| Quadrant A |  |
 |
Quadrant B |
|---|---|---|---|
| Quadrant D |  |
 |
Quadrant C |
| Plot type | Count rate plots | Images |
|---|---|---|
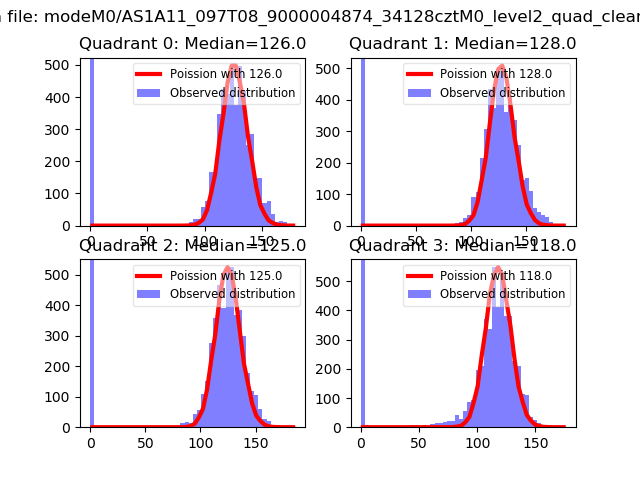
| Comparison with Poisson distribution Blue bars denote a histogram of data divided into 1 sec bins. Red curve is a Poisson curve with rate = median count rate of data. |
 |
 |
| Quadrant-wise count rates Data is divided into 100 sec bins |
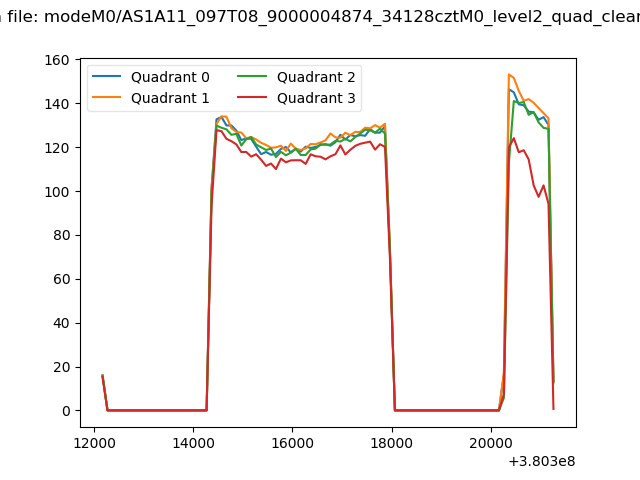 |
|
| Module-wise count rates for Quadrant A Data is divided into 100 sec bins |
 |
 |
| Module-wise count rates for Quadrant B Data is divided into 100 sec bins |
 |
 |
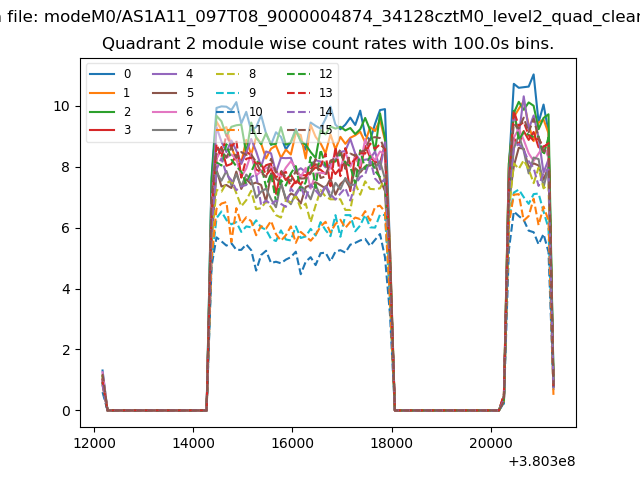
| Module-wise count rates for Quadrant C Data is divided into 100 sec bins |
 |
 |
| Module-wise count rates for Quadrant D Data is divided into 100 sec bins |
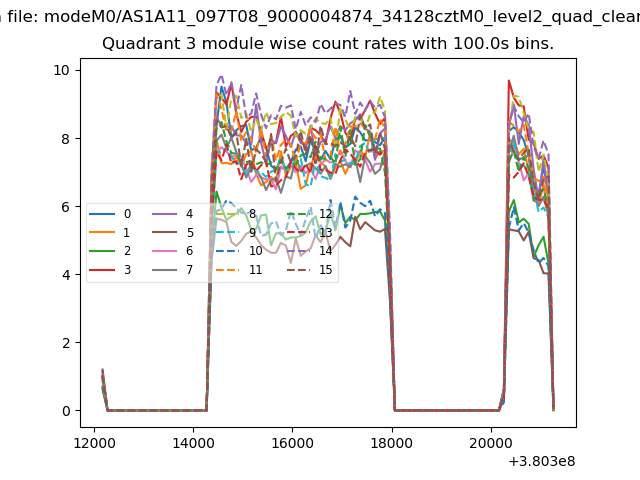 |
 |
| Parameter | Plot |
|---|---|
| CZT HV Monitor |  |
| D_VDD | 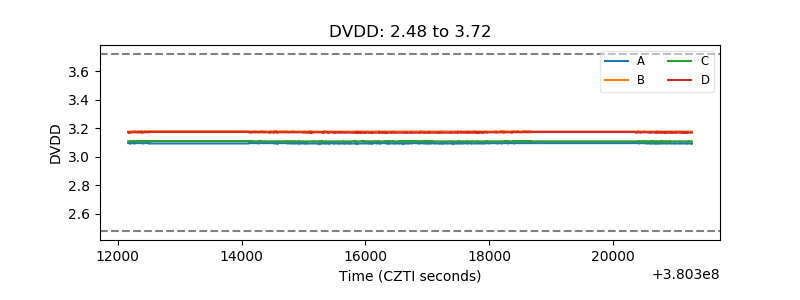 |
| Temperature 1 | 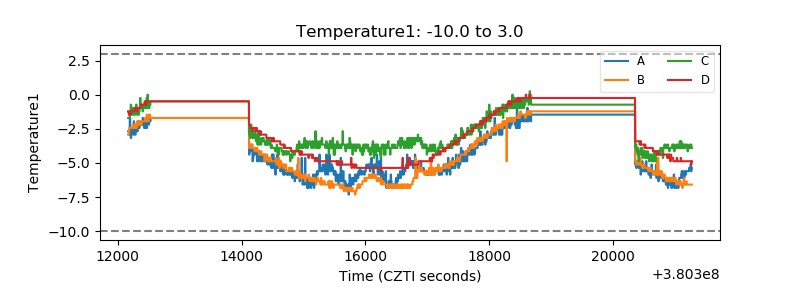 |
| Veto HV Monitor | 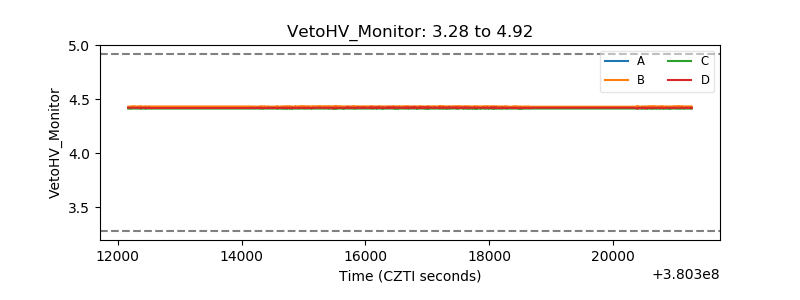 |
| Veto LLD | 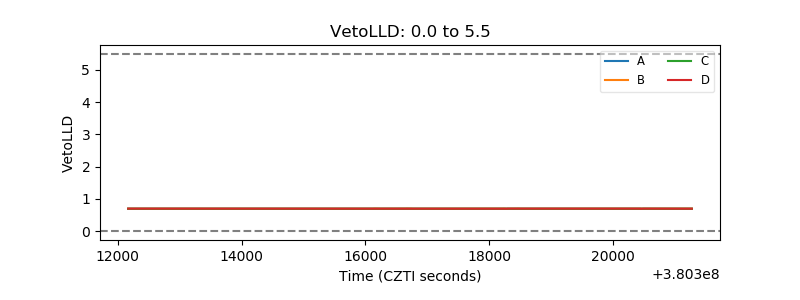 |
| Alpha Counter | 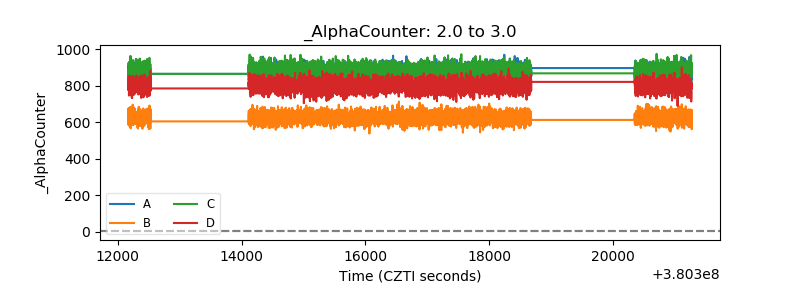 |
| _CPM_Rate | 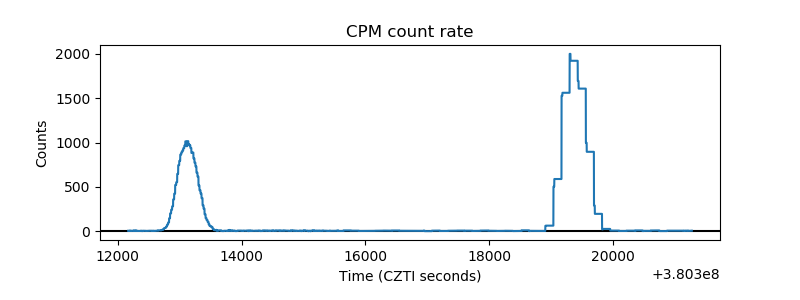 |
| CZT Counter | 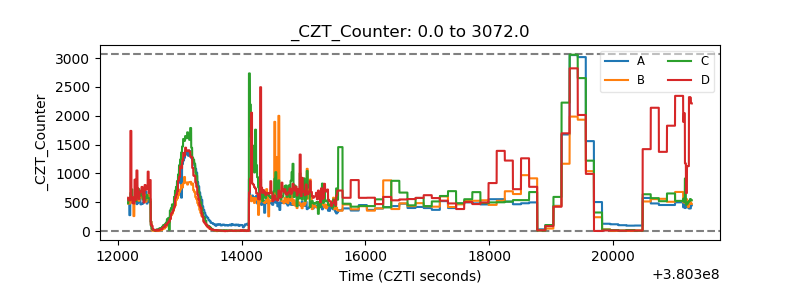 |
| +2.5 Volts monitor |  |
| +5 Volts monitor | 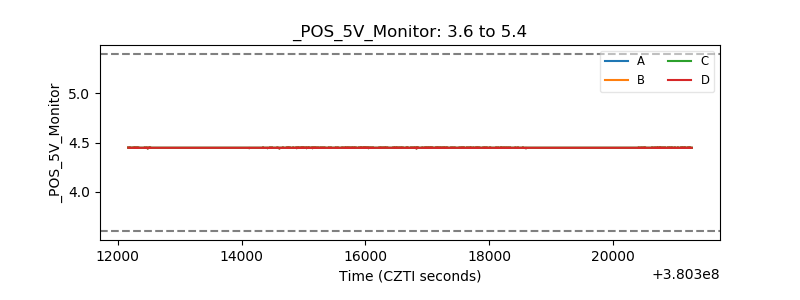 |
| _ROLL_ROT | 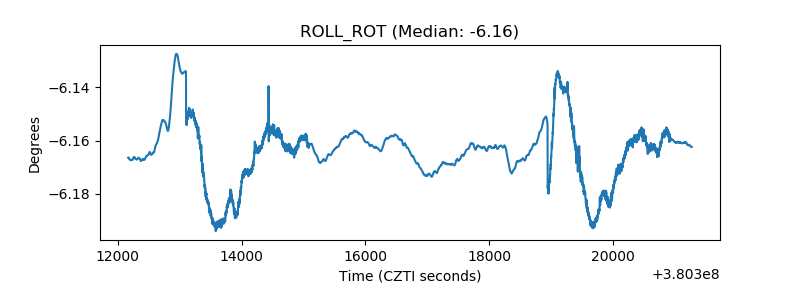 |
| _Roll_DEC | 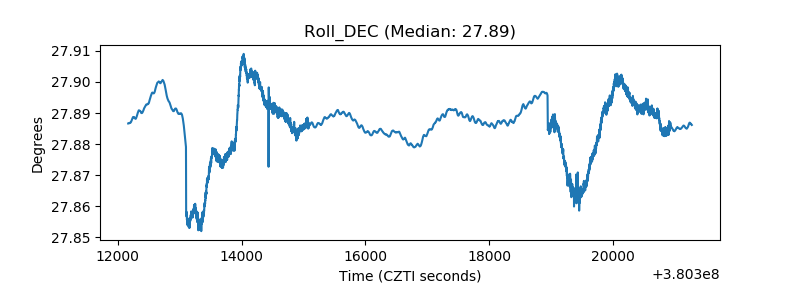 |
| _Roll_RA | 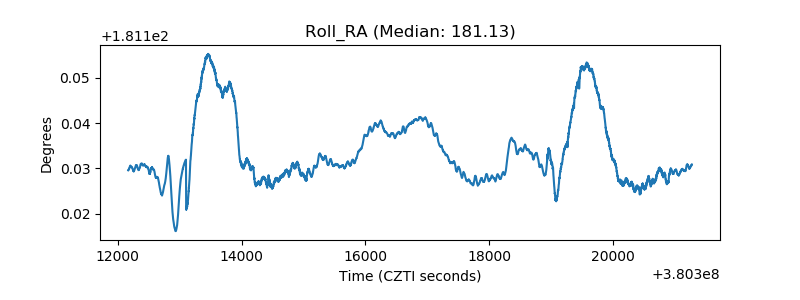 |
| Veto Counter | 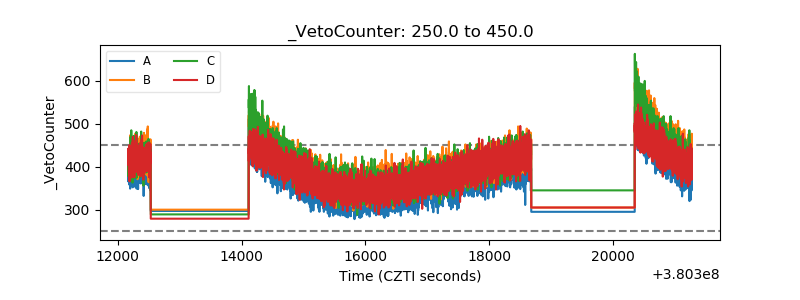 |