| Param | Original file | Final file |
|---|---|---|
| Filename | modeM0/AS1A11_097T08_9000004874_34130cztM0_level2.evt | modeM0/AS1A11_097T08_9000004874_34130cztM0_level2_quad_clean.evt |
| Size (bytes) | 478,486,080 | 87,937,920 |
| Size | 456.3 MB | 83.9 MB |
| Events in quadrant A | 2,520,429 | 584,245 |
| Events in quadrant B | 2,927,695 | 597,983 |
| Events in quadrant C | 3,571,500 | 571,989 |
| Events in quadrant D | 5,102,482 | 528,142 |
| Mode M9 | |||
|---|---|---|---|
| Quadrant | BADHDUFLAG | Total packets | Discarded packets |
| A | 0 | 36 | 0 |
| B | 0 | 36 | 0 |
| C | 0 | 36 | 0 |
| D | 0 | 36 | 0 |
| Mode M0 | |||
|---|---|---|---|
| Quadrant | BADHDUFLAG | Total packets | Discarded packets |
| A | 0 | 11055 | 2 |
| B | 0 | 12221 | 1 |
| C | 0 | 14027 | 1 |
| D | 0 | 19163 | 1 |
| Mode SS | |||
|---|---|---|---|
| Quadrant | BADHDUFLAG | Total packets | Discarded packets |
| A | 0 | 112 | 0 |
| B | 0 | 112 | 0 |
| C | 0 | 112 | 0 |
| D | 0 | 112 | 0 |
| Quadrant | Total seconds | Saturated seconds | Saturation percentage |
|---|---|---|---|
| A | 5439 | 6 | 0.110314% |
| B | 5439 | 51 | 0.937672% |
| C | 5439 | 150 | 2.757860% |
| D | 5439 | 518 | 9.523810% |
Noise dominated data is calculated using 1-second bins in cleaned event files. If a bin has >2000 counts, and if more than 50% of those come from <1% of pixels, then it is considered to be noise-dominated and hence unusable.
| Quadrant | # 1 sec bins | Bins with >0 counts | Bins with >2000 counts | High rate bins dominated by noise | Noise dominated (total time) | Noise dominated (detector-on time) | Marked lightcurve |
|---|---|---|---|---|---|---|---|
| A | 8936 | 5441 | 2 | 2 | 0.02% | 0.04% | 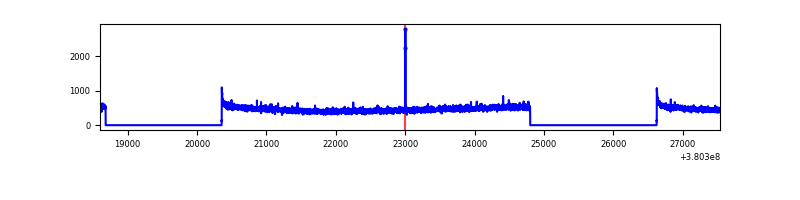 |
| B | 8936 | 5441 | 26 | 26 | 0.29% | 0.48% | 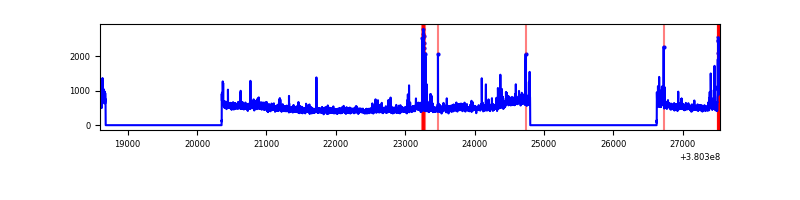 |
| C | 8936 | 5441 | 108 | 108 | 1.21% | 1.98% | 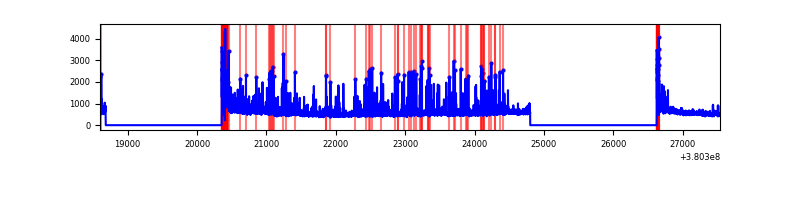 |
| D | 8936 | 5441 | 495 | 495 | 5.54% | 9.10% | 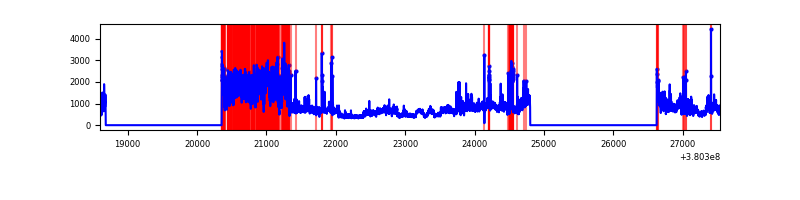 |
Top three noisy pixels from each quadrant. If the there are fewer than three noisy pixels in the level2.evt file, extra rows are filled as -1
| Pixel properties | Quadrant properties | ||||||
|---|---|---|---|---|---|---|---|
| Quadrant | DetID | PixID | Counts | Sigma | Mean | Median | Sigma |
| A | 10 | 83 | 20123 | 150.39 | 643 | 632 | 129.6 |
| A | 13 | 6 | 9689 | 69.88 | 643 | 632 | 129.6 |
| A | 13 | 254 | 9586 | 69.09 | 643 | 632 | 129.6 |
| B | 0 | 189 | 56943 | 460.82 | 646 | 631 | 122.2 |
| B | 4 | 251 | 56184 | 454.61 | 646 | 631 | 122.2 |
| B | 0 | 219 | 52668 | 425.84 | 646 | 631 | 122.2 |
| C | 0 | 10 | 856727 | 5916.37 | 622 | 628 | 144.7 |
| C | 15 | 214 | 232720 | 1603.95 | 622 | 628 | 144.7 |
| C | 15 | 159 | 23761 | 159.87 | 622 | 628 | 144.7 |
| D | 8 | 195 | 880402 | 5564.07 | 600 | 586 | 158.1 |
| D | 10 | 118 | 852059 | 5384.83 | 600 | 586 | 158.1 |
| D | 14 | 52 | 407531 | 2573.57 | 600 | 586 | 158.1 |
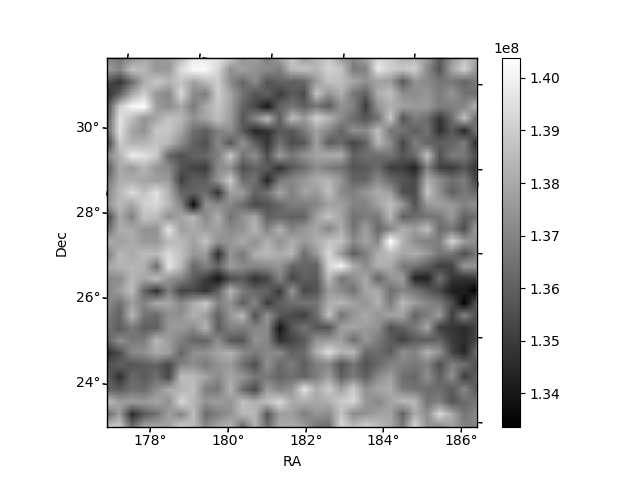
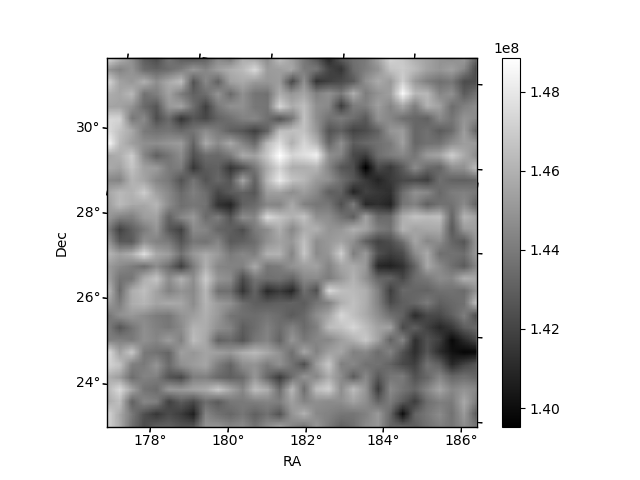
Histogram calculated using DETX and DETY for each event in the final _common_clean file
| Quadrant A | 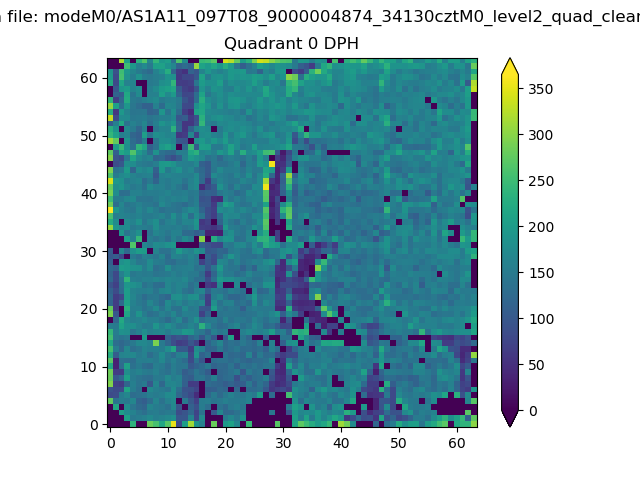 |
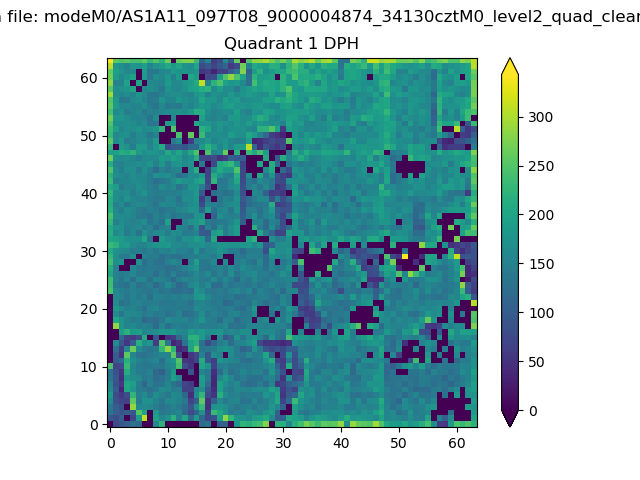 |
Quadrant B |
|---|---|---|---|
| Quadrant D |  |
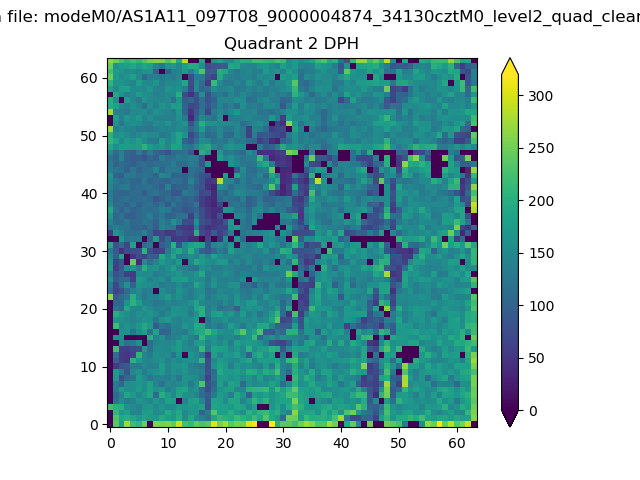 |
Quadrant C |
| Plot type | Count rate plots | Images |
|---|---|---|
| Comparison with Poisson distribution Blue bars denote a histogram of data divided into 1 sec bins. Red curve is a Poisson curve with rate = median count rate of data. |
 |
 |
| Quadrant-wise count rates Data is divided into 100 sec bins |
 |
|
| Module-wise count rates for Quadrant A Data is divided into 100 sec bins |
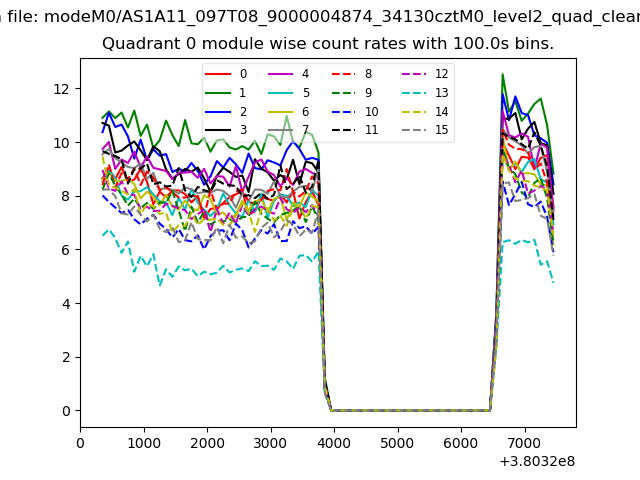 |
 |
| Module-wise count rates for Quadrant B Data is divided into 100 sec bins |
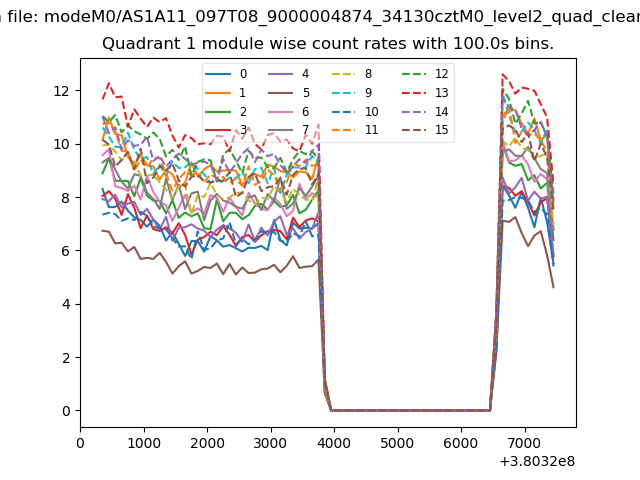 |
 |
| Module-wise count rates for Quadrant C Data is divided into 100 sec bins |
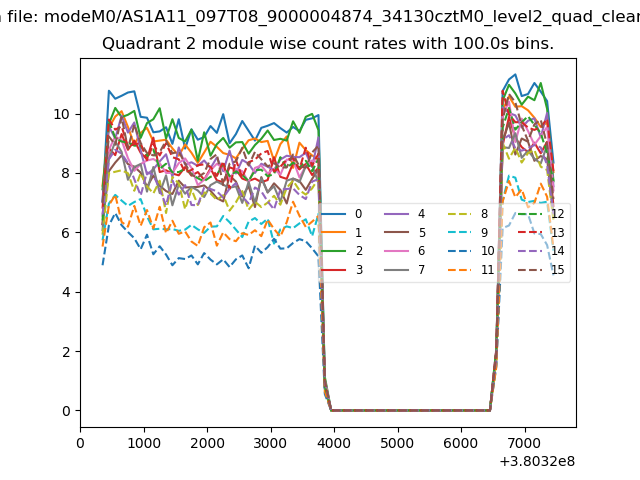 |
 |
| Module-wise count rates for Quadrant D Data is divided into 100 sec bins |
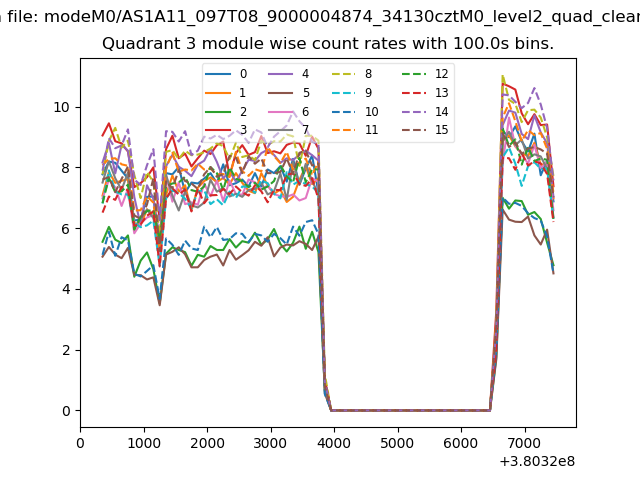 |
 |
| Parameter | Plot |
|---|---|
| CZT HV Monitor | 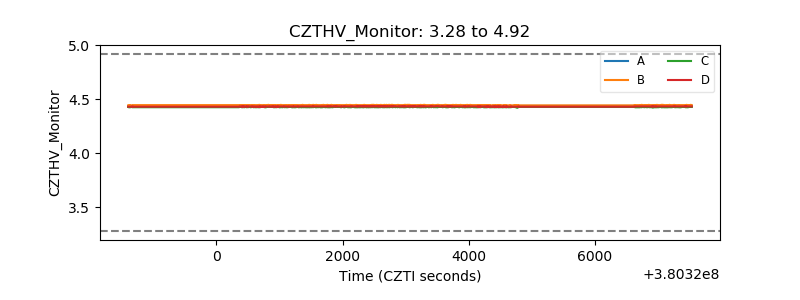 |
| D_VDD | 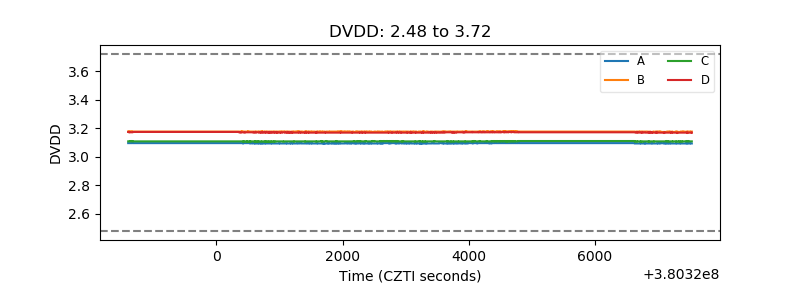 |
| Temperature 1 | 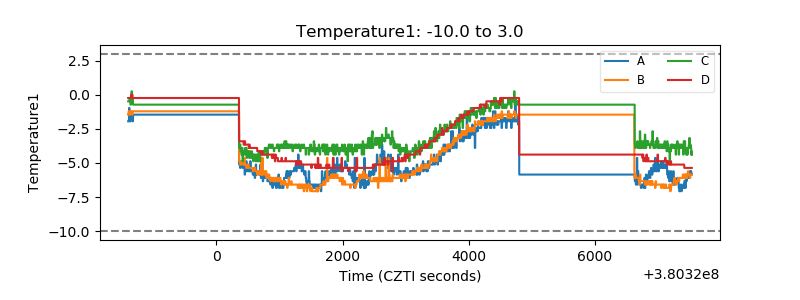 |
| Veto HV Monitor | 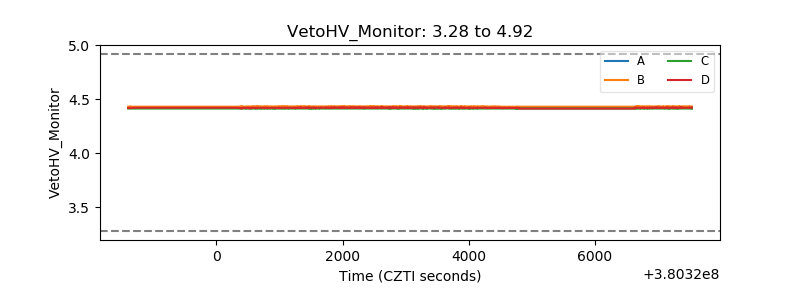 |
| Veto LLD | 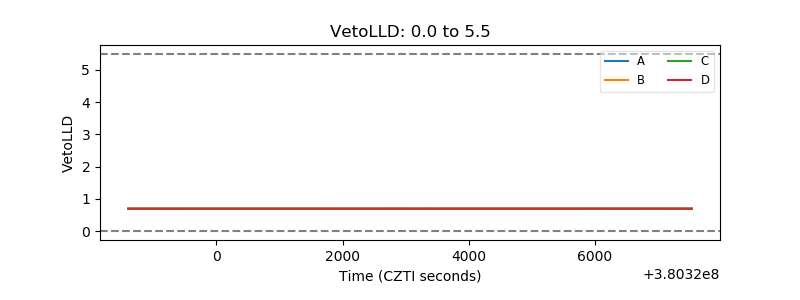 |
| Alpha Counter | 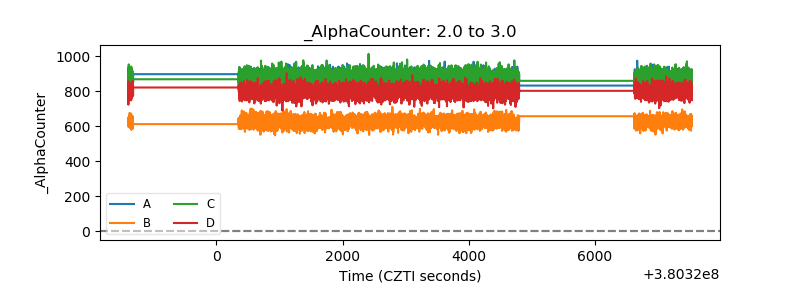 |
| _CPM_Rate |  |
| CZT Counter | 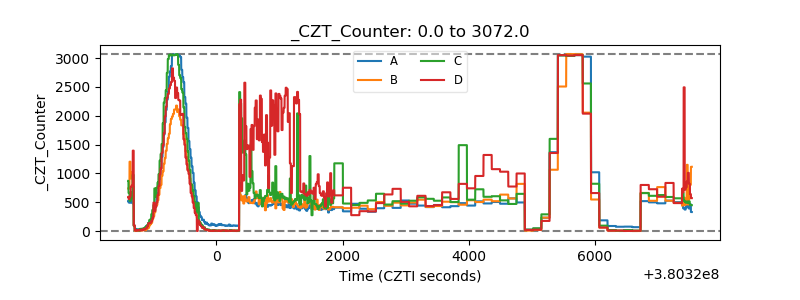 |
| +2.5 Volts monitor |  |
| +5 Volts monitor |  |
| _ROLL_ROT | 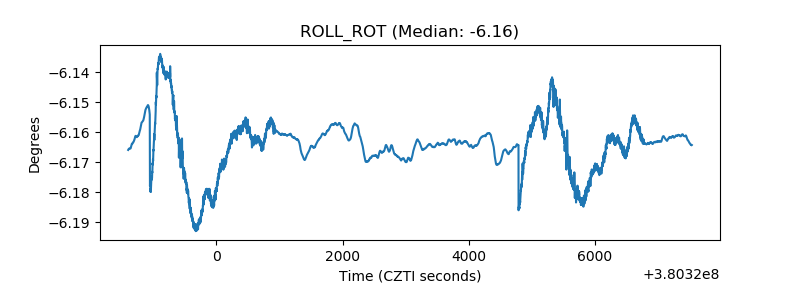 |
| _Roll_DEC | 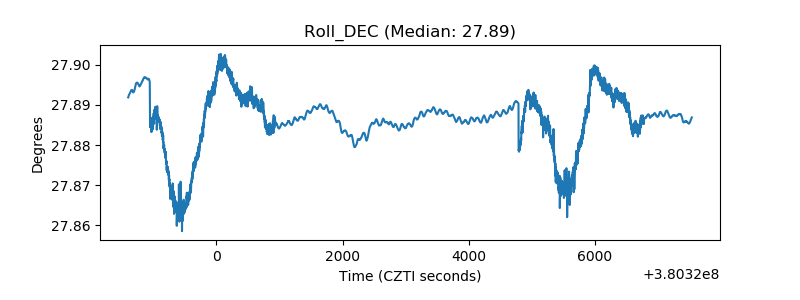 |
| _Roll_RA | 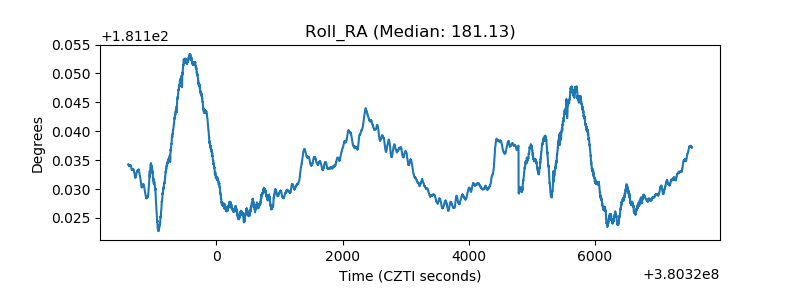 |
| Veto Counter | 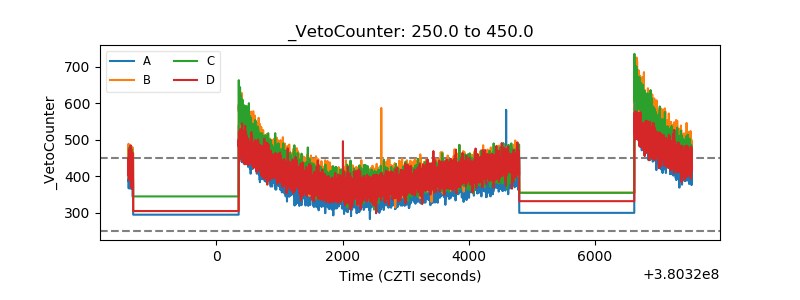 |