| Param | Original file | Final file |
|---|---|---|
| Filename | modeM0/AS1A11_097T08_9000004874_34131cztM0_level2.evt | modeM0/AS1A11_097T08_9000004874_34131cztM0_level2_quad_clean.evt |
| Size (bytes) | 432,745,920 | 83,410,560 |
| Size | 412.7 MB | 79.5 MB |
| Events in quadrant A | 2,458,126 | 549,335 |
| Events in quadrant B | 3,007,842 | 567,027 |
| Events in quadrant C | 3,099,869 | 540,976 |
| Events in quadrant D | 4,186,947 | 504,426 |
| Mode M9 | |||
|---|---|---|---|
| Quadrant | BADHDUFLAG | Total packets | Discarded packets |
| A | 0 | 33 | 0 |
| B | 0 | 33 | 0 |
| C | 0 | 33 | 0 |
| D | 0 | 34 | 0 |
| Mode M0 | |||
|---|---|---|---|
| Quadrant | BADHDUFLAG | Total packets | Discarded packets |
| A | 0 | 10572 | 2 |
| B | 0 | 12178 | 1 |
| C | 0 | 12353 | 1 |
| D | 0 | 16118 | 1 |
| Mode SS | |||
|---|---|---|---|
| Quadrant | BADHDUFLAG | Total packets | Discarded packets |
| A | 0 | 106 | 0 |
| B | 0 | 106 | 0 |
| C | 0 | 106 | 0 |
| D | 0 | 106 | 0 |
| Quadrant | Total seconds | Saturated seconds | Saturation percentage |
|---|---|---|---|
| A | 5199 | 8 | 0.153876% |
| B | 5199 | 94 | 1.808040% |
| C | 5199 | 86 | 1.654164% |
| D | 5199 | 161 | 3.096749% |
Noise dominated data is calculated using 1-second bins in cleaned event files. If a bin has >2000 counts, and if more than 50% of those come from <1% of pixels, then it is considered to be noise-dominated and hence unusable.
| Quadrant | # 1 sec bins | Bins with >0 counts | Bins with >2000 counts | High rate bins dominated by noise | Noise dominated (total time) | Noise dominated (detector-on time) | Marked lightcurve |
|---|---|---|---|---|---|---|---|
| A | 7142 | 5200 | 0 | 0 | 0.00% | 0.00% | 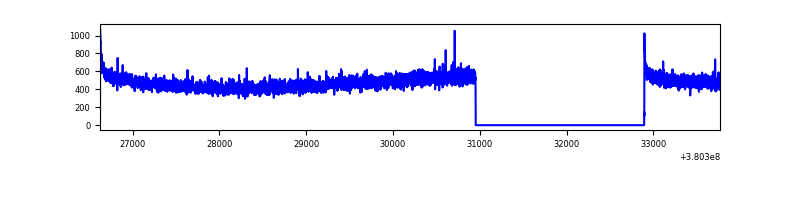 |
| B | 7142 | 5200 | 70 | 70 | 0.98% | 1.35% | 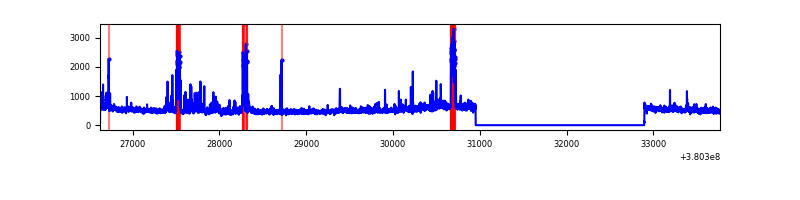 |
| C | 7142 | 5200 | 57 | 57 | 0.80% | 1.10% | 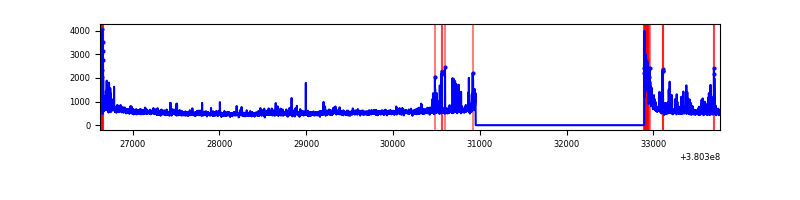 |
| D | 7142 | 5200 | 156 | 156 | 2.18% | 3.00% | 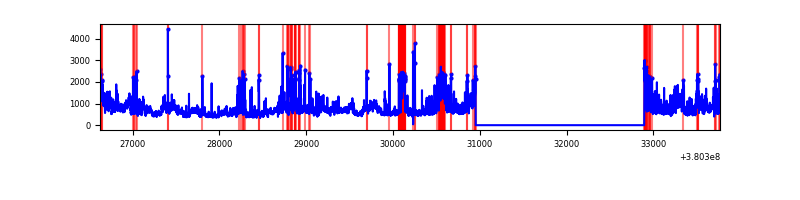 |
Top three noisy pixels from each quadrant. If the there are fewer than three noisy pixels in the level2.evt file, extra rows are filled as -1
| Pixel properties | Quadrant properties | ||||||
|---|---|---|---|---|---|---|---|
| Quadrant | DetID | PixID | Counts | Sigma | Mean | Median | Sigma |
| A | 10 | 83 | 19823 | 152.54 | 628 | 617 | 125.9 |
| A | 13 | 6 | 11209 | 84.13 | 628 | 617 | 125.9 |
| A | 13 | 254 | 8768 | 64.74 | 628 | 617 | 125.9 |
| B | 5 | 172 | 152264 | 1273.23 | 630 | 616 | 119.1 |
| B | 5 | 31 | 129228 | 1079.82 | 630 | 616 | 119.1 |
| B | 0 | 219 | 83260 | 693.87 | 630 | 616 | 119.1 |
| C | 0 | 10 | 444642 | 3156.04 | 608 | 613 | 140.7 |
| C | 15 | 214 | 225460 | 1598.15 | 608 | 613 | 140.7 |
| C | 4 | 112 | 31914 | 222.48 | 608 | 613 | 140.7 |
| D | 8 | 195 | 578966 | 3934.12 | 600 | 582 | 147.0 |
| D | 12 | 227 | 437237 | 2970.09 | 600 | 582 | 147.0 |
| D | 14 | 52 | 298440 | 2026.0 | 600 | 582 | 147.0 |
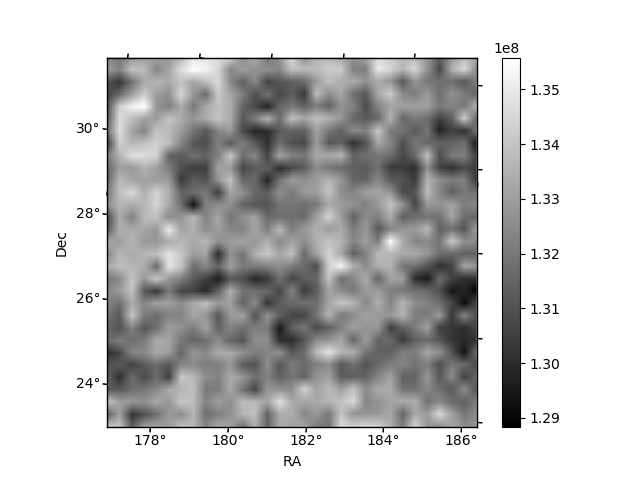
Histogram calculated using DETX and DETY for each event in the final _common_clean file
| Quadrant A | 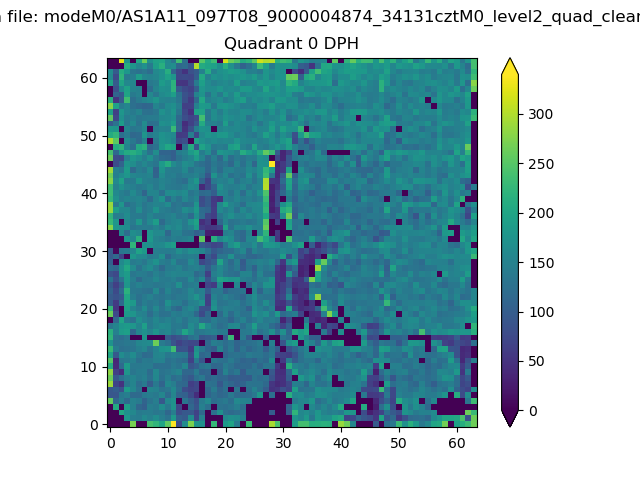 |
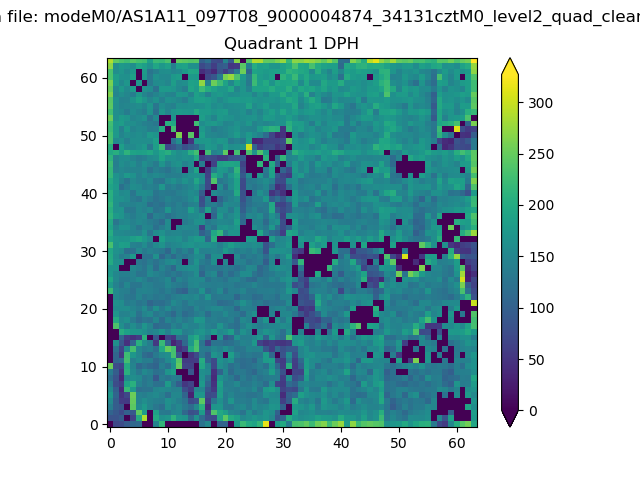 |
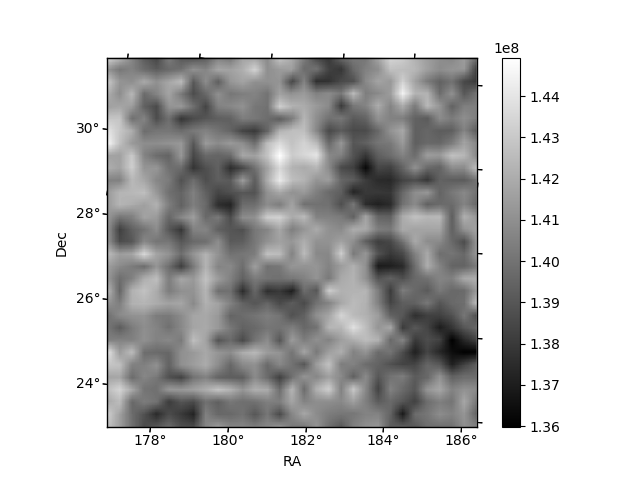
Quadrant B |
|---|---|---|---|
| Quadrant D | 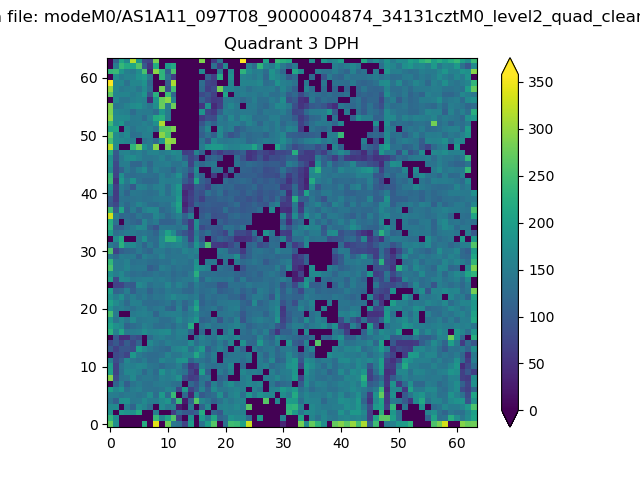 |
 |
Quadrant C |
| Plot type | Count rate plots | Images |
|---|---|---|
| Comparison with Poisson distribution Blue bars denote a histogram of data divided into 1 sec bins. Red curve is a Poisson curve with rate = median count rate of data. |
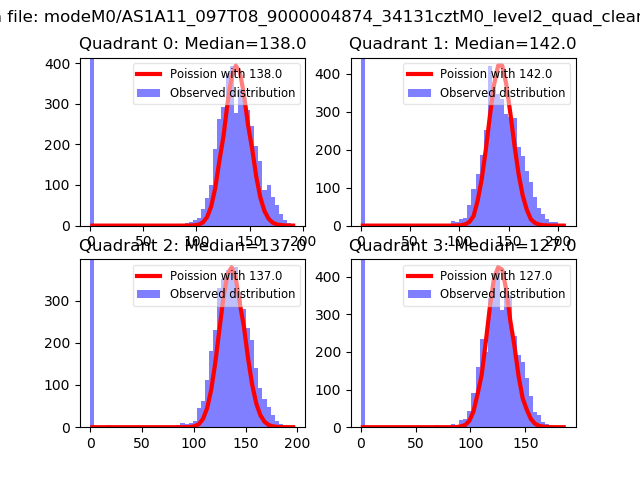 |
 |
| Quadrant-wise count rates Data is divided into 100 sec bins |
 |
|
| Module-wise count rates for Quadrant A Data is divided into 100 sec bins |
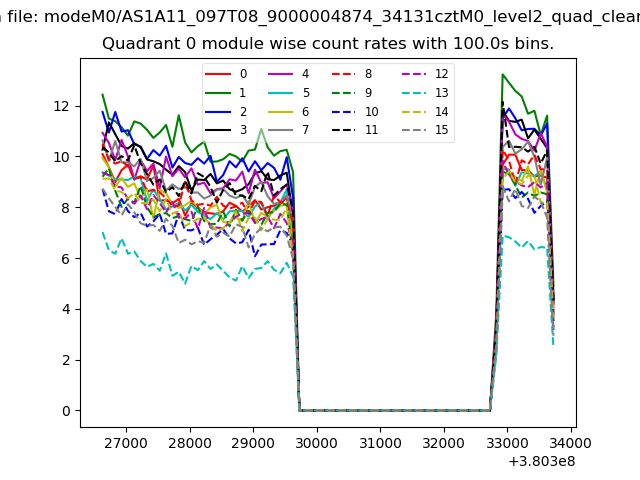 |
 |
| Module-wise count rates for Quadrant B Data is divided into 100 sec bins |
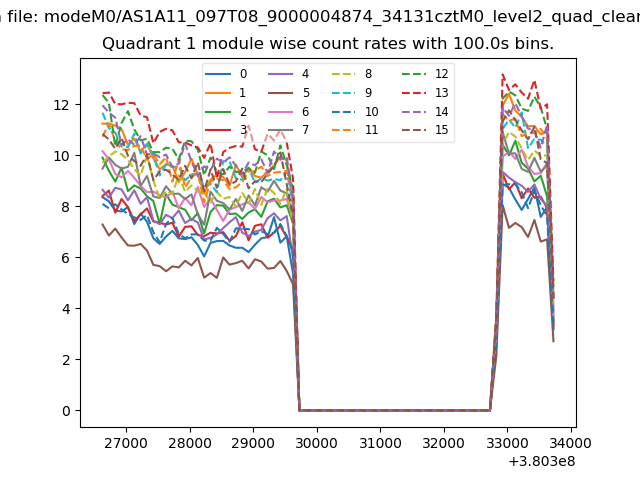 |
 |
| Module-wise count rates for Quadrant C Data is divided into 100 sec bins |
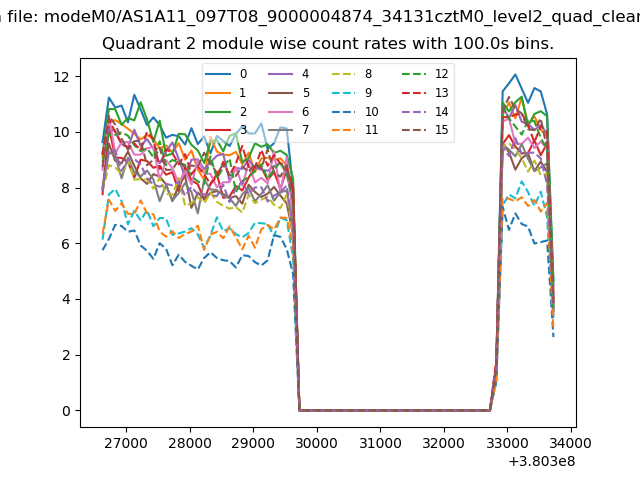 |
 |
| Module-wise count rates for Quadrant D Data is divided into 100 sec bins |
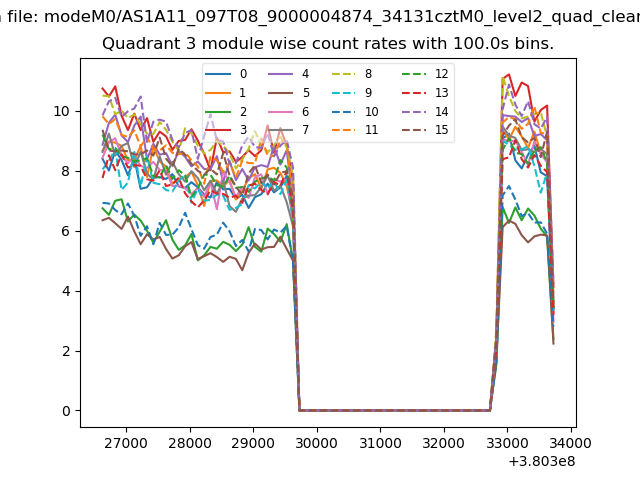 |
 |
| Parameter | Plot |
|---|---|
| CZT HV Monitor | 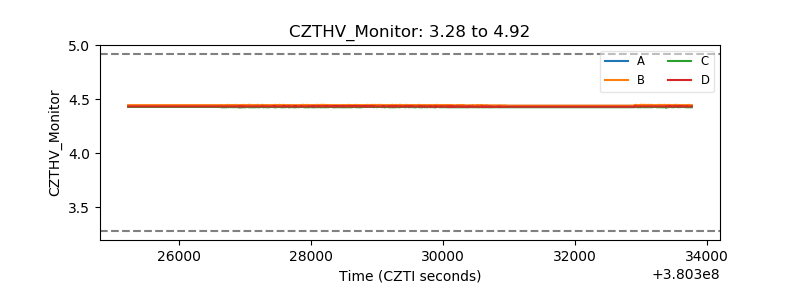 |
| D_VDD | 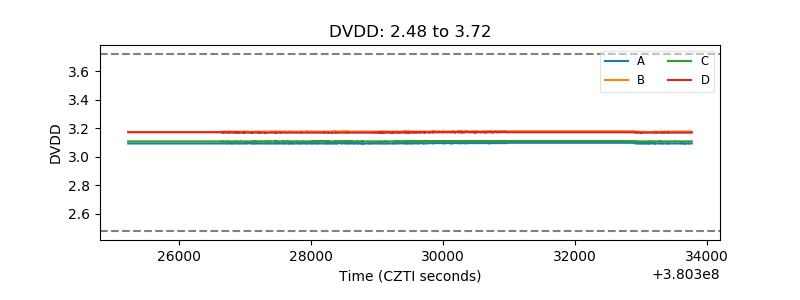 |
| Temperature 1 | 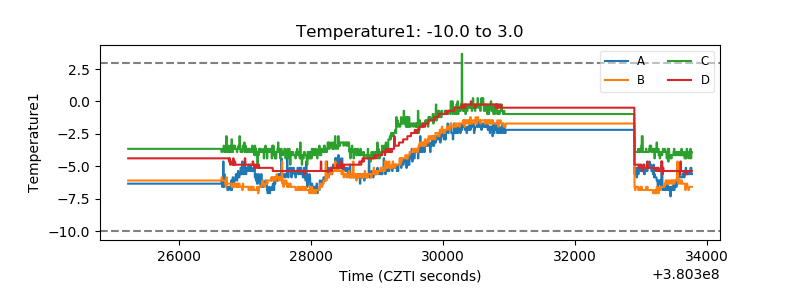 |
| Veto HV Monitor | 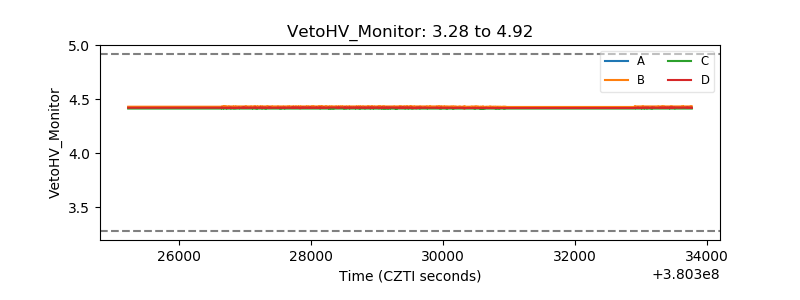 |
| Veto LLD | 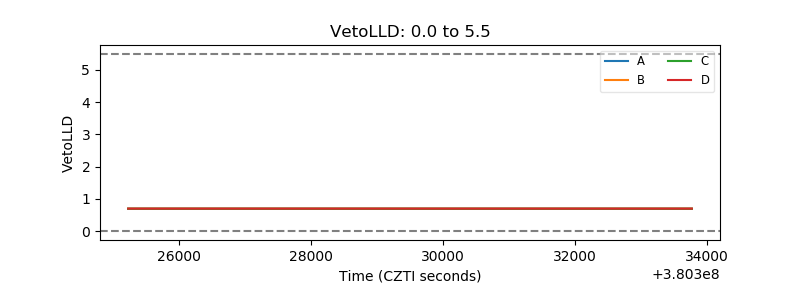 |
| Alpha Counter |  |
| _CPM_Rate | 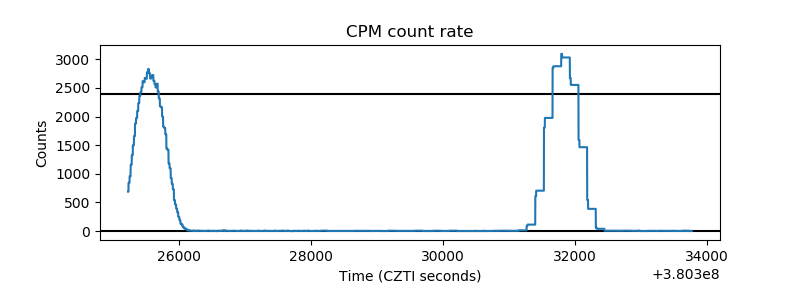 |
| CZT Counter | 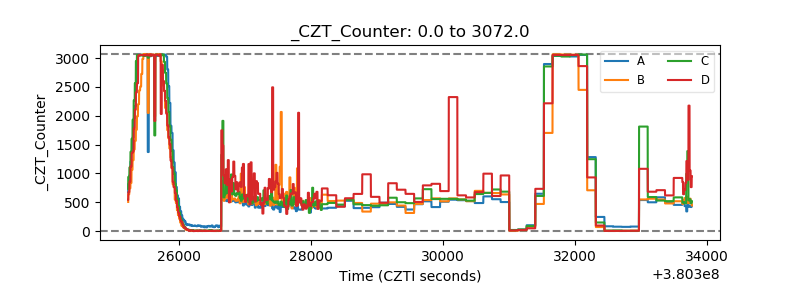 |
| +2.5 Volts monitor |  |
| +5 Volts monitor |  |
| _ROLL_ROT | 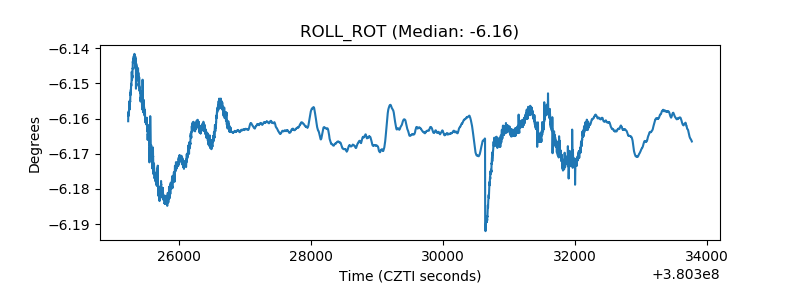 |
| _Roll_DEC | 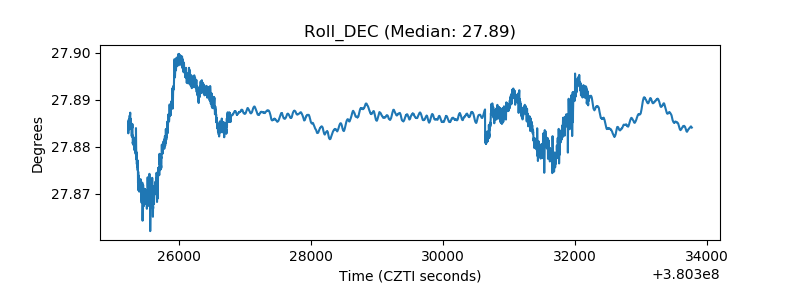 |
| _Roll_RA |  |
| Veto Counter | 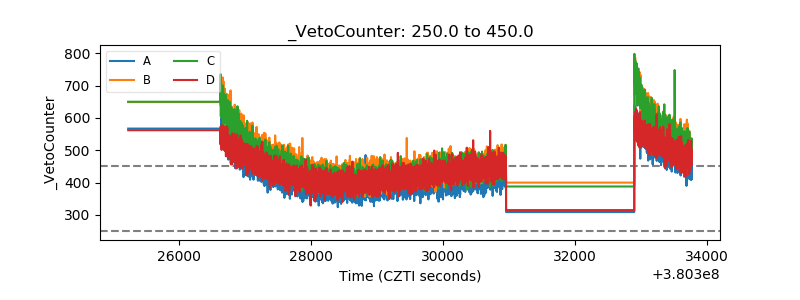 |