| Param | Original file | Final file |
|---|---|---|
| Filename | modeM0/AS1A11_097T08_9000004874_34132cztM0_level2.evt | modeM0/AS1A11_097T08_9000004874_34132cztM0_level2_quad_clean.evt |
| Size (bytes) | 452,949,120 | 83,082,240 |
| Size | 432.0 MB | 79.2 MB |
| Events in quadrant A | 2,587,451 | 544,441 |
| Events in quadrant B | 3,025,250 | 565,864 |
| Events in quadrant C | 3,404,793 | 535,356 |
| Events in quadrant D | 4,335,879 | 494,377 |
| Mode M9 | |||
|---|---|---|---|
| Quadrant | BADHDUFLAG | Total packets | Discarded packets |
| A | 0 | 33 | 0 |
| B | 0 | 33 | 0 |
| C | 0 | 33 | 0 |
| D | 0 | 34 | 0 |
| Mode M0 | |||
|---|---|---|---|
| Quadrant | BADHDUFLAG | Total packets | Discarded packets |
| A | 0 | 10903 | 3 |
| B | 0 | 12259 | 2 |
| C | 0 | 13324 | 2 |
| D | 0 | 16652 | 2 |
| Mode SS | |||
|---|---|---|---|
| Quadrant | BADHDUFLAG | Total packets | Discarded packets |
| A | 0 | 110 | 0 |
| B | 0 | 110 | 0 |
| C | 0 | 110 | 0 |
| D | 0 | 110 | 0 |
| Quadrant | Total seconds | Saturated seconds | Saturation percentage |
|---|---|---|---|
| A | 5366 | 9 | 0.167723% |
| B | 5366 | 62 | 1.155423% |
| C | 5366 | 125 | 2.329482% |
| D | 5366 | 185 | 3.447633% |
Noise dominated data is calculated using 1-second bins in cleaned event files. If a bin has >2000 counts, and if more than 50% of those come from <1% of pixels, then it is considered to be noise-dominated and hence unusable.
| Quadrant | # 1 sec bins | Bins with >0 counts | Bins with >2000 counts | High rate bins dominated by noise | Noise dominated (total time) | Noise dominated (detector-on time) | Marked lightcurve |
|---|---|---|---|---|---|---|---|
| A | 7400 | 5367 | 0 | 0 | 0.00% | 0.00% | 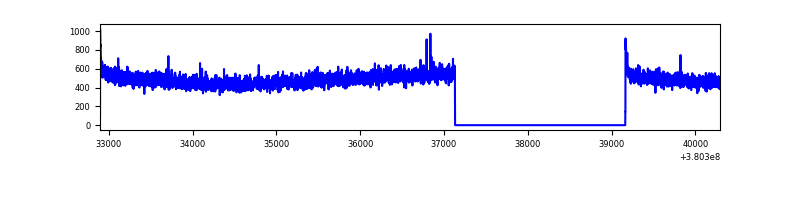 |
| B | 7400 | 5367 | 39 | 39 | 0.53% | 0.73% | 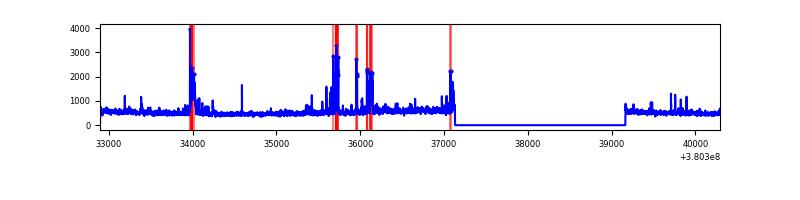 |
| C | 7400 | 5367 | 98 | 98 | 1.32% | 1.83% | 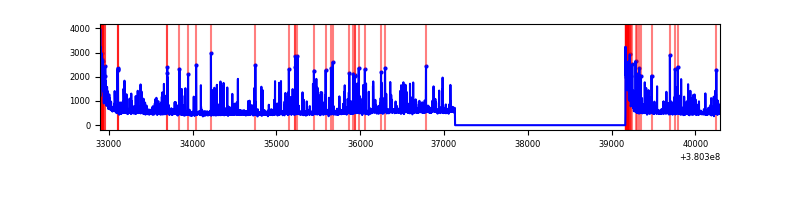 |
| D | 7400 | 5367 | 166 | 166 | 2.24% | 3.09% | 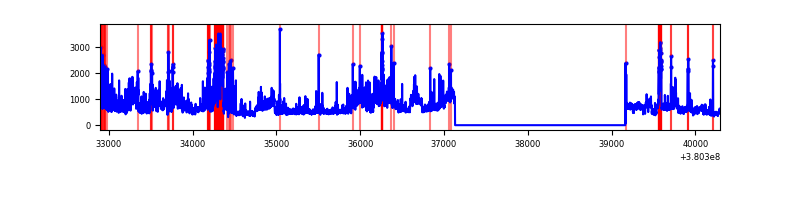 |
Top three noisy pixels from each quadrant. If the there are fewer than three noisy pixels in the level2.evt file, extra rows are filled as -1
| Pixel properties | Quadrant properties | ||||||
|---|---|---|---|---|---|---|---|
| Quadrant | DetID | PixID | Counts | Sigma | Mean | Median | Sigma |
| A | 10 | 83 | 20185 | 148.56 | 661 | 649 | 131.5 |
| A | 13 | 6 | 12494 | 90.07 | 661 | 649 | 131.5 |
| A | 13 | 254 | 9709 | 68.89 | 661 | 649 | 131.5 |
| B | 5 | 172 | 185671 | 1494.49 | 663 | 648 | 123.8 |
| B | 0 | 219 | 59661 | 476.67 | 663 | 648 | 123.8 |
| B | 15 | 185 | 57029 | 455.41 | 663 | 648 | 123.8 |
| C | 0 | 10 | 598916 | 4082.64 | 636 | 643 | 146.5 |
| C | 15 | 214 | 233659 | 1590.11 | 636 | 643 | 146.5 |
| C | 14 | 254 | 62990 | 425.46 | 636 | 643 | 146.5 |
| D | 8 | 195 | 701758 | 4547.46 | 627 | 612 | 154.2 |
| D | 14 | 52 | 439566 | 2846.95 | 627 | 612 | 154.2 |
| D | 2 | 250 | 360042 | 2331.17 | 627 | 612 | 154.2 |
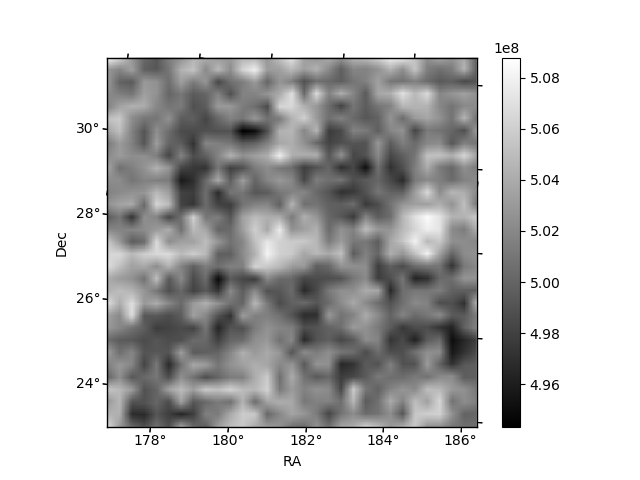
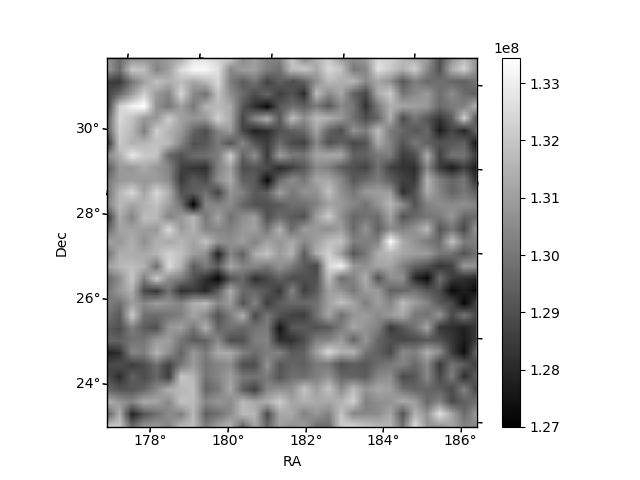
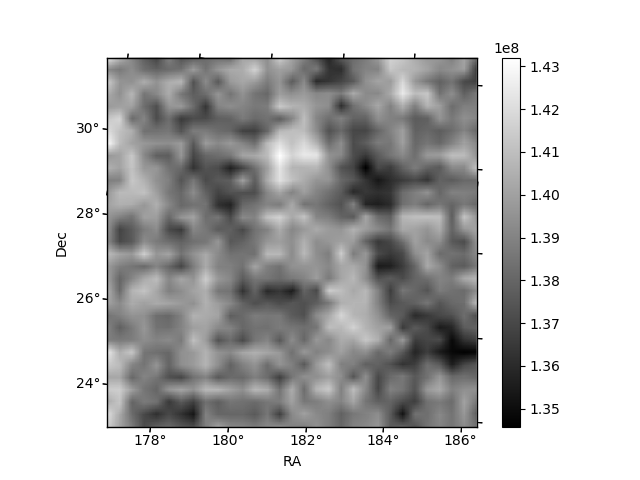
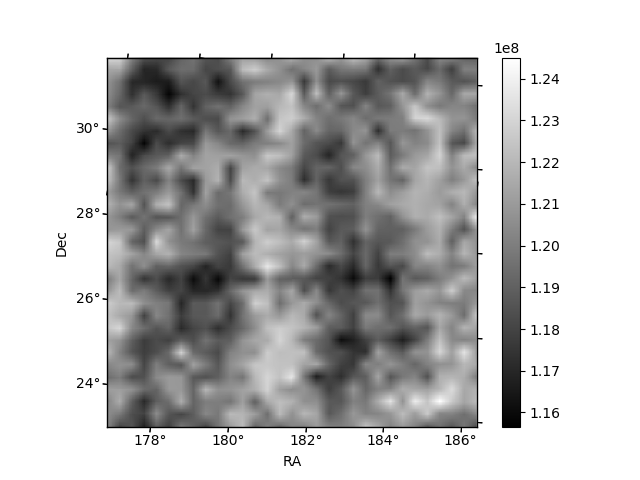
Histogram calculated using DETX and DETY for each event in the final _common_clean file
| Quadrant A | 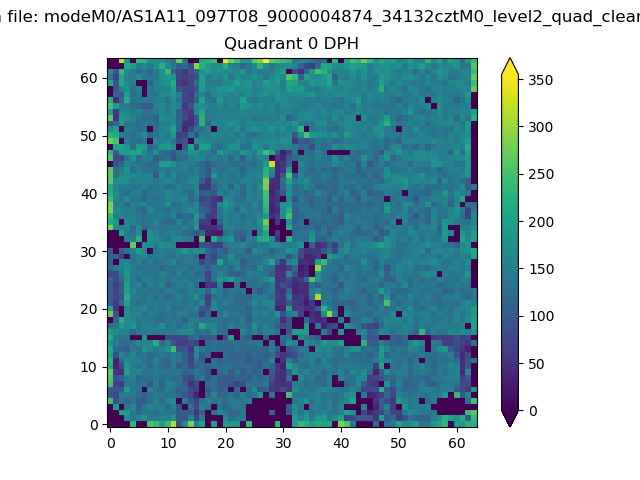 |
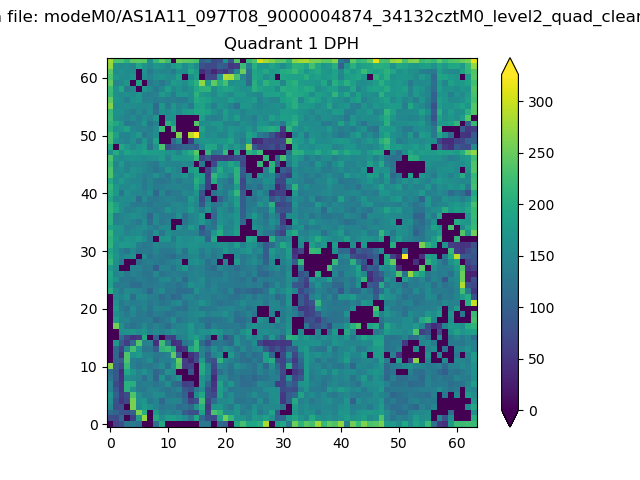 |
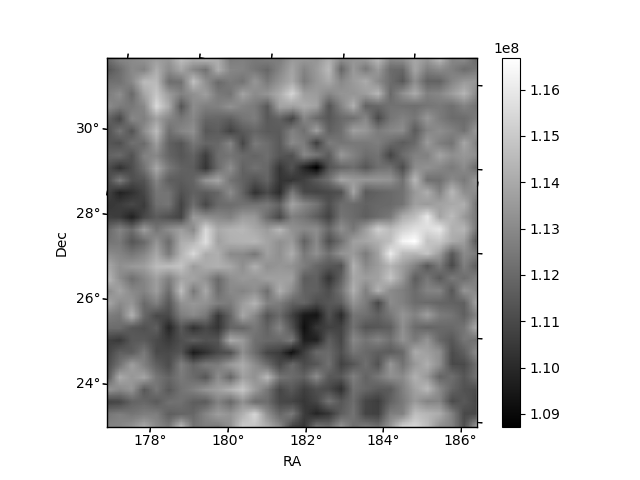
Quadrant B |
|---|---|---|---|
| Quadrant D | 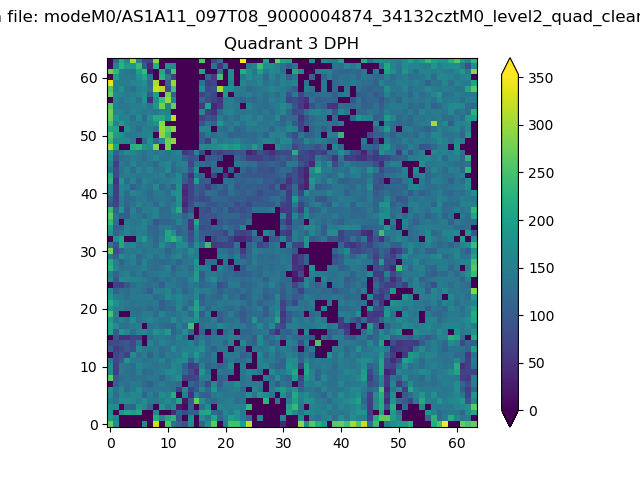 |
 |
Quadrant C |
| Plot type | Count rate plots | Images |
|---|---|---|
| Comparison with Poisson distribution Blue bars denote a histogram of data divided into 1 sec bins. Red curve is a Poisson curve with rate = median count rate of data. |
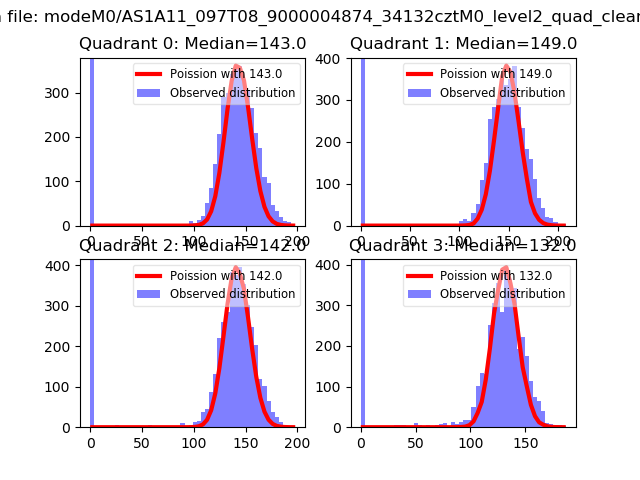 |
 |
| Quadrant-wise count rates Data is divided into 100 sec bins |
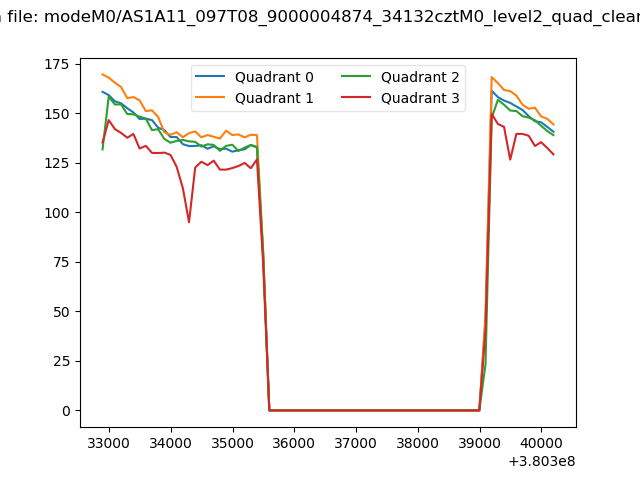 |
|
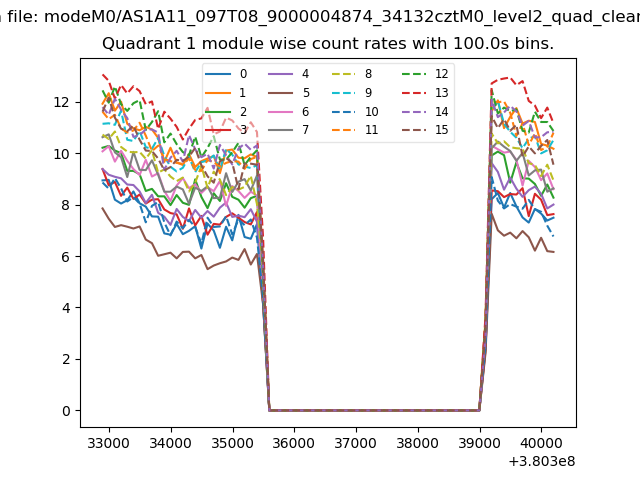
| Module-wise count rates for Quadrant A Data is divided into 100 sec bins |
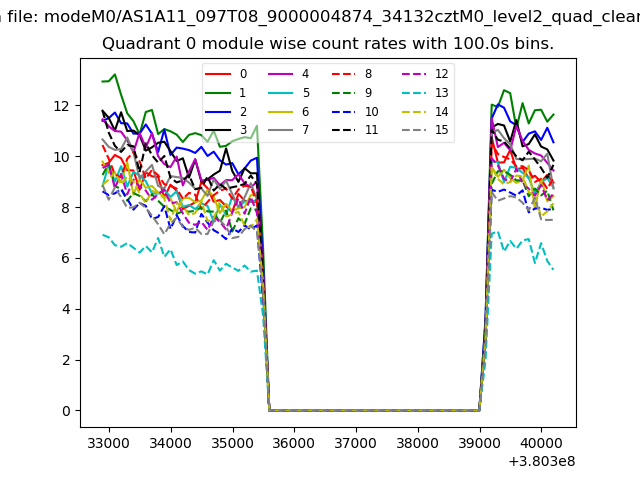 |
 |
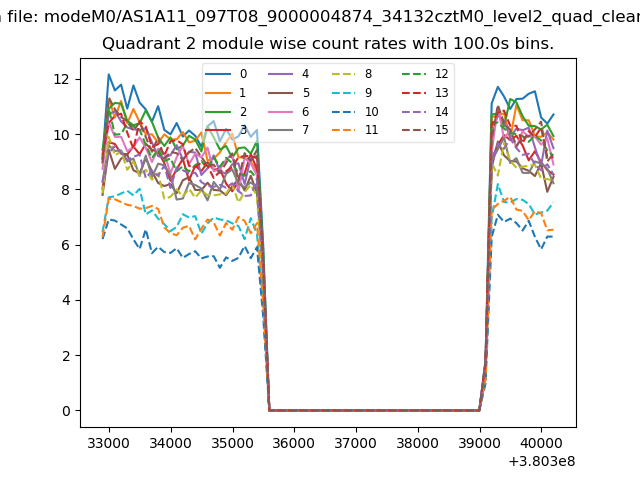
| Module-wise count rates for Quadrant B Data is divided into 100 sec bins |
 |
 |
| Module-wise count rates for Quadrant C Data is divided into 100 sec bins |
 |
 |
| Module-wise count rates for Quadrant D Data is divided into 100 sec bins |
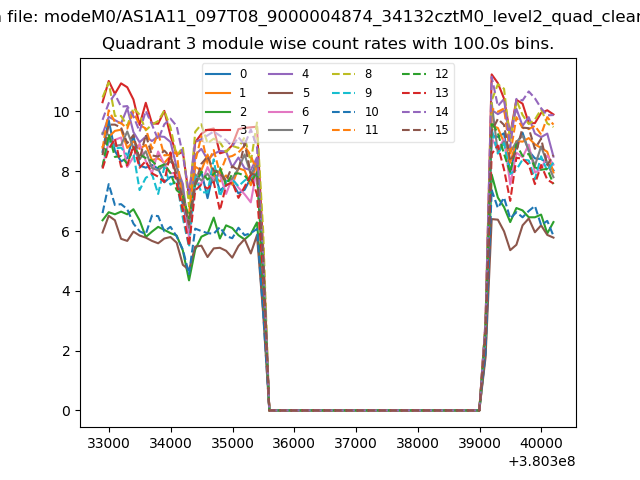 |
 |
| Parameter | Plot |
|---|---|
| CZT HV Monitor | 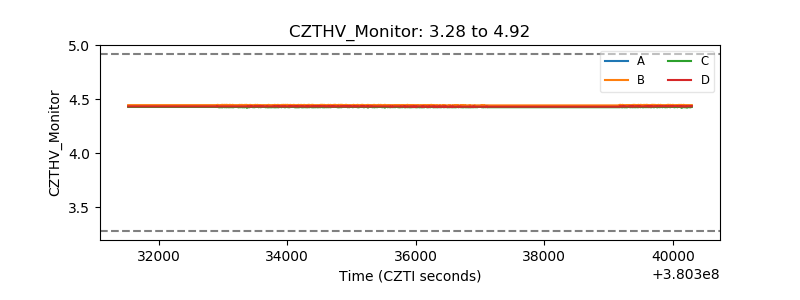 |
| D_VDD | 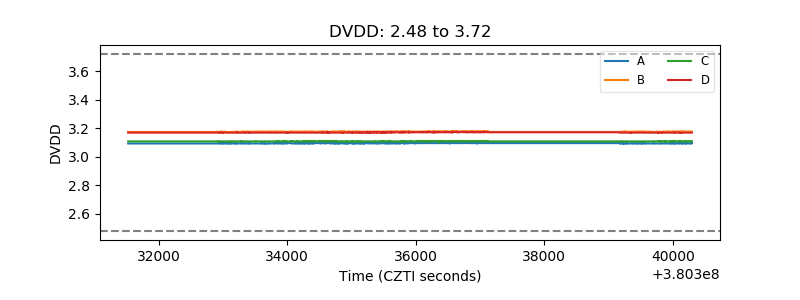 |
| Temperature 1 | 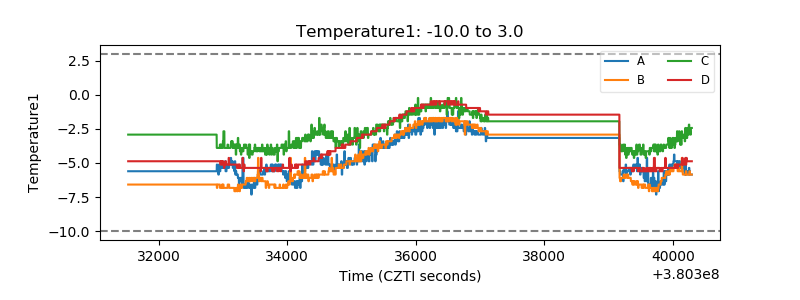 |
| Veto HV Monitor | 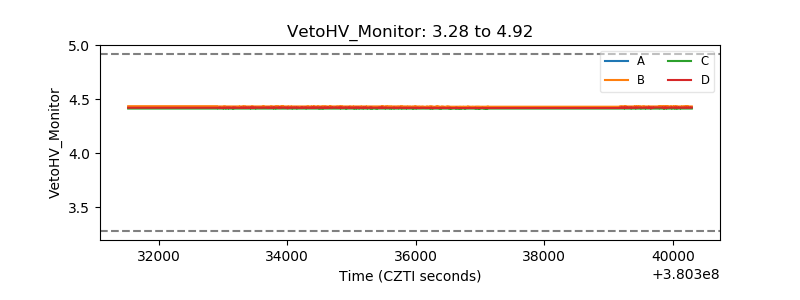 |
| Veto LLD | 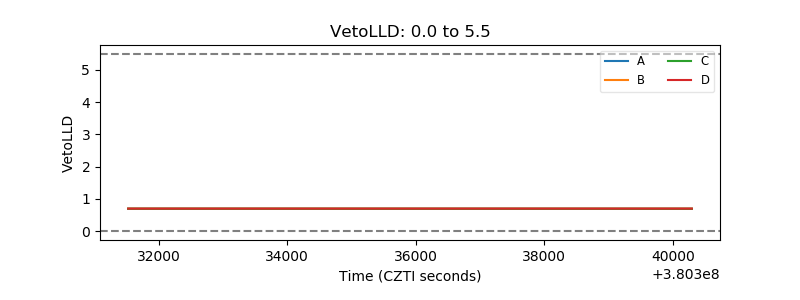 |
| Alpha Counter | 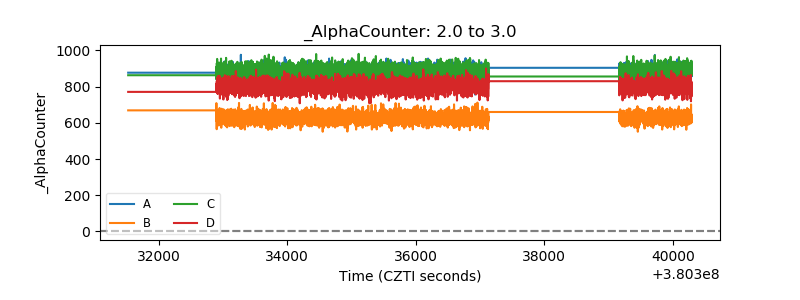 |
| _CPM_Rate | 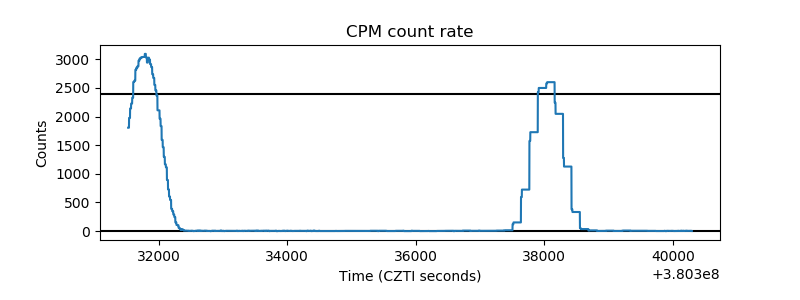 |
| CZT Counter | 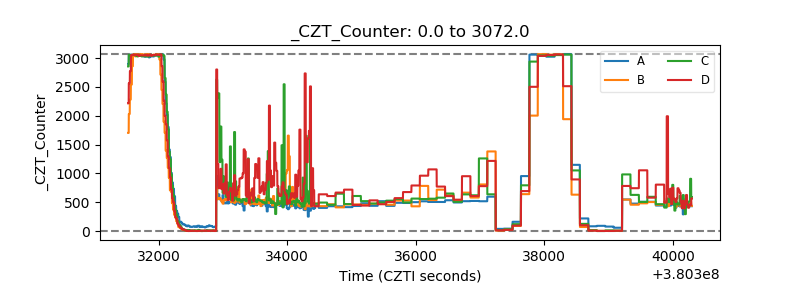 |
| +2.5 Volts monitor |  |
| +5 Volts monitor |  |
| _ROLL_ROT | 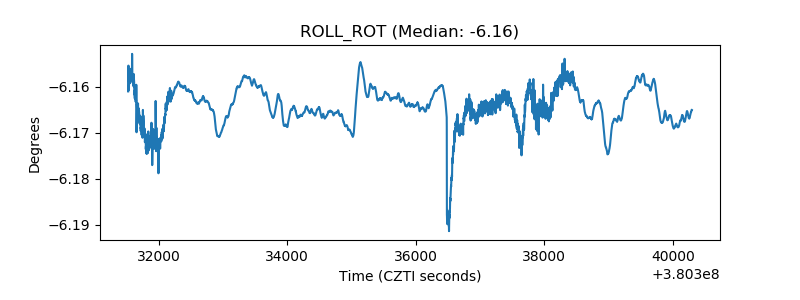 |
| _Roll_DEC |  |
| _Roll_RA | 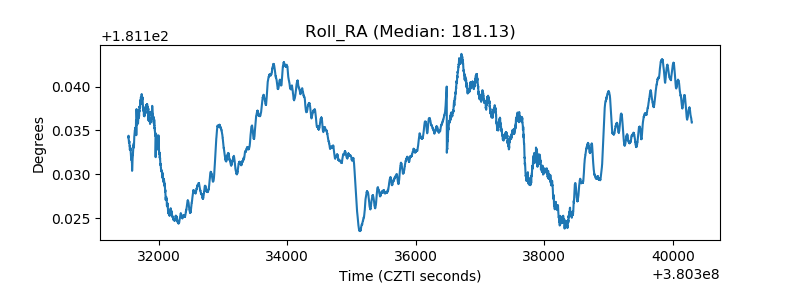 |
| Veto Counter | 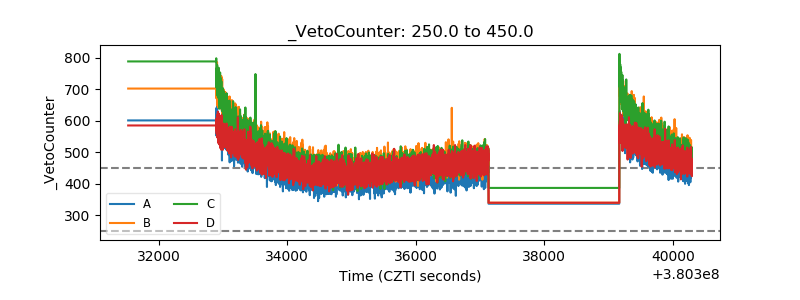 |