| Param | Original file | Final file |
|---|---|---|
| Filename | modeM0/AS1A11_097T08_9000004874_34133cztM0_level2.evt | modeM0/AS1A11_097T08_9000004874_34133cztM0_level2_quad_clean.evt |
| Size (bytes) | 444,058,560 | 74,004,480 |
| Size | 423.5 MB | 70.6 MB |
| Events in quadrant A | 2,546,021 | 478,318 |
| Events in quadrant B | 3,229,628 | 493,246 |
| Events in quadrant C | 3,616,677 | 463,664 |
| Events in quadrant D | 3,700,279 | 438,615 |
| Mode M9 | |||
|---|---|---|---|
| Quadrant | BADHDUFLAG | Total packets | Discarded packets |
| A | 0 | 28 | 0 |
| B | 0 | 28 | 0 |
| C | 0 | 28 | 0 |
| D | 0 | 28 | 0 |
| Mode M0 | |||
|---|---|---|---|
| Quadrant | BADHDUFLAG | Total packets | Discarded packets |
| A | 0 | 10654 | 4 |
| B | 0 | 12873 | 2 |
| C | 0 | 13954 | 2 |
| D | 0 | 14669 | 2 |
| Mode SS | |||
|---|---|---|---|
| Quadrant | BADHDUFLAG | Total packets | Discarded packets |
| A | 0 | 106 | 0 |
| B | 0 | 106 | 0 |
| C | 0 | 106 | 0 |
| D | 0 | 106 | 0 |
| Quadrant | Total seconds | Saturated seconds | Saturation percentage |
|---|---|---|---|
| A | 5243 | 7 | 0.133511% |
| B | 5243 | 32 | 0.610338% |
| C | 5243 | 189 | 3.604806% |
| D | 5243 | 104 | 1.983597% |
Noise dominated data is calculated using 1-second bins in cleaned event files. If a bin has >2000 counts, and if more than 50% of those come from <1% of pixels, then it is considered to be noise-dominated and hence unusable.
| Quadrant | # 1 sec bins | Bins with >0 counts | Bins with >2000 counts | High rate bins dominated by noise | Noise dominated (total time) | Noise dominated (detector-on time) | Marked lightcurve |
|---|---|---|---|---|---|---|---|
| A | 7367 | 5245 | 0 | 0 | 0.00% | 0.00% | 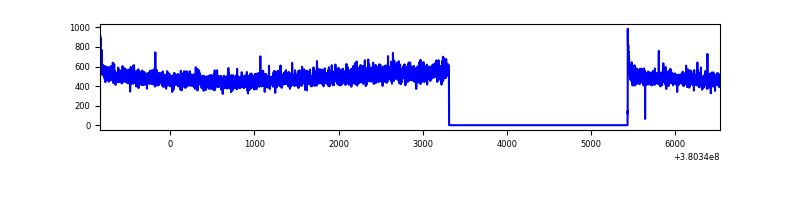 |
| B | 7367 | 5245 | 8 | 8 | 0.11% | 0.15% | 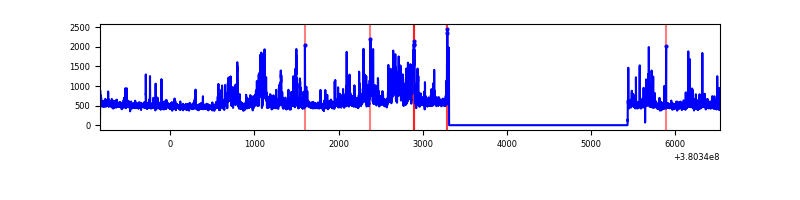 |
| C | 7367 | 5245 | 178 | 178 | 2.42% | 3.39% | 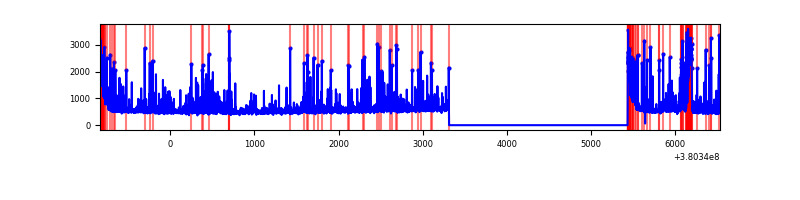 |
| D | 7367 | 5245 | 90 | 90 | 1.22% | 1.72% | 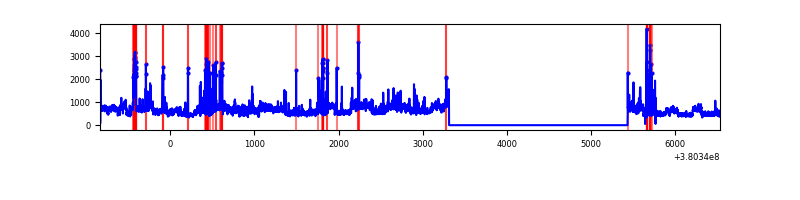 |
Top three noisy pixels from each quadrant. If the there are fewer than three noisy pixels in the level2.evt file, extra rows are filled as -1
| Pixel properties | Quadrant properties | ||||||
|---|---|---|---|---|---|---|---|
| Quadrant | DetID | PixID | Counts | Sigma | Mean | Median | Sigma |
| A | 10 | 83 | 20080 | 150.43 | 650 | 639 | 129.2 |
| A | 13 | 6 | 15134 | 112.16 | 650 | 639 | 129.2 |
| A | 13 | 254 | 9161 | 65.94 | 650 | 639 | 129.2 |
| B | 5 | 31 | 329306 | 2705.75 | 647 | 631 | 121.5 |
| B | 5 | 15 | 131657 | 1078.65 | 647 | 631 | 121.5 |
| B | 5 | 172 | 94038 | 768.95 | 647 | 631 | 121.5 |
| C | 0 | 10 | 668987 | 4676.41 | 618 | 623 | 142.9 |
| C | 14 | 254 | 275143 | 1920.76 | 618 | 623 | 142.9 |
| C | 15 | 214 | 226736 | 1582.07 | 618 | 623 | 142.9 |
| D | 8 | 195 | 736657 | 4869.46 | 618 | 601 | 151.2 |
| D | 2 | 250 | 218024 | 1438.39 | 618 | 601 | 151.2 |
| D | 10 | 118 | 111086 | 730.93 | 618 | 601 | 151.2 |
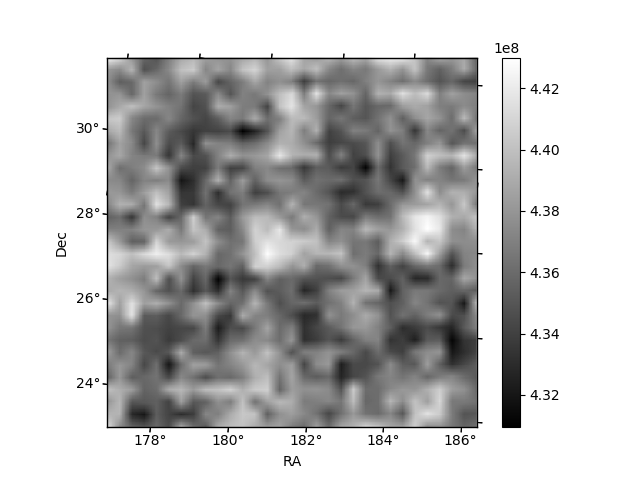
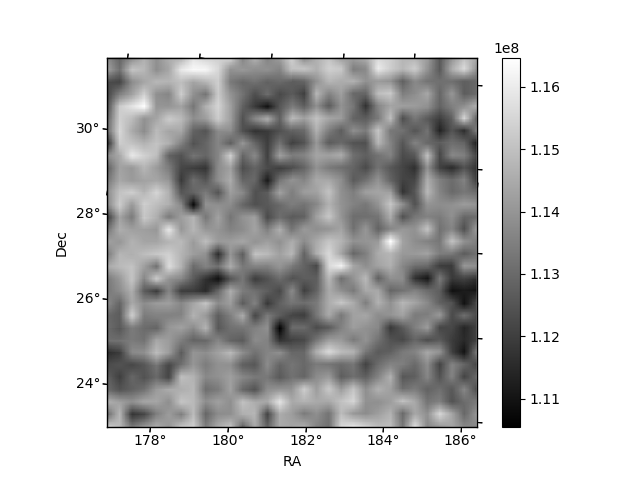
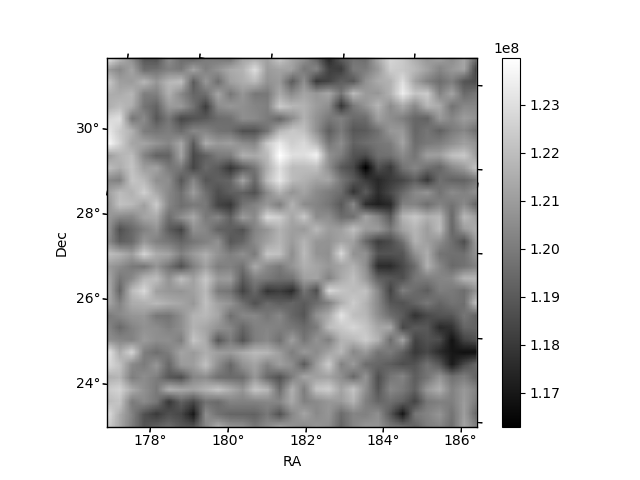
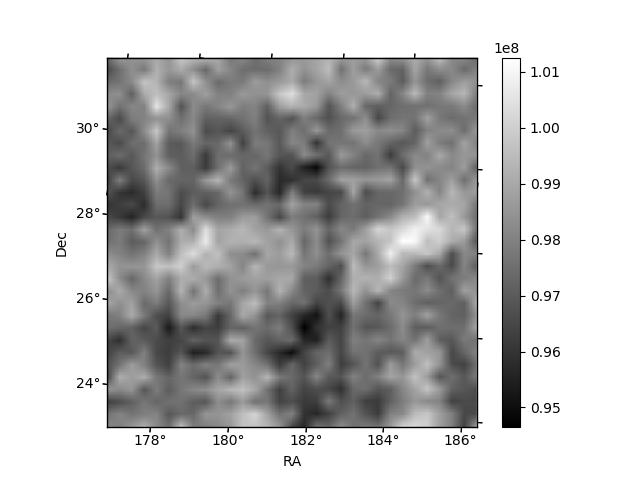
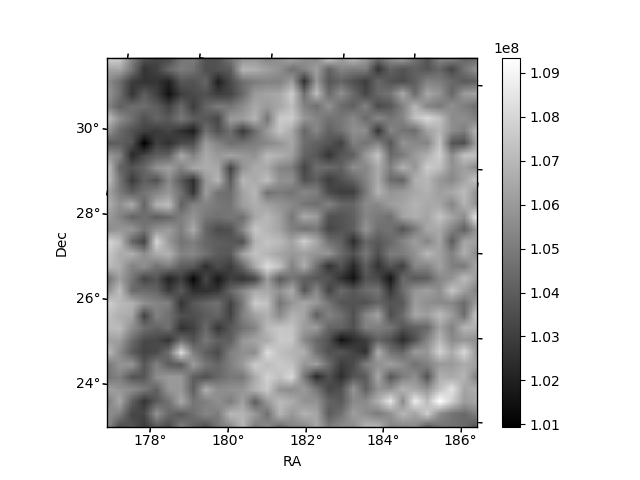
Histogram calculated using DETX and DETY for each event in the final _common_clean file
| Quadrant A | 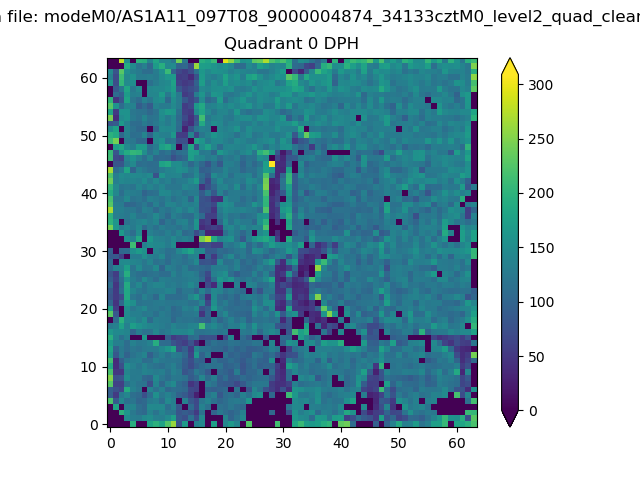 |
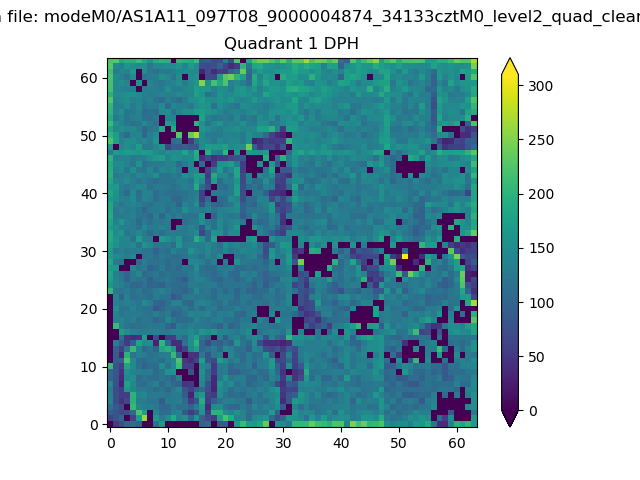 |
Quadrant B |
|---|---|---|---|
| Quadrant D | 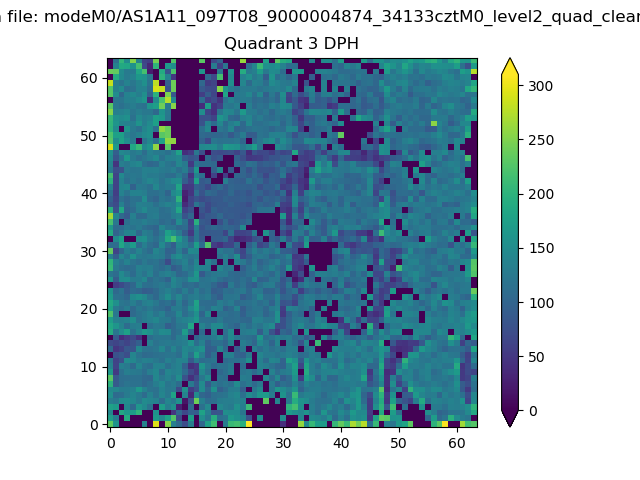 |
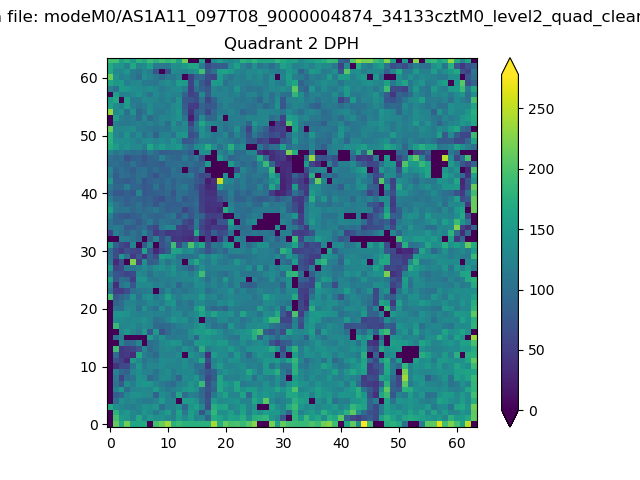 |
Quadrant C |
| Plot type | Count rate plots | Images |
|---|---|---|
| Comparison with Poisson distribution Blue bars denote a histogram of data divided into 1 sec bins. Red curve is a Poisson curve with rate = median count rate of data. |
 |
 |
| Quadrant-wise count rates Data is divided into 100 sec bins |
 |
|
| Module-wise count rates for Quadrant A Data is divided into 100 sec bins |
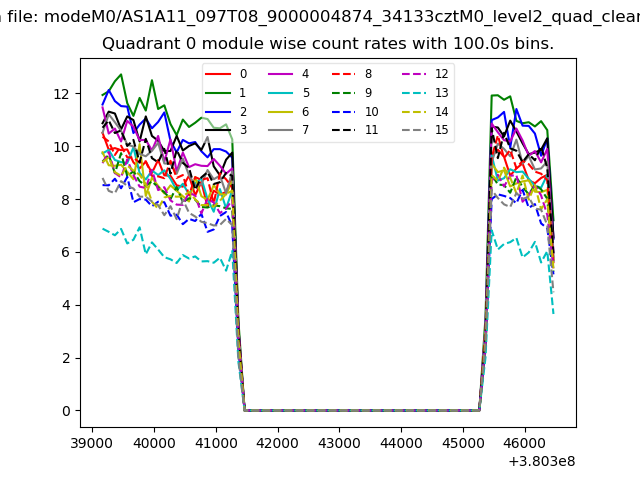 |
 |
| Module-wise count rates for Quadrant B Data is divided into 100 sec bins |
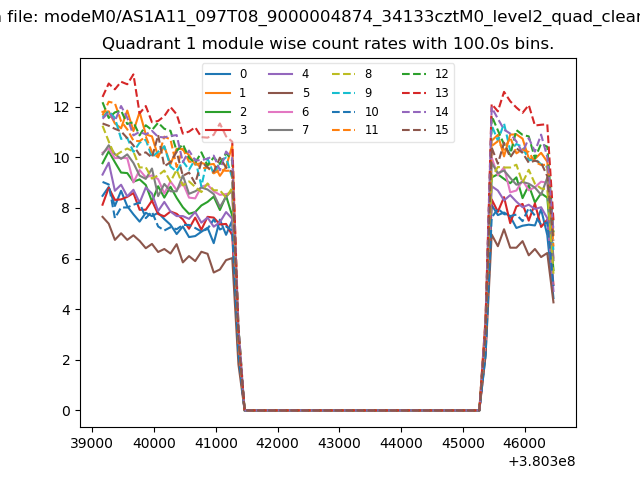 |
 |
| Module-wise count rates for Quadrant C Data is divided into 100 sec bins |
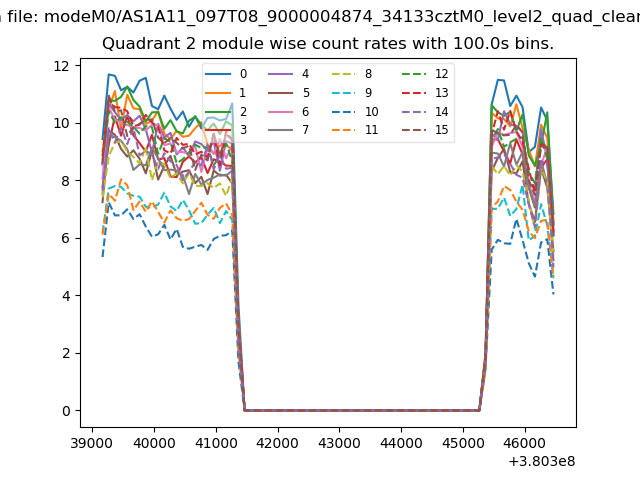 |
 |
| Module-wise count rates for Quadrant D Data is divided into 100 sec bins |
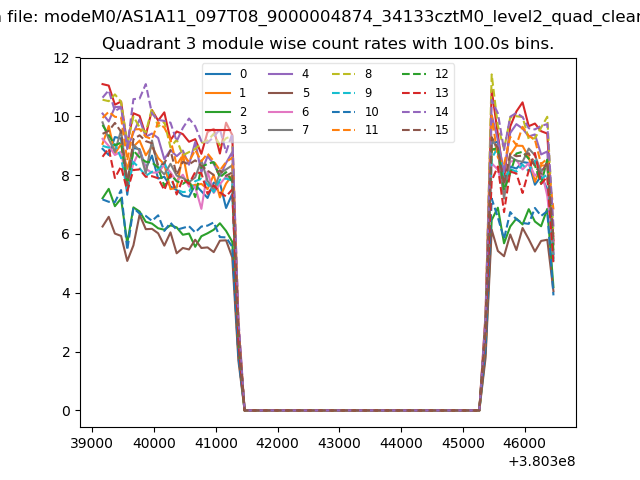 |
 |
| Parameter | Plot |
|---|---|
| CZT HV Monitor | 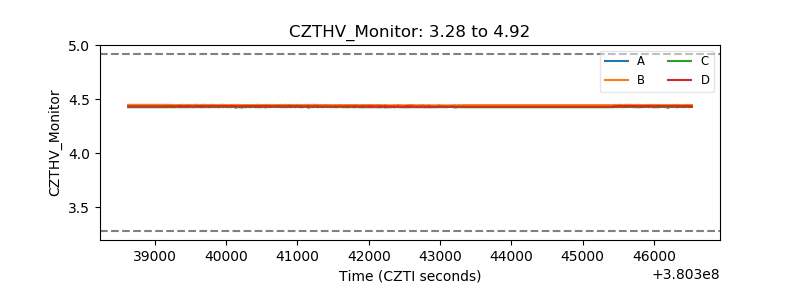 |
| D_VDD | 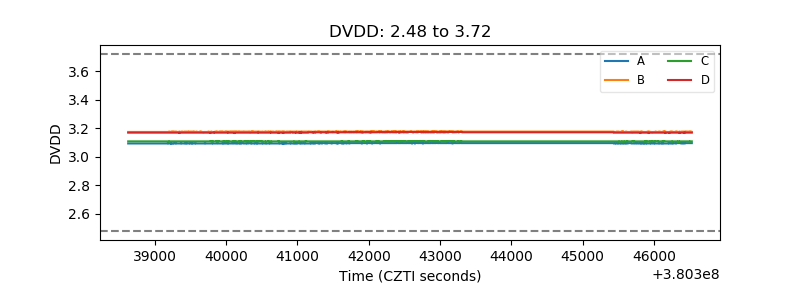 |
| Temperature 1 | 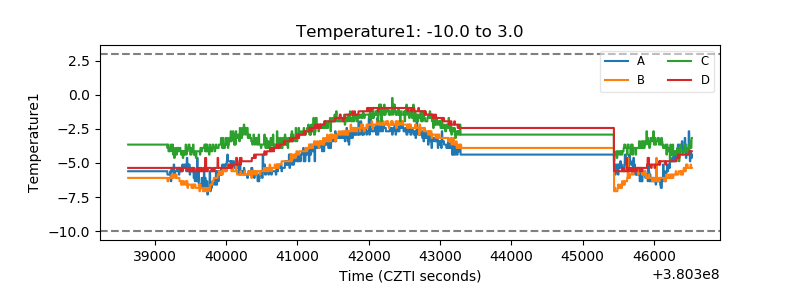 |
| Veto HV Monitor | 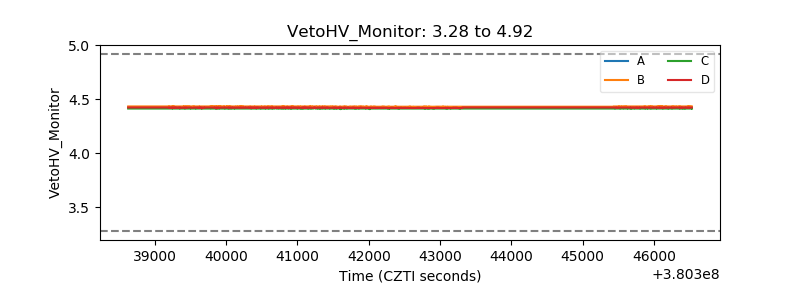 |
| Veto LLD | 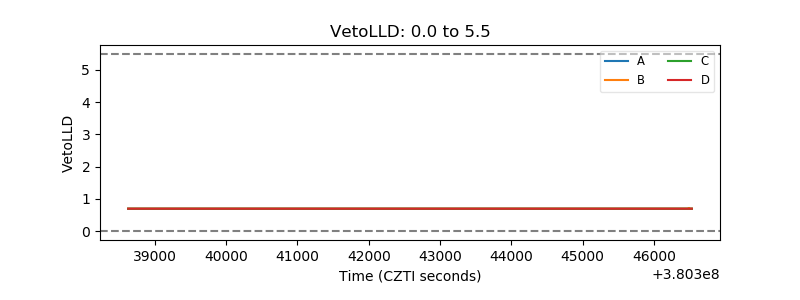 |
| Alpha Counter | 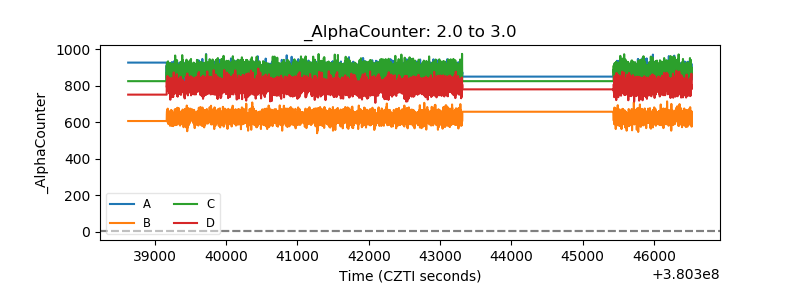 |
| _CPM_Rate |  |
| CZT Counter | 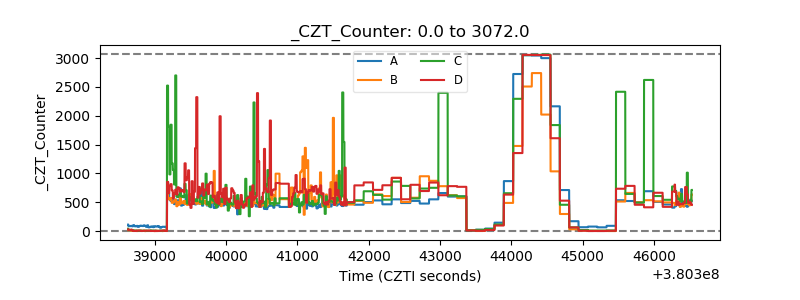 |
| +2.5 Volts monitor |  |
| +5 Volts monitor |  |
| _ROLL_ROT | 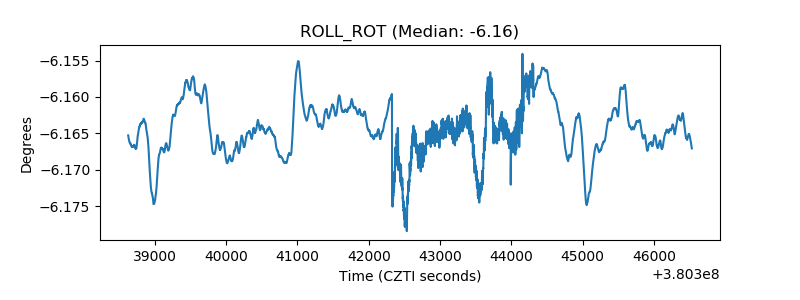 |
| _Roll_DEC | 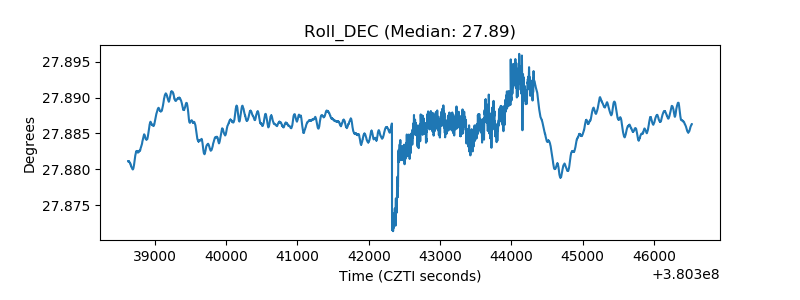 |
| _Roll_RA | 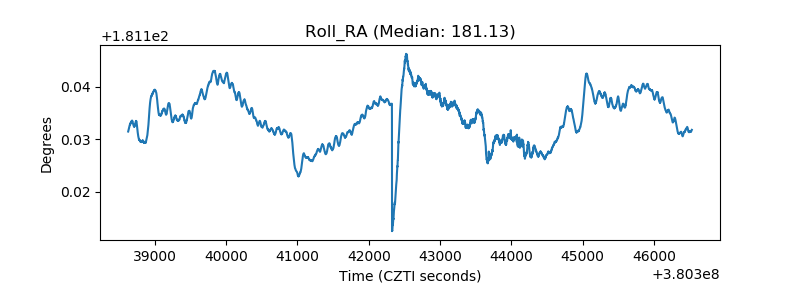 |
| Veto Counter | 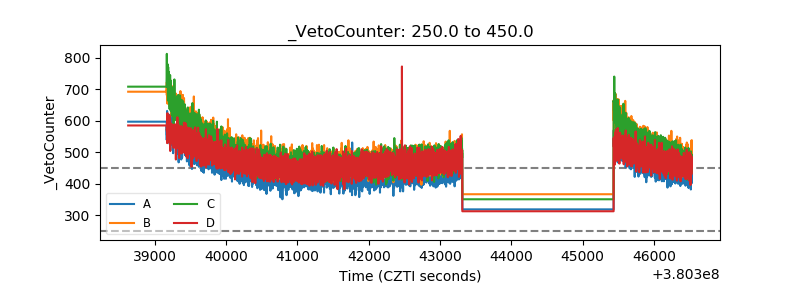 |