| Param | Original file | Final file |
|---|---|---|
| Filename | modeM0/AS1A11_097T08_9000004874_34135cztM0_level2.evt | modeM0/AS1A11_097T08_9000004874_34135cztM0_level2_quad_clean.evt |
| Size (bytes) | 488,088,000 | 55,762,560 |
| Size | 465.5 MB | 53.2 MB |
| Events in quadrant A | 2,287,689 | 344,575 |
| Events in quadrant B | 5,644,571 | 342,368 |
| Events in quadrant C | 3,064,243 | 338,738 |
| Events in quadrant D | 3,457,051 | 323,110 |
| Mode M9 | |||
|---|---|---|---|
| Quadrant | BADHDUFLAG | Total packets | Discarded packets |
| A | 0 | 20 | 0 |
| B | 0 | 20 | 0 |
| C | 0 | 20 | 0 |
| D | 0 | 20 | 0 |
| Mode M0 | |||
|---|---|---|---|
| Quadrant | BADHDUFLAG | Total packets | Discarded packets |
| A | 0 | 9732 | 2 |
| B | 0 | 19965 | 1 |
| C | 0 | 11980 | 1 |
| D | 0 | 13481 | 1 |
| Mode SS | |||
|---|---|---|---|
| Quadrant | BADHDUFLAG | Total packets | Discarded packets |
| A | 0 | 98 | 0 |
| B | 0 | 98 | 0 |
| C | 0 | 98 | 0 |
| D | 0 | 98 | 0 |
| Quadrant | Total seconds | Saturated seconds | Saturation percentage |
|---|---|---|---|
| A | 4836 | 3 | 0.062035% |
| B | 4836 | 1334 | 27.584781% |
| C | 4836 | 105 | 2.171216% |
| D | 4836 | 153 | 3.163772% |
Noise dominated data is calculated using 1-second bins in cleaned event files. If a bin has >2000 counts, and if more than 50% of those come from <1% of pixels, then it is considered to be noise-dominated and hence unusable.
| Quadrant | # 1 sec bins | Bins with >0 counts | Bins with >2000 counts | High rate bins dominated by noise | Noise dominated (total time) | Noise dominated (detector-on time) | Marked lightcurve |
|---|---|---|---|---|---|---|---|
| A | 6839 | 4837 | 0 | 0 | 0.00% | 0.00% | 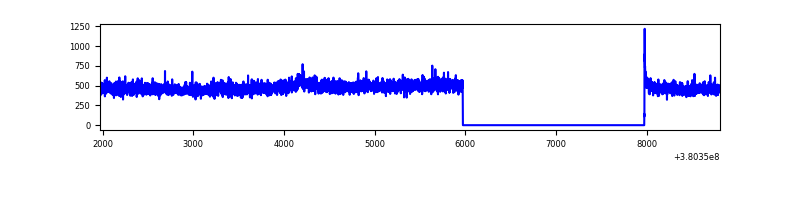 |
| B | 6839 | 4837 | 1132 | 1132 | 16.55% | 23.40% | 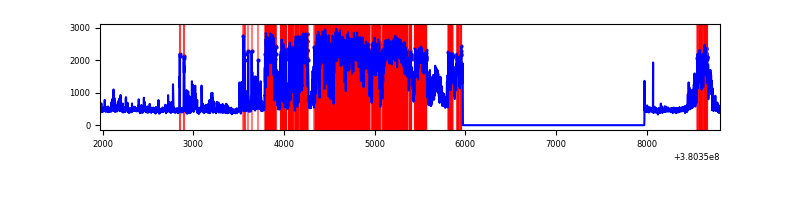 |
| C | 6839 | 4837 | 89 | 89 | 1.30% | 1.84% | 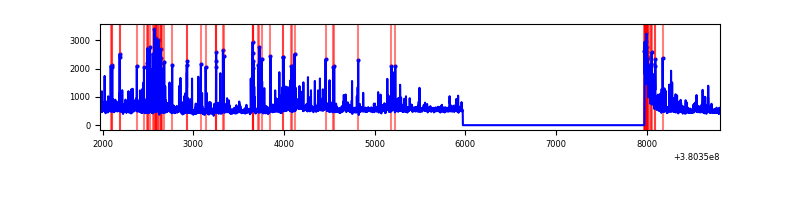 |
| D | 6839 | 4837 | 139 | 139 | 2.03% | 2.87% | 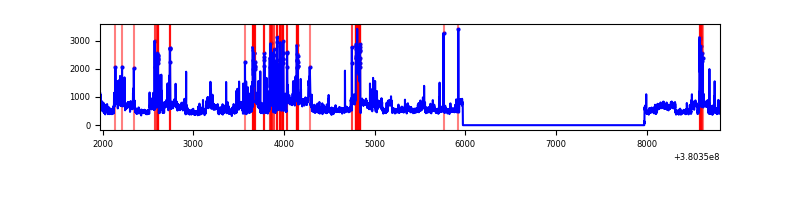 |
Top three noisy pixels from each quadrant. If the there are fewer than three noisy pixels in the level2.evt file, extra rows are filled as -1
| Pixel properties | Quadrant properties | ||||||
|---|---|---|---|---|---|---|---|
| Quadrant | DetID | PixID | Counts | Sigma | Mean | Median | Sigma |
| A | 10 | 83 | 12010 | 96.66 | 587 | 574 | 118.3 |
| A | 13 | 254 | 8794 | 69.48 | 587 | 574 | 118.3 |
| A | 13 | 6 | 7116 | 55.29 | 587 | 574 | 118.3 |
| B | 5 | 31 | 1982373 | 19445.12 | 530 | 517 | 101.9 |
| B | 5 | 15 | 1103517 | 10822.16 | 530 | 517 | 101.9 |
| B | 5 | 14 | 283544 | 2776.94 | 530 | 517 | 101.9 |
| C | 0 | 10 | 636020 | 4875.11 | 561 | 568 | 130.3 |
| C | 15 | 214 | 206931 | 1583.19 | 561 | 568 | 130.3 |
| C | 14 | 67 | 10137 | 73.41 | 561 | 568 | 130.3 |
| D | 8 | 195 | 584074 | 4150.15 | 564 | 548 | 140.6 |
| D | 7 | 80 | 405979 | 2883.5 | 564 | 548 | 140.6 |
| D | 2 | 250 | 143126 | 1014.04 | 564 | 548 | 140.6 |
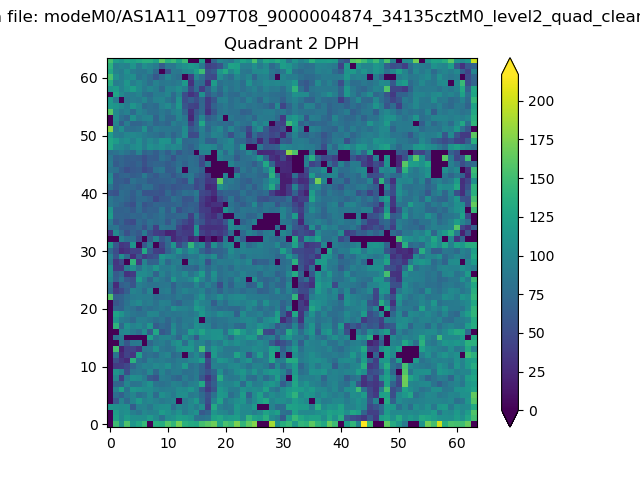
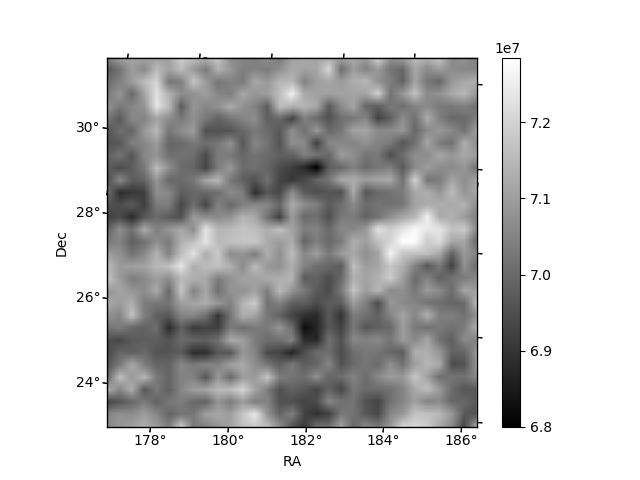
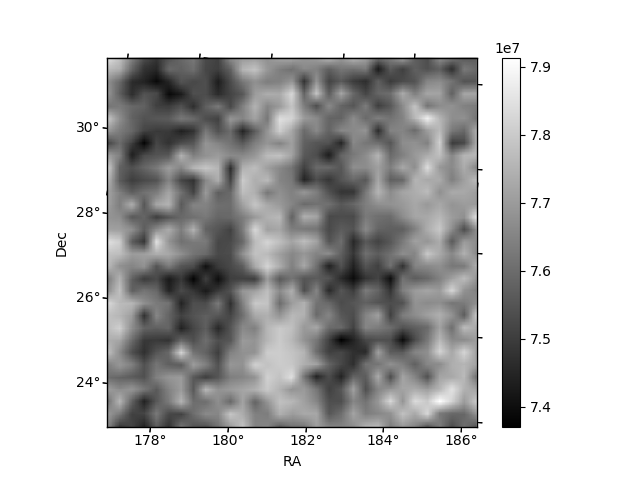
Histogram calculated using DETX and DETY for each event in the final _common_clean file
| Quadrant A | 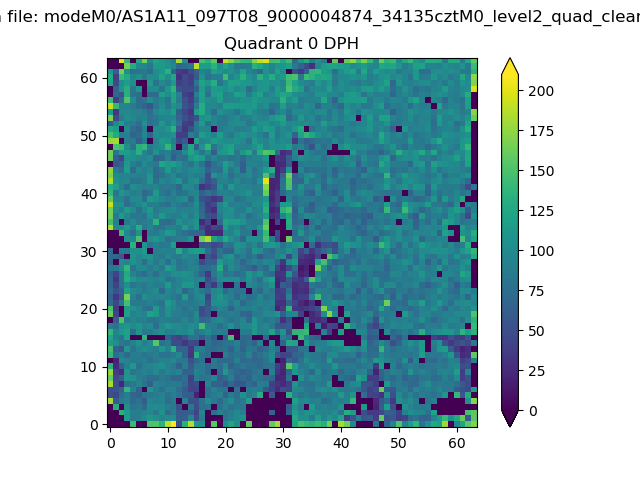 |
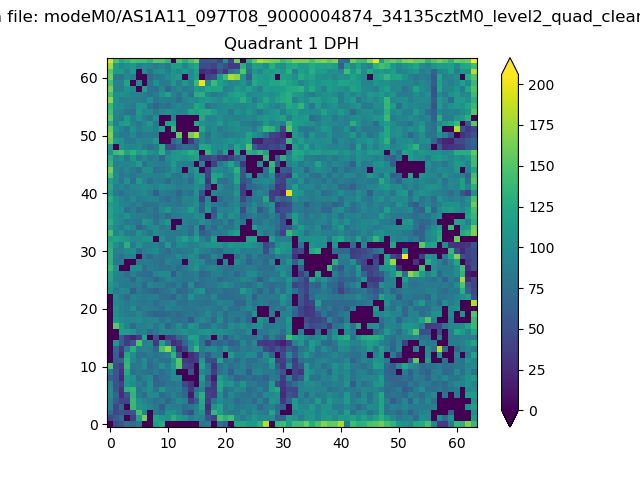 |
Quadrant B |
|---|---|---|---|
| Quadrant D | 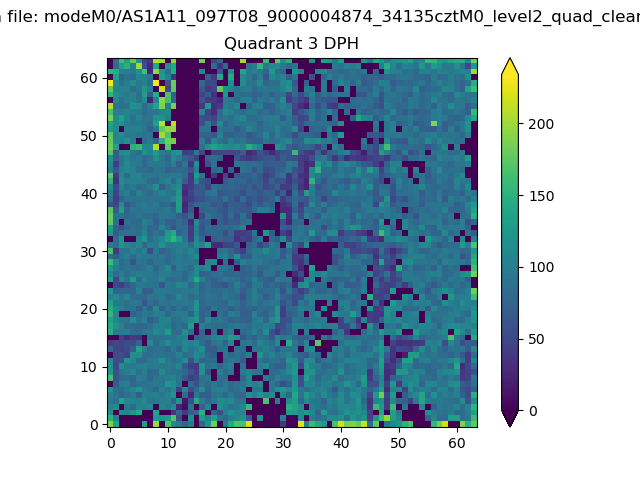 |
 |
Quadrant C |
| Plot type | Count rate plots | Images |
|---|---|---|
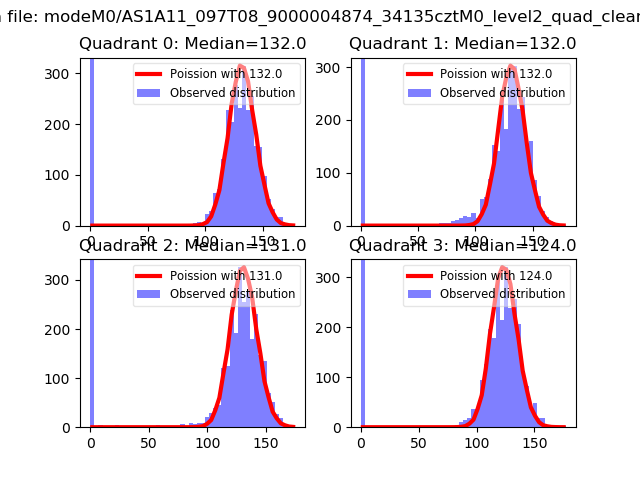
| Comparison with Poisson distribution Blue bars denote a histogram of data divided into 1 sec bins. Red curve is a Poisson curve with rate = median count rate of data. |
 |
 |
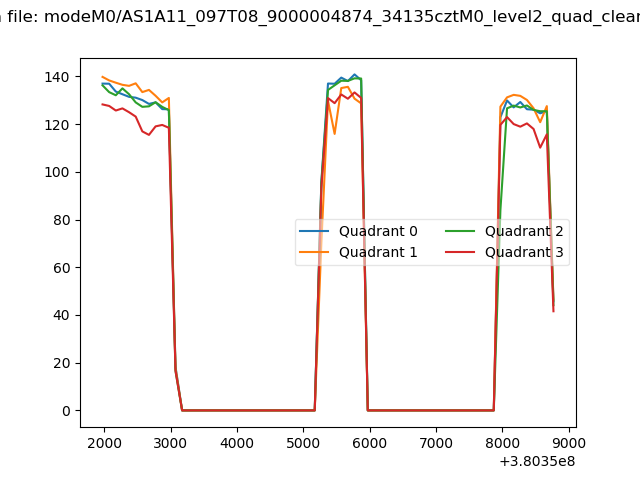
| Quadrant-wise count rates Data is divided into 100 sec bins |
 |
|
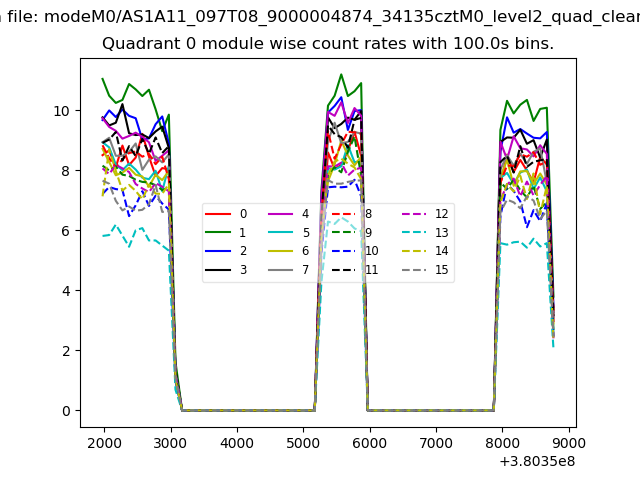
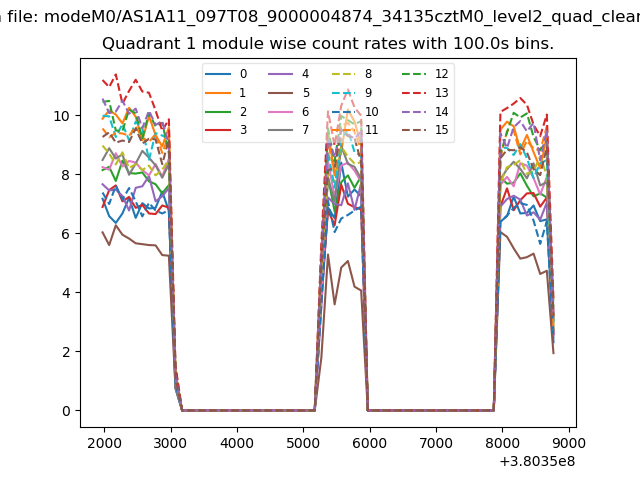
| Module-wise count rates for Quadrant A Data is divided into 100 sec bins |
 |
 |
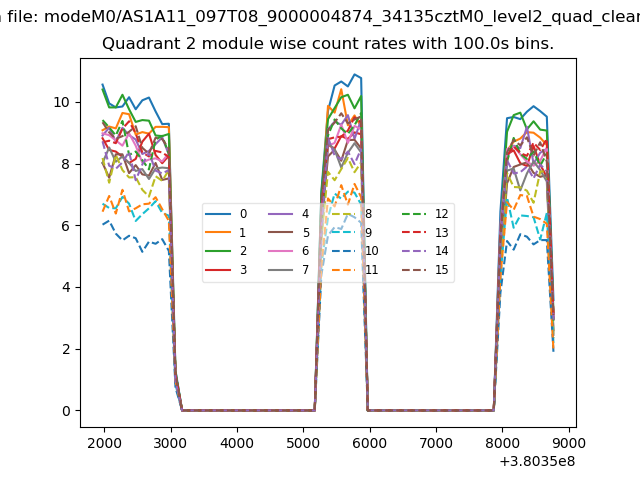
| Module-wise count rates for Quadrant B Data is divided into 100 sec bins |
 |
 |
| Module-wise count rates for Quadrant C Data is divided into 100 sec bins |
 |
 |
| Module-wise count rates for Quadrant D Data is divided into 100 sec bins |
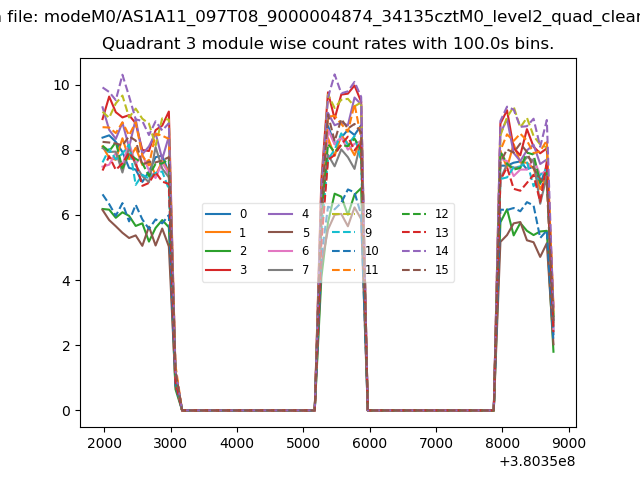 |
 |
| Parameter | Plot |
|---|---|
| CZT HV Monitor | 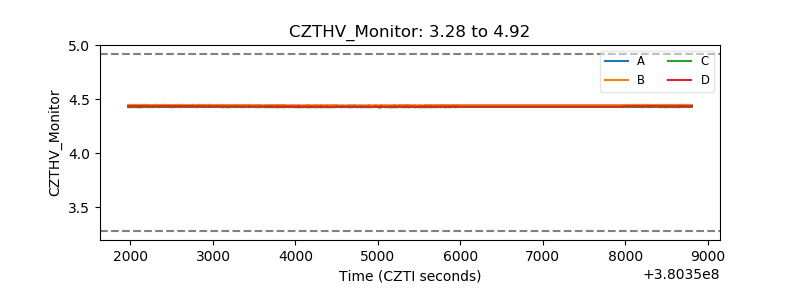 |
| D_VDD | 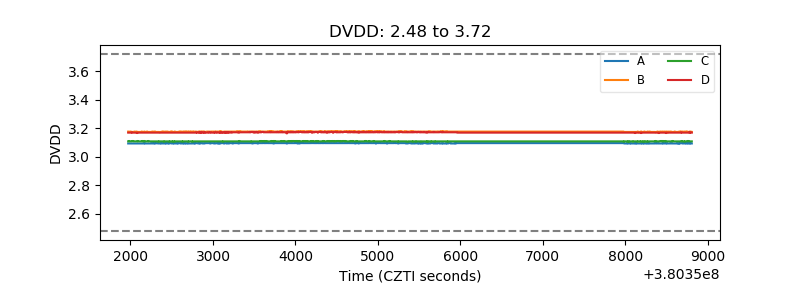 |
| Temperature 1 | 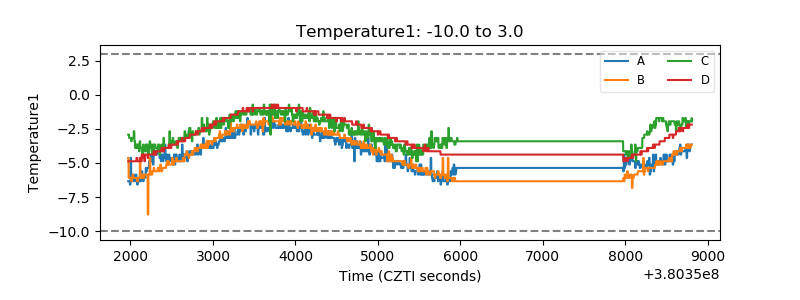 |
| Veto HV Monitor | 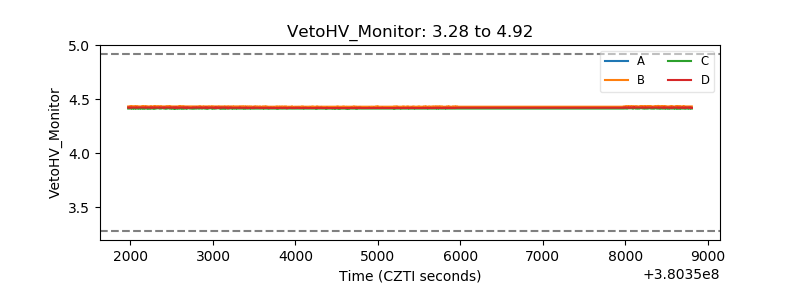 |
| Veto LLD | 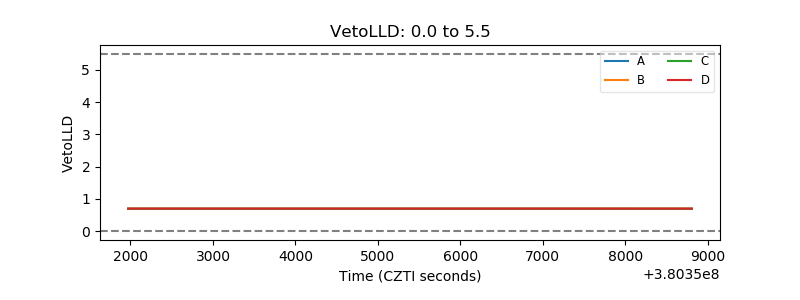 |
| Alpha Counter | 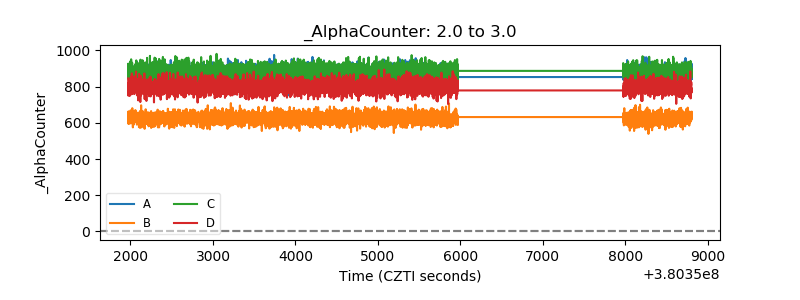 |
| _CPM_Rate | 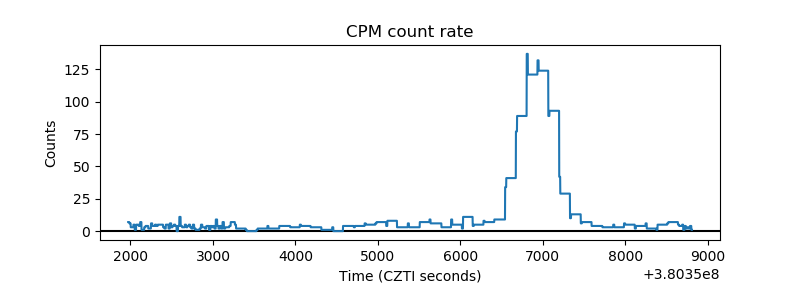 |
| CZT Counter | 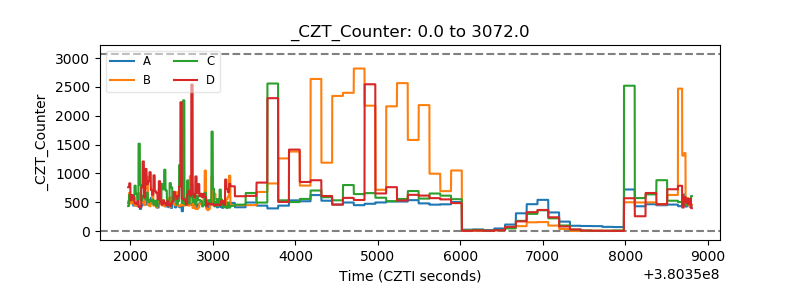 |
| +2.5 Volts monitor | 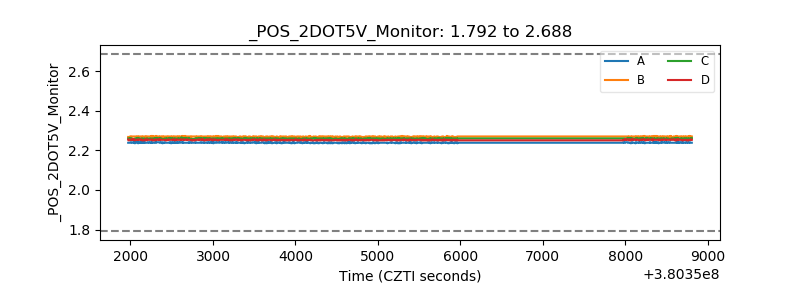 |
| +5 Volts monitor | 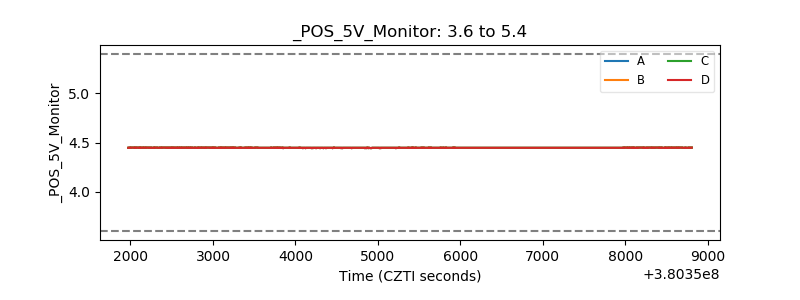 |
| _ROLL_ROT | 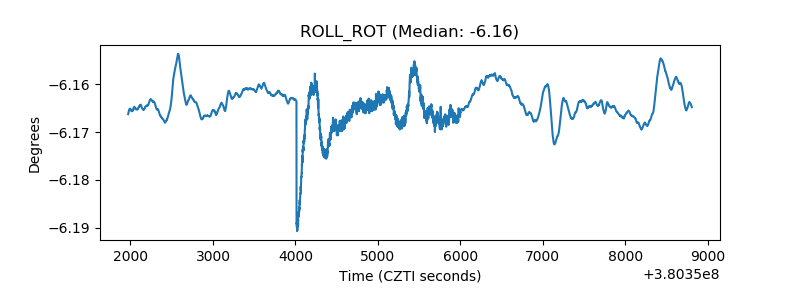 |
| _Roll_DEC | 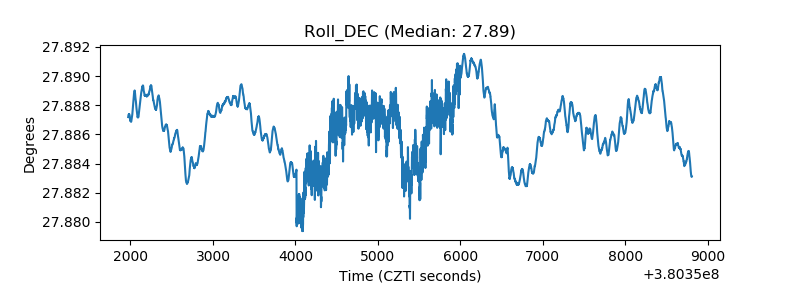 |
| _Roll_RA | 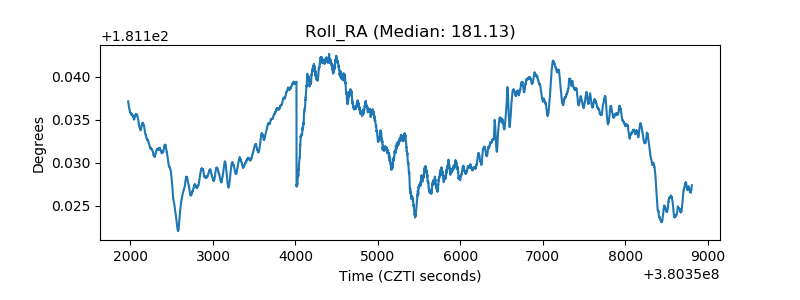 |
| Veto Counter | 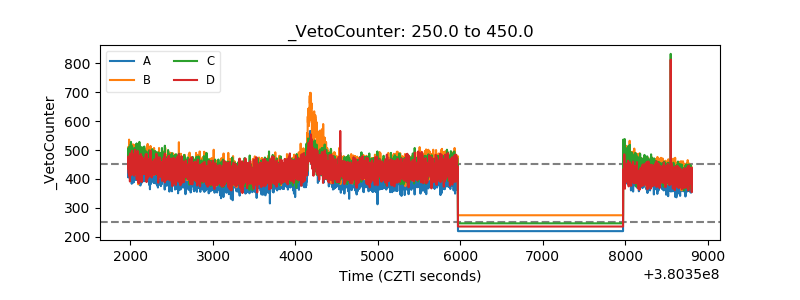 |