| Param | Original file | Final file |
|---|---|---|
| Filename | modeM0/AS1A11_097T08_9000004874_34136cztM0_level2.evt | modeM0/AS1A11_097T08_9000004874_34136cztM0_level2_quad_clean.evt |
| Size (bytes) | 441,383,040 | 61,297,920 |
| Size | 420.9 MB | 58.5 MB |
| Events in quadrant A | 2,553,613 | 374,629 |
| Events in quadrant B | 3,271,268 | 380,946 |
| Events in quadrant C | 3,248,142 | 366,988 |
| Events in quadrant D | 3,924,438 | 351,798 |
| Mode M9 | |||
|---|---|---|---|
| Quadrant | BADHDUFLAG | Total packets | Discarded packets |
| A | 0 | 17 | 0 |
| B | 0 | 17 | 0 |
| C | 0 | 17 | 0 |
| D | 0 | 17 | 0 |
| Mode M0 | |||
|---|---|---|---|
| Quadrant | BADHDUFLAG | Total packets | Discarded packets |
| A | 0 | 11011 | 3 |
| B | 0 | 13053 | 2 |
| C | 0 | 12696 | 2 |
| D | 0 | 15295 | 2 |
| Mode SS | |||
|---|---|---|---|
| Quadrant | BADHDUFLAG | Total packets | Discarded packets |
| A | 0 | 110 | 0 |
| B | 0 | 110 | 0 |
| C | 0 | 110 | 0 |
| D | 0 | 110 | 0 |
| Quadrant | Total seconds | Saturated seconds | Saturation percentage |
|---|---|---|---|
| A | 5452 | 5 | 0.091709% |
| B | 5452 | 86 | 1.577403% |
| C | 5452 | 113 | 2.072634% |
| D | 5453 | 69 | 1.265359% |
Noise dominated data is calculated using 1-second bins in cleaned event files. If a bin has >2000 counts, and if more than 50% of those come from <1% of pixels, then it is considered to be noise-dominated and hence unusable.
| Quadrant | # 1 sec bins | Bins with >0 counts | Bins with >2000 counts | High rate bins dominated by noise | Noise dominated (total time) | Noise dominated (detector-on time) | Marked lightcurve |
|---|---|---|---|---|---|---|---|
| A | 7125 | 5453 | 0 | 0 | 0.00% | 0.00% | 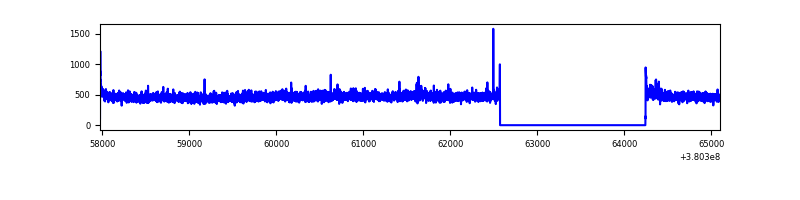 |
| B | 7125 | 5453 | 74 | 74 | 1.04% | 1.36% | 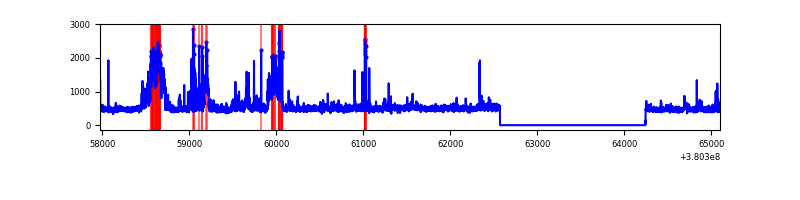 |
| C | 7125 | 5453 | 88 | 88 | 1.24% | 1.61% | 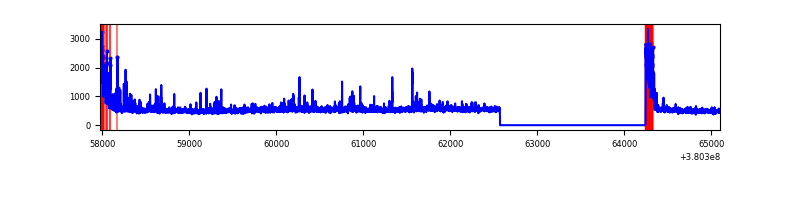 |
| D | 7126 | 5454 | 64 | 64 | 0.90% | 1.17% | 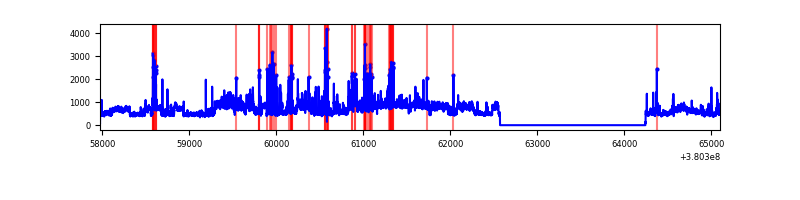 |
Top three noisy pixels from each quadrant. If the there are fewer than three noisy pixels in the level2.evt file, extra rows are filled as -1
| Pixel properties | Quadrant properties | ||||||
|---|---|---|---|---|---|---|---|
| Quadrant | DetID | PixID | Counts | Sigma | Mean | Median | Sigma |
| A | 10 | 83 | 20896 | 154.66 | 646 | 634 | 131.0 |
| A | 13 | 6 | 15756 | 115.42 | 646 | 634 | 131.0 |
| A | 15 | 169 | 15181 | 111.03 | 646 | 634 | 131.0 |
| B | 5 | 31 | 274234 | 2193.45 | 640 | 623 | 124.7 |
| B | 5 | 172 | 168764 | 1347.93 | 640 | 623 | 124.7 |
| B | 5 | 15 | 160695 | 1283.25 | 640 | 623 | 124.7 |
| C | 0 | 10 | 557065 | 3884.49 | 619 | 624 | 143.2 |
| C | 15 | 214 | 238119 | 1657.94 | 619 | 624 | 143.2 |
| C | 14 | 67 | 20916 | 141.66 | 619 | 624 | 143.2 |
| D | 8 | 195 | 881238 | 5690.87 | 626 | 607 | 154.7 |
| D | 7 | 80 | 107589 | 691.35 | 626 | 607 | 154.7 |
| D | 12 | 218 | 89943 | 577.31 | 626 | 607 | 154.7 |
Histogram calculated using DETX and DETY for each event in the final _common_clean file
| Quadrant A | 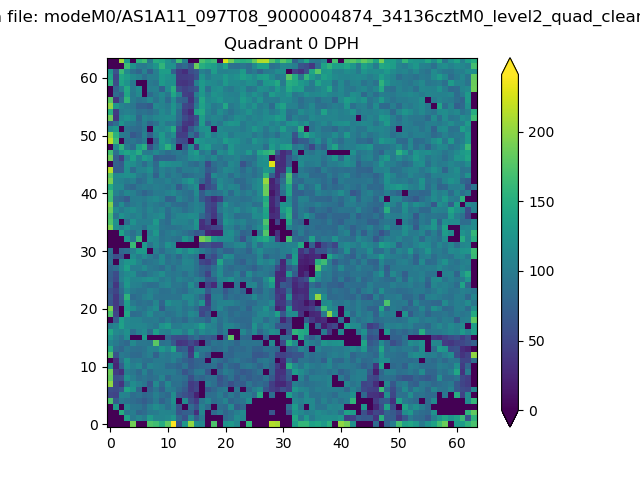 |
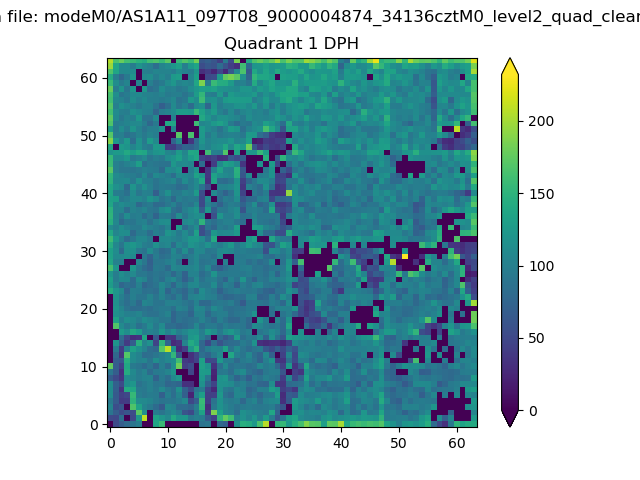 |
Quadrant B |
|---|---|---|---|
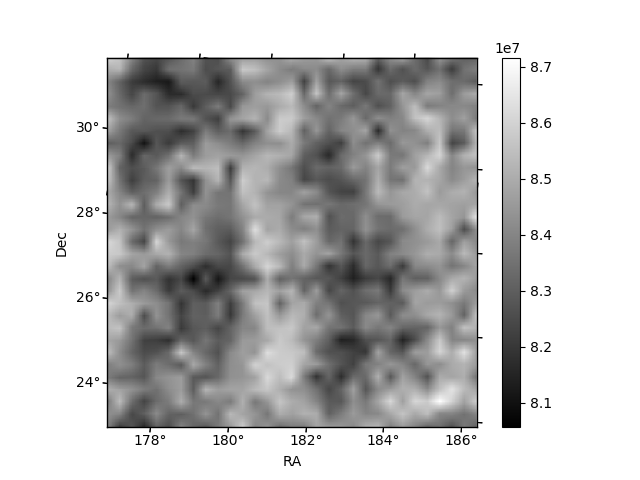
| Quadrant D | 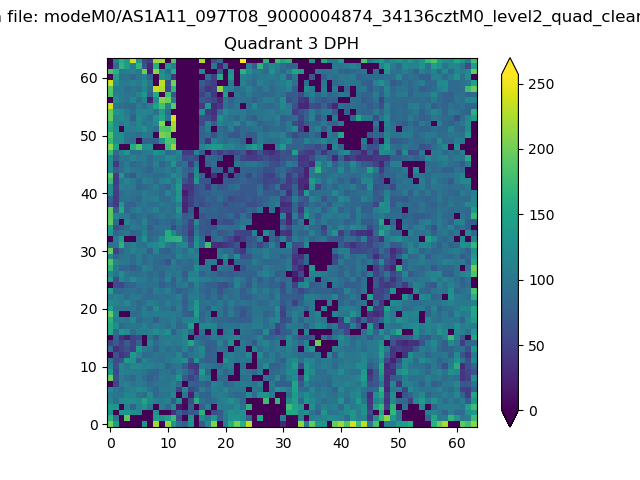 |
 |
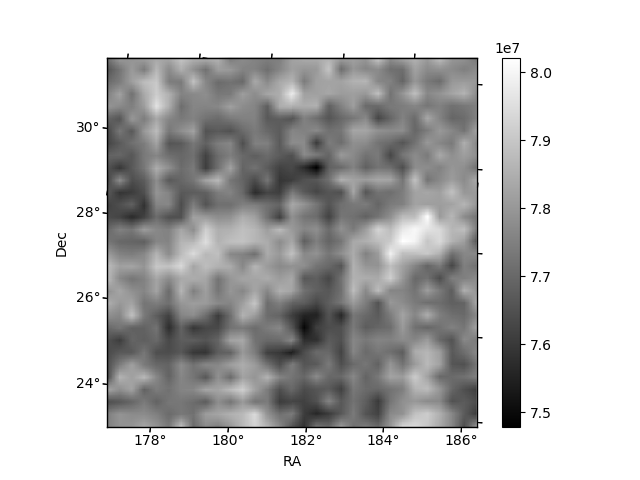
Quadrant C |
| Plot type | Count rate plots | Images |
|---|---|---|
| Comparison with Poisson distribution Blue bars denote a histogram of data divided into 1 sec bins. Red curve is a Poisson curve with rate = median count rate of data. |
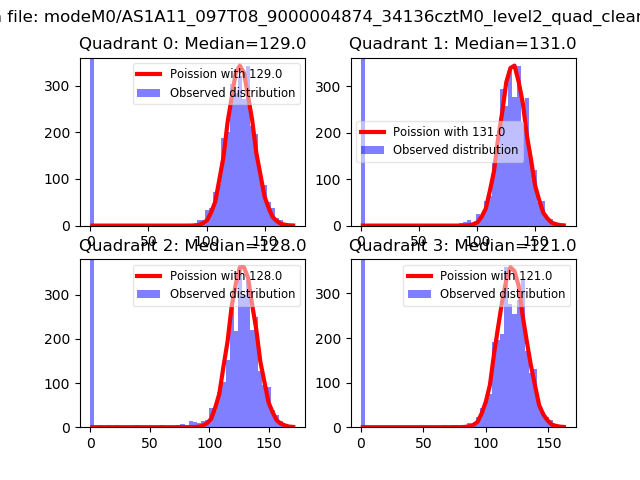 |
 |
| Quadrant-wise count rates Data is divided into 100 sec bins |
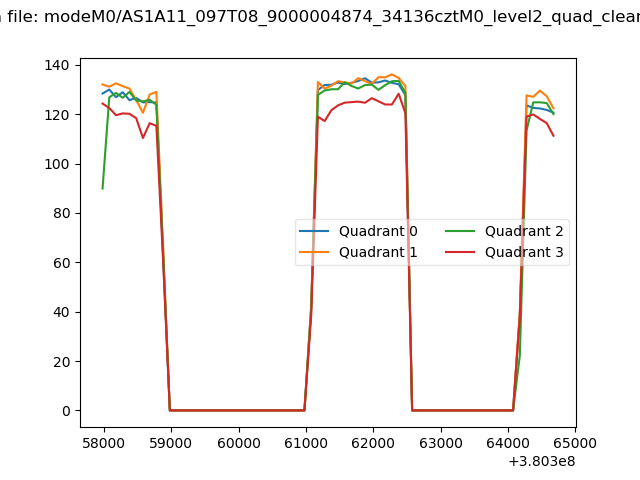 |
|
| Module-wise count rates for Quadrant A Data is divided into 100 sec bins |
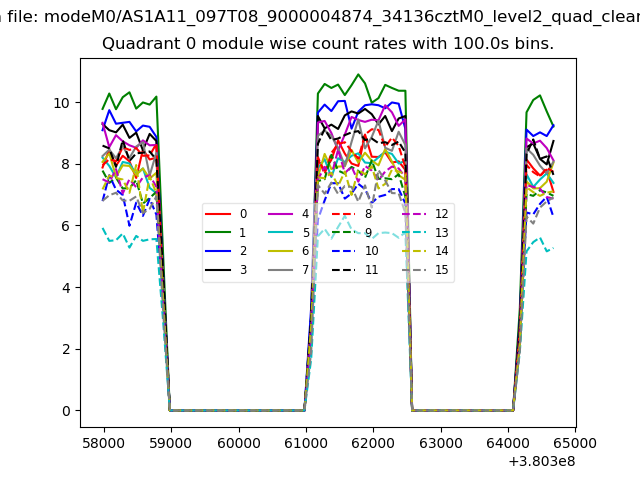 |
 |
| Module-wise count rates for Quadrant B Data is divided into 100 sec bins |
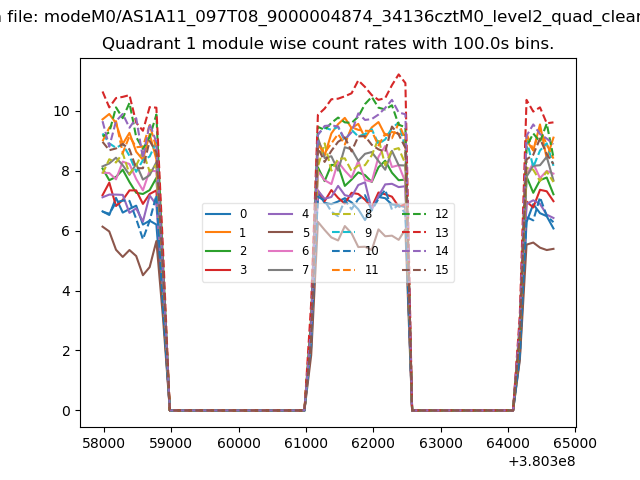 |
 |
| Module-wise count rates for Quadrant C Data is divided into 100 sec bins |
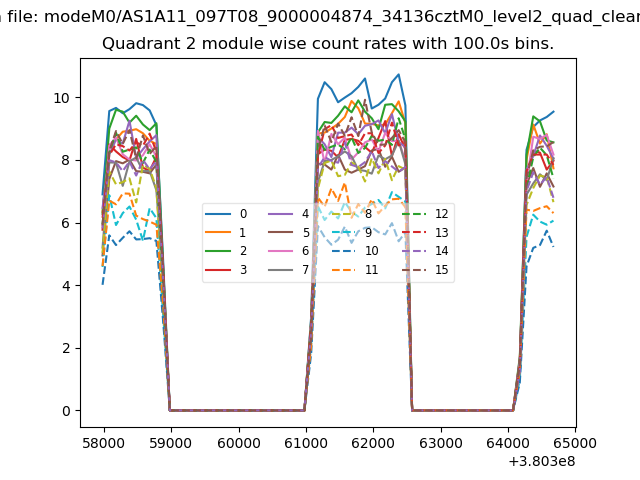 |
 |
| Module-wise count rates for Quadrant D Data is divided into 100 sec bins |
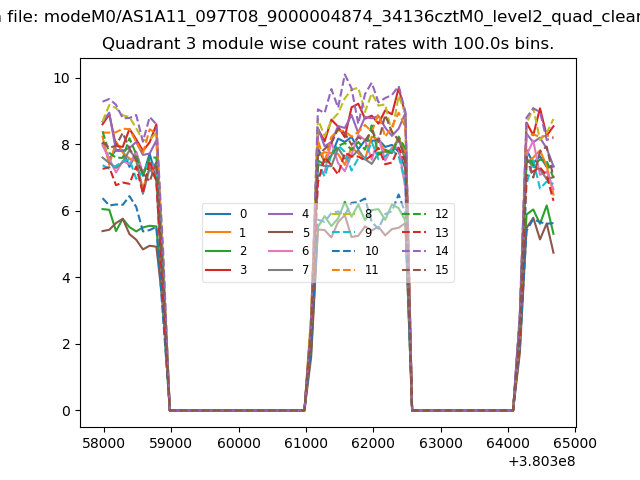 |
 |
| Parameter | Plot |
|---|---|
| CZT HV Monitor | 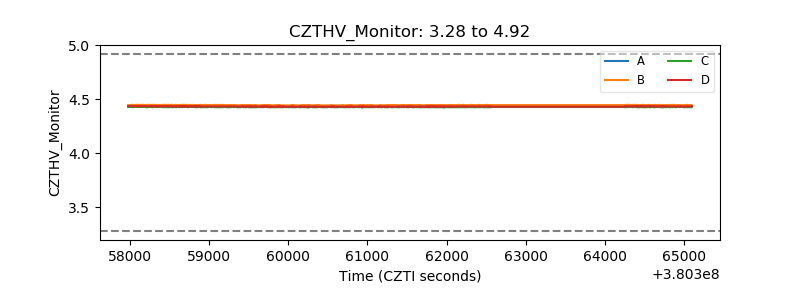 |
| D_VDD | 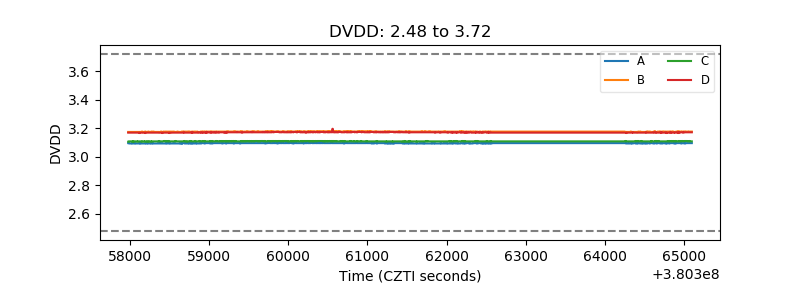 |
| Temperature 1 | 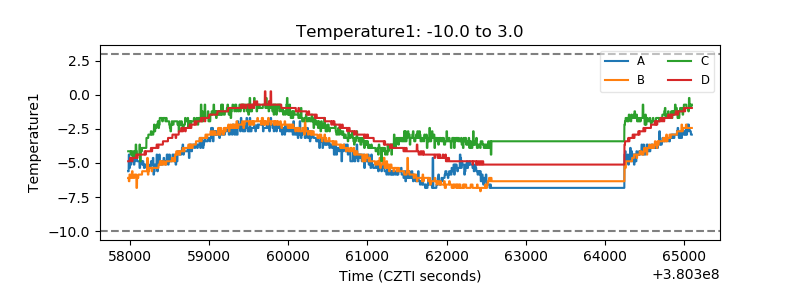 |
| Veto HV Monitor | 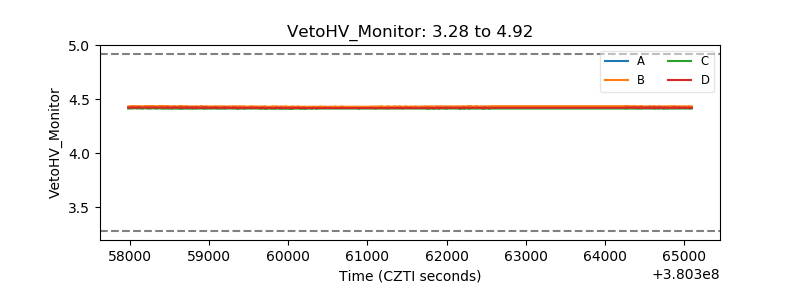 |
| Veto LLD | 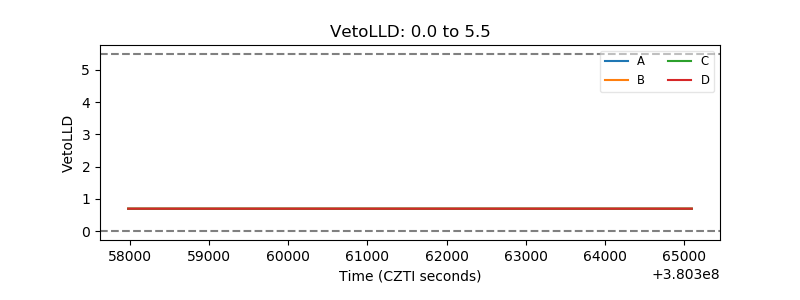 |
| Alpha Counter | 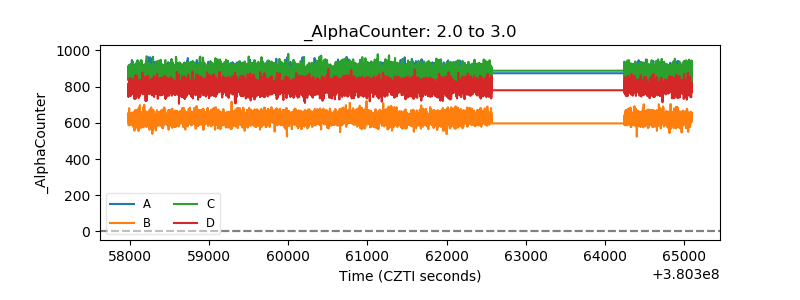 |
| _CPM_Rate | 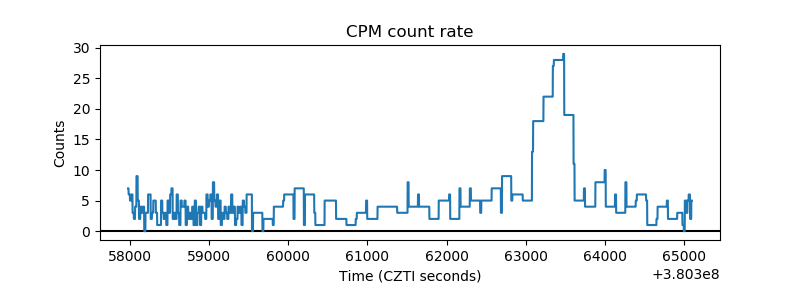 |
| CZT Counter |  |
| +2.5 Volts monitor |  |
| +5 Volts monitor |  |
| _ROLL_ROT | 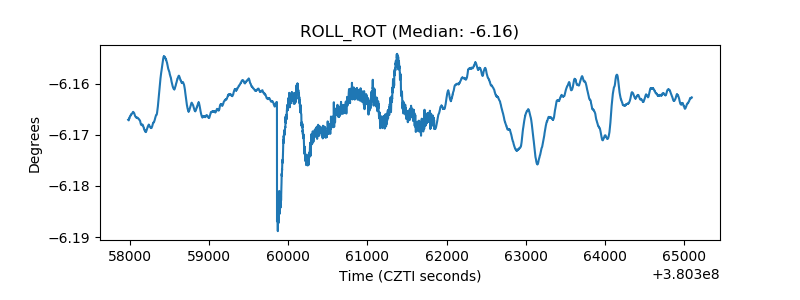 |
| _Roll_DEC | 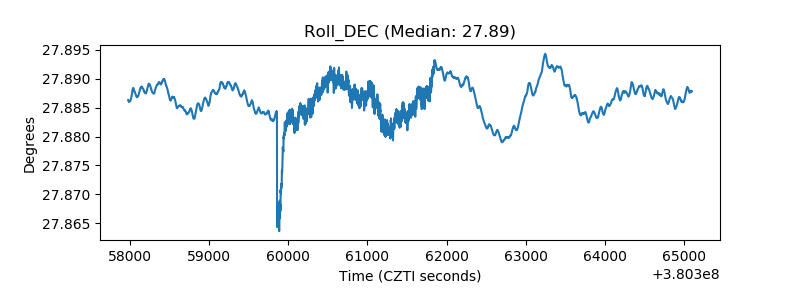 |
| _Roll_RA | 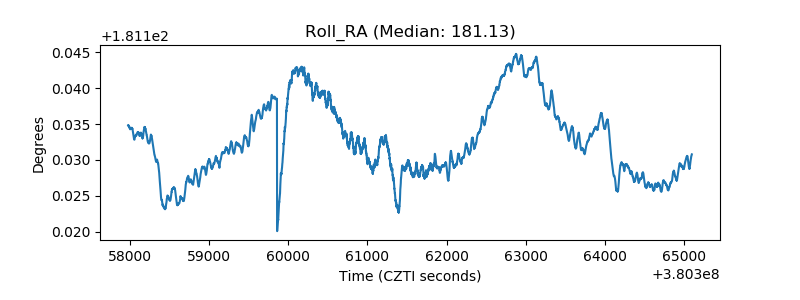 |
| Veto Counter | 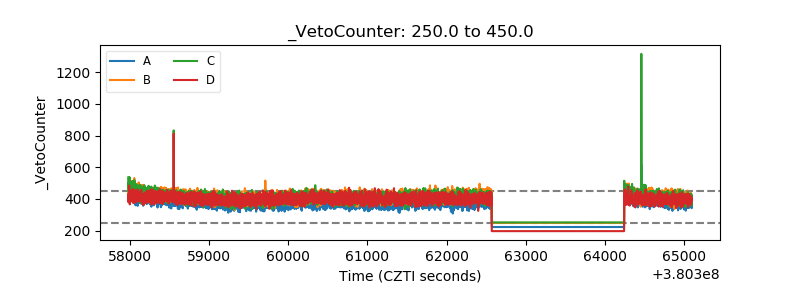 |