| Param | Original file | Final file |
|---|---|---|
| Filename | modeM0/AS1T04_093T01_9000004872cztM0_level2.fits | modeM0/AS1T04_093T01_9000004872cztM0_level2_quad_clean.evt |
| Size (bytes) | 199,647,360 | 202,368,960 |
| Size | 190.4 MB | 193.0 MB |
| Events in quadrant A | 1,238,516 | 1,249,253 |
| Events in quadrant B | 1,135,194 | 1,177,176 |
| Events in quadrant C | 1,164,034 | 1,139,948 |
| Events in quadrant D | 1,011,814 | 1,066,158 |
| Mode M0 | |||
|---|---|---|---|
| Quadrant | BADHDUFLAG | Total packets | Discarded packets |
| A | 0 | 43890 | 0 |
| B | 0 | 60523 | 0 |
| C | 0 | 59428 | 0 |
| D | 0 | 66619 | 0 |
| Mode SS | |||
|---|---|---|---|
| Quadrant | BADHDUFLAG | Total packets | Discarded packets |
| A | 0 | 442 | 0 |
| B | 0 | 442 | 0 |
| C | 0 | 442 | 0 |
| D | 0 | 442 | 0 |
| Mode M9 | |||
|---|---|---|---|
| Quadrant | BADHDUFLAG | Total packets | Discarded packets |
| A | 0 | 72 | 0 |
| B | 0 | 72 | 0 |
| C | 0 | 72 | 0 |
| D | 0 | 72 | 0 |
| Quadrant | Total seconds | Saturated seconds | Saturation percentage |
|---|---|---|---|
| A | 21728 | 29 | 0.133468% |
| B | 21727 | 1600 | 7.364109% |
| C | 21728 | 1204 | 5.541237% |
| D | 21728 | 863 | 3.971834% |
Noise dominated data is calculated using 1-second bins in cleaned event files. If a bin has >2000 counts, and if more than 50% of those come from <1% of pixels, then it is considered to be noise-dominated and hence unusable.
| Quadrant | # 1 sec bins | Bins with >0 counts | Bins with >2000 counts | High rate bins dominated by noise | Noise dominated (total time) | Noise dominated (detector-on time) | Marked lightcurve |
|---|---|---|---|---|---|---|---|
| A | 27458 | 21727 | 0 | 0 | 0.00% | 0.00% |  |
| B | 27458 | 21715 | 0 | 0 | 0.00% | 0.00% |  |
| C | 27458 | 21699 | 0 | 0 | 0.00% | 0.00% |  |
| D | 27458 | 21685 | 0 | 0 | 0.00% | 0.00% |  |
Top three noisy pixels from each quadrant. If the there are fewer than three noisy pixels in the level2.evt file, extra rows are filled as -1
| Pixel properties | Quadrant properties | ||||||
|---|---|---|---|---|---|---|---|
| Quadrant | DetID | PixID | Counts | Sigma | Mean | Median | Sigma |
| A | 7 | 110 | 1027 | 8.68 | 323 | 302 | 83.6 |
| A | 9 | 19 | 997 | 8.32 | 323 | 302 | 83.6 |
| A | 0 | 29 | 977 | 8.08 | 323 | 302 | 83.6 |
| B | 2 | 9 | 1011 | 11.83 | 300 | 286 | 61.3 |
| B | 3 | 80 | 919 | 10.33 | 300 | 286 | 61.3 |
| B | 2 | 8 | 786 | 8.16 | 300 | 286 | 61.3 |
| C | 3 | 202 | 946 | 8.26 | 307 | 288 | 79.7 |
| C | 1 | 81 | 942 | 8.21 | 307 | 288 | 79.7 |
| C | 3 | 203 | 930 | 8.06 | 307 | 288 | 79.7 |
| D | 7 | 3 | 774 | 6.47 | 289 | 264 | 78.8 |
| D | 11 | 66 | 740 | 6.04 | 289 | 264 | 78.8 |
| D | 4 | 160 | 740 | 6.04 | 289 | 264 | 78.8 |
Histogram calculated using DETX and DETY for each event in the final _common_clean file
| Quadrant A | 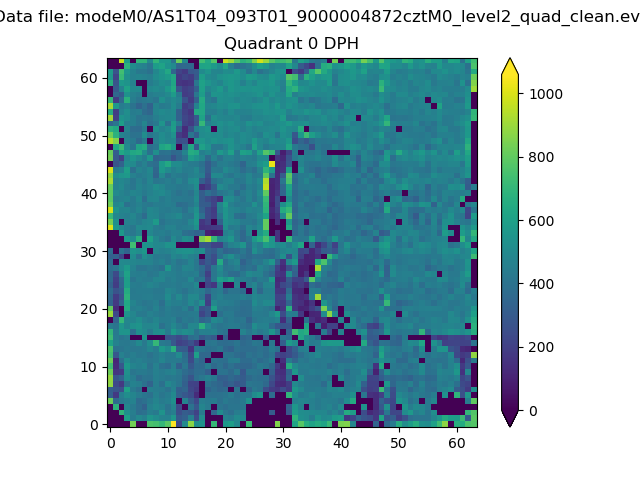 |
 |
Quadrant B |
|---|---|---|---|
| Quadrant D |  |
 |
Quadrant C |
| Plot type | Count rate plots | Images |
|---|---|---|
| Comparison with Poisson distribution Blue bars denote a histogram of data divided into 1 sec bins. Red curve is a Poisson curve with rate = median count rate of data. |
 |
 |
| Quadrant-wise count rates Data is divided into 100 sec bins |
 |
|
| Module-wise count rates for Quadrant A Data is divided into 100 sec bins |
 |
 |
| Module-wise count rates for Quadrant B Data is divided into 100 sec bins |
 |
 |
| Module-wise count rates for Quadrant C Data is divided into 100 sec bins |
 |
 |
| Module-wise count rates for Quadrant D Data is divided into 100 sec bins |
 |
 |
| Parameter | Plot |
|---|---|
| CZT HV Monitor |  |
| D_VDD | 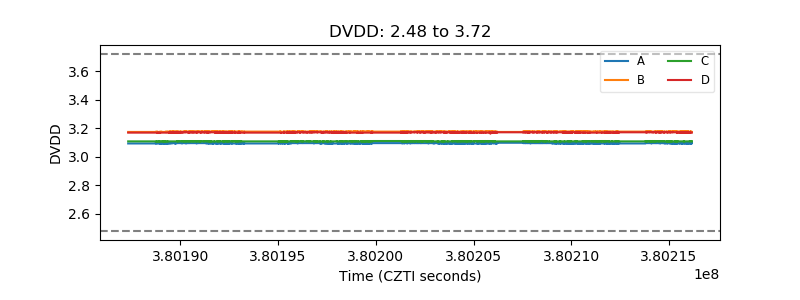 |
| Temperature 1 | 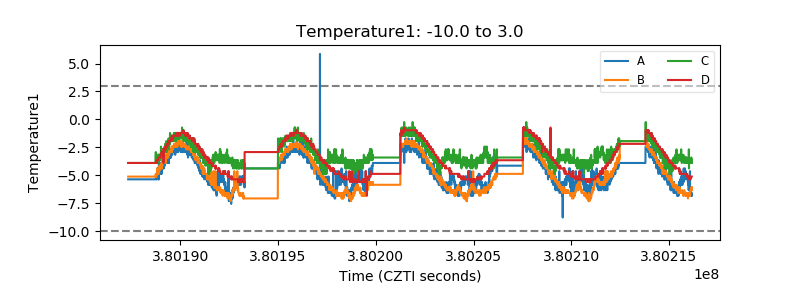 |
| Veto HV Monitor |  |
| Veto LLD |  |
| Alpha Counter |  |
| _CPM_Rate |  |
| CZT Counter |  |
| +2.5 Volts monitor |  |
| +5 Volts monitor |  |
| _ROLL_ROT |  |
| _Roll_DEC |  |
| _Roll_RA | 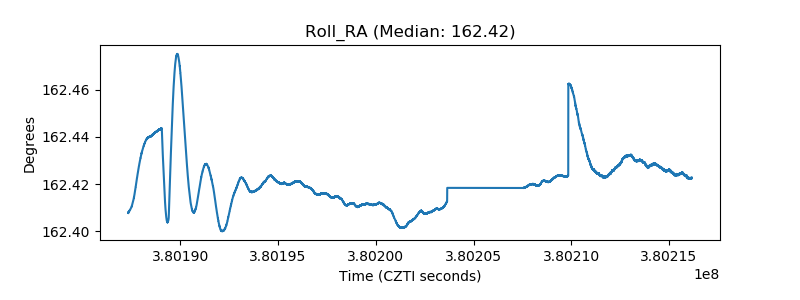 |
| Veto Counter |  |