| Param | Original file | Final file |
|---|---|---|
| Filename | modeM0/AS1T04_093T01_9000004872_34106cztM0_level2.evt | modeM0/AS1T04_093T01_9000004872_34106cztM0_level2_quad_clean.evt |
| Size (bytes) | 85,737,600 | 10,091,520 |
| Size | 81.8 MB | 9.6 MB |
| Events in quadrant A | 398,838 | 62,978 |
| Events in quadrant B | 795,219 | 59,502 |
| Events in quadrant C | 768,867 | 57,491 |
| Events in quadrant D | 574,299 | 59,683 |
| Mode M0 | |||
|---|---|---|---|
| Quadrant | BADHDUFLAG | Total packets | Discarded packets |
| A | 0 | 1673 | 2 |
| B | 0 | 2906 | 1 |
| C | 0 | 2828 | 1 |
| D | 0 | 2243 | 1 |
| Mode SS | |||
|---|---|---|---|
| Quadrant | BADHDUFLAG | Total packets | Discarded packets |
| A | 0 | 18 | 0 |
| B | 0 | 18 | 0 |
| C | 0 | 18 | 0 |
| D | 0 | 18 | 0 |
| Mode M9 | |||
|---|---|---|---|
| Quadrant | BADHDUFLAG | Total packets | Discarded packets |
| A | 0 | 14 | 0 |
| B | 0 | 14 | 0 |
| C | 0 | 14 | 0 |
| D | 0 | 14 | 0 |
| Quadrant | Total seconds | Saturated seconds | Saturation percentage |
|---|---|---|---|
| A | 824 | 2 | 0.242718% |
| B | 824 | 133 | 16.140777% |
| C | 824 | 97 | 11.771845% |
| D | 824 | 19 | 2.305825% |
Noise dominated data is calculated using 1-second bins in cleaned event files. If a bin has >2000 counts, and if more than 50% of those come from <1% of pixels, then it is considered to be noise-dominated and hence unusable.
| Quadrant | # 1 sec bins | Bins with >0 counts | Bins with >2000 counts | High rate bins dominated by noise | Noise dominated (total time) | Noise dominated (detector-on time) | Marked lightcurve |
|---|---|---|---|---|---|---|---|
| A | 824 | 824 | 0 | 0 | 0.00% | 0.00% | 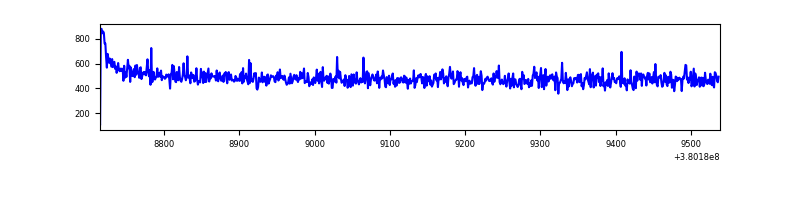 |
| B | 824 | 824 | 103 | 103 | 12.50% | 12.50% | 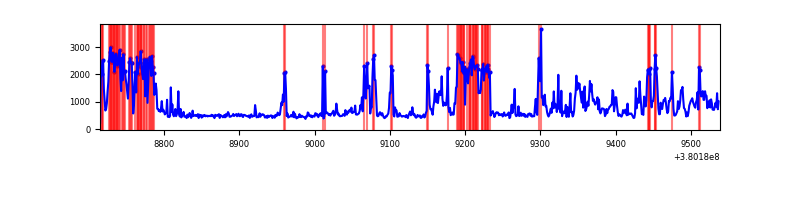 |
| C | 824 | 824 | 82 | 82 | 9.95% | 9.95% | 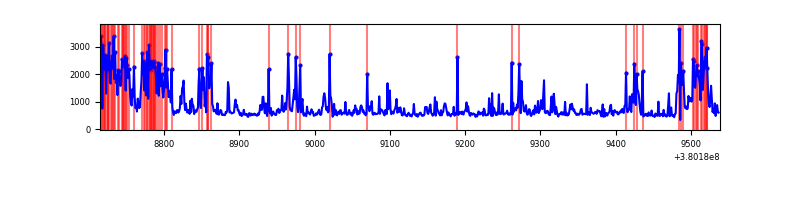 |
| D | 824 | 824 | 8 | 8 | 0.97% | 0.97% | 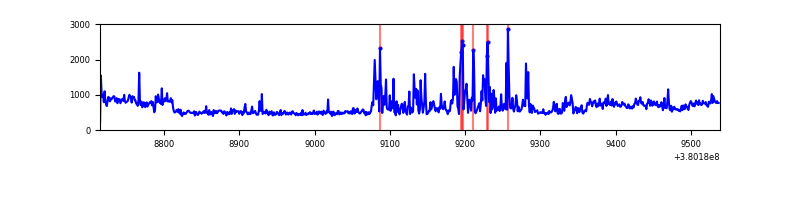 |
Top three noisy pixels from each quadrant. If the there are fewer than three noisy pixels in the level2.evt file, extra rows are filled as -1
| Pixel properties | Quadrant properties | ||||||
|---|---|---|---|---|---|---|---|
| Quadrant | DetID | PixID | Counts | Sigma | Mean | Median | Sigma |
| A | 10 | 83 | 8700 | 392.38 | 100 | 98 | 21.9 |
| A | 13 | 6 | 2298 | 100.35 | 100 | 98 | 21.9 |
| A | 13 | 254 | 1596 | 68.33 | 100 | 98 | 21.9 |
| B | 5 | 172 | 425971 | 21094.72 | 92 | 90 | 20.2 |
| B | 12 | 111 | 2153 | 102.18 | 92 | 90 | 20.2 |
| B | 11 | 111 | 2078 | 98.47 | 92 | 90 | 20.2 |
| C | 0 | 10 | 209827 | 9383.11 | 89 | 88 | 22.4 |
| C | 14 | 254 | 93688 | 4187.39 | 89 | 88 | 22.4 |
| C | 0 | 239 | 76954 | 3438.76 | 89 | 88 | 22.4 |
| D | 8 | 195 | 96873 | 3886.13 | 95 | 91 | 24.9 |
| D | 2 | 250 | 68174 | 2733.77 | 95 | 91 | 24.9 |
| D | 12 | 6 | 23916 | 956.66 | 95 | 91 | 24.9 |
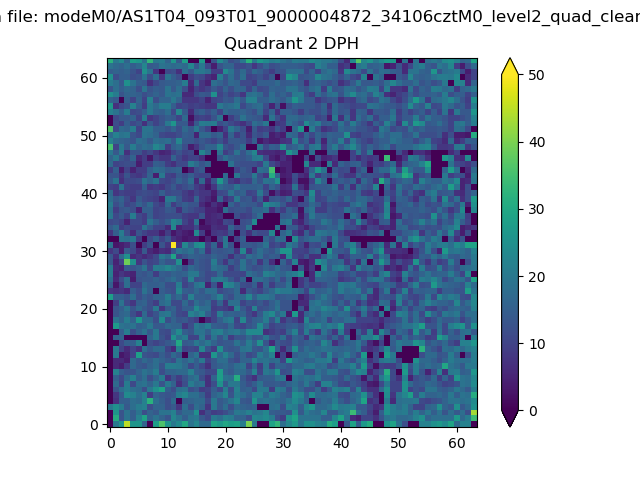
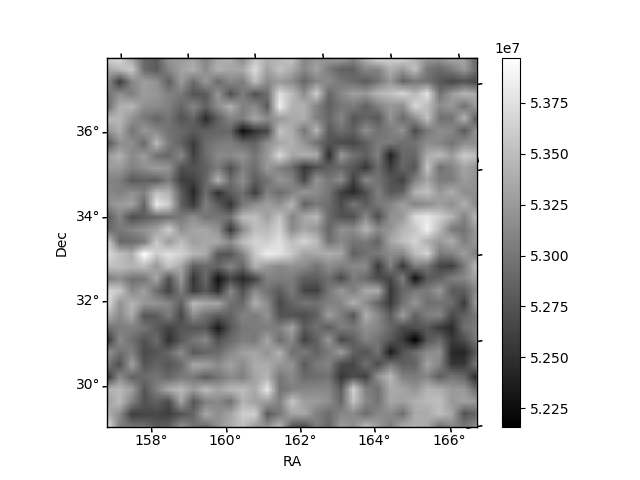
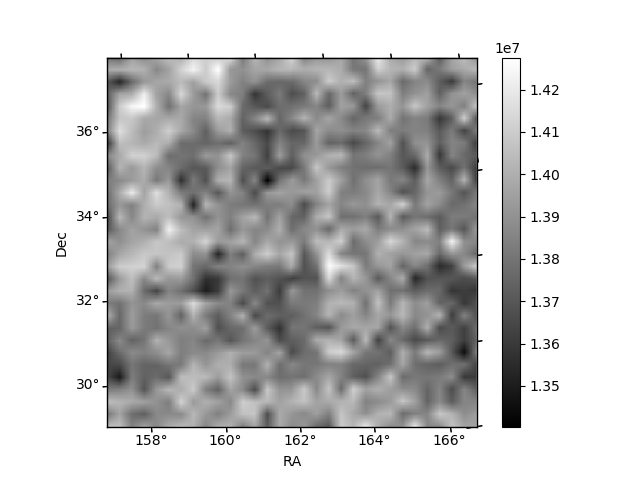
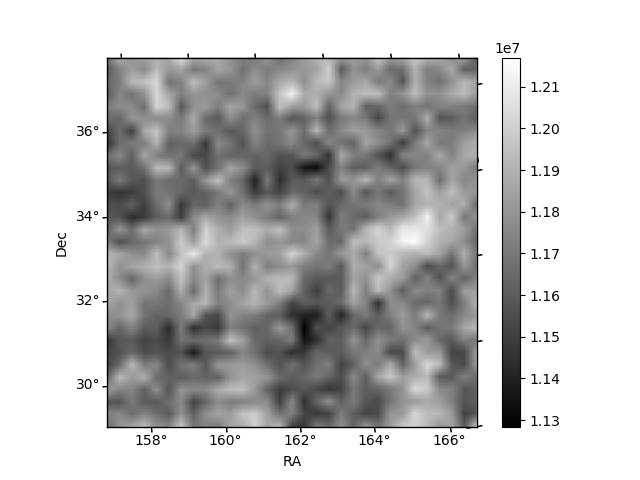
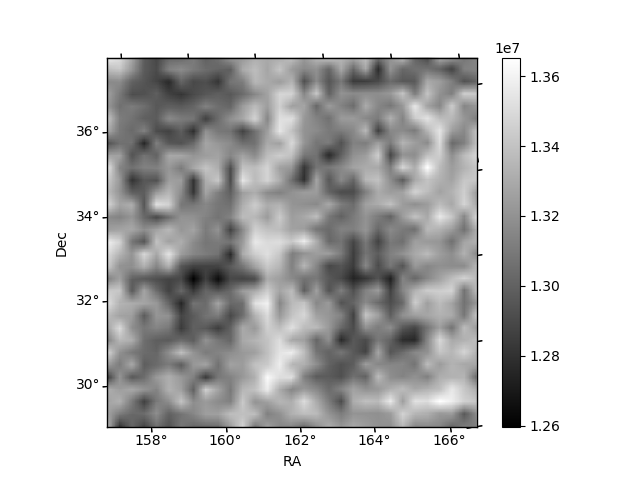
Histogram calculated using DETX and DETY for each event in the final _common_clean file
| Quadrant A | 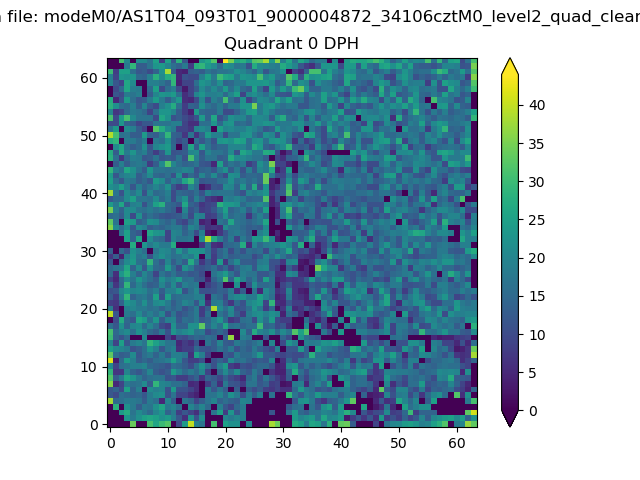 |
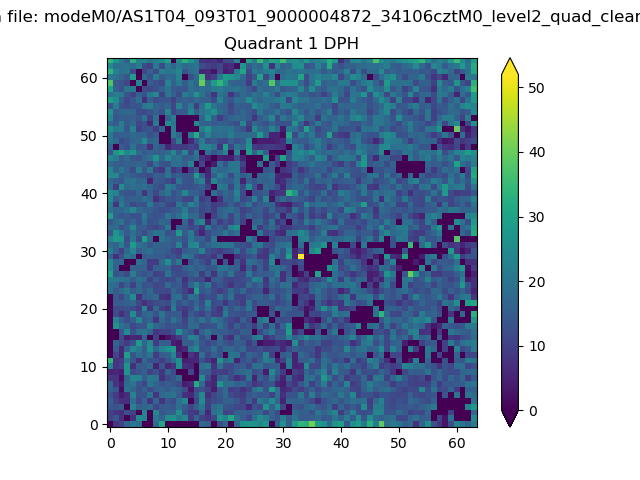 |
Quadrant B |
|---|---|---|---|
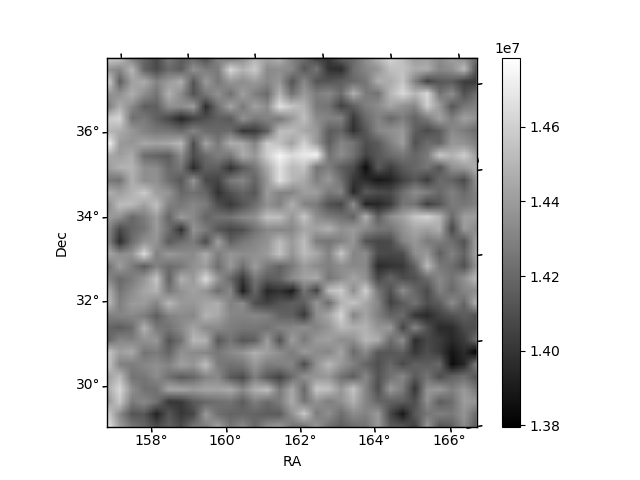
| Quadrant D | 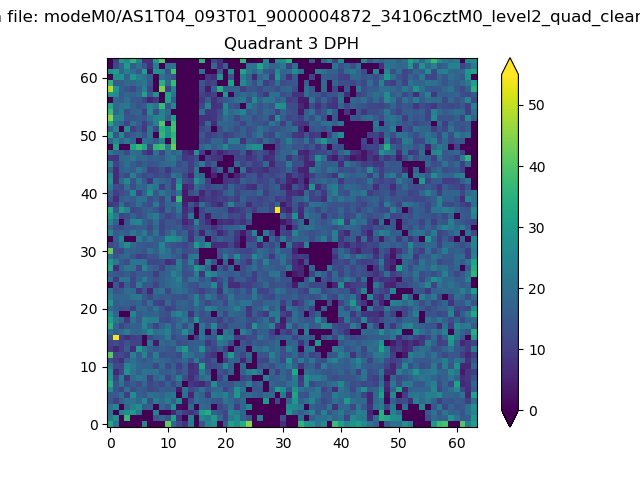 |
 |
Quadrant C |
| Plot type | Count rate plots | Images |
|---|---|---|
| Comparison with Poisson distribution Blue bars denote a histogram of data divided into 1 sec bins. Red curve is a Poisson curve with rate = median count rate of data. |
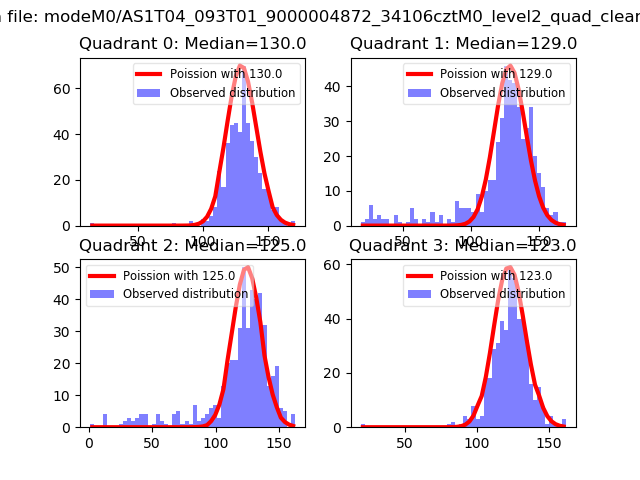 |
 |
| Quadrant-wise count rates Data is divided into 100 sec bins |
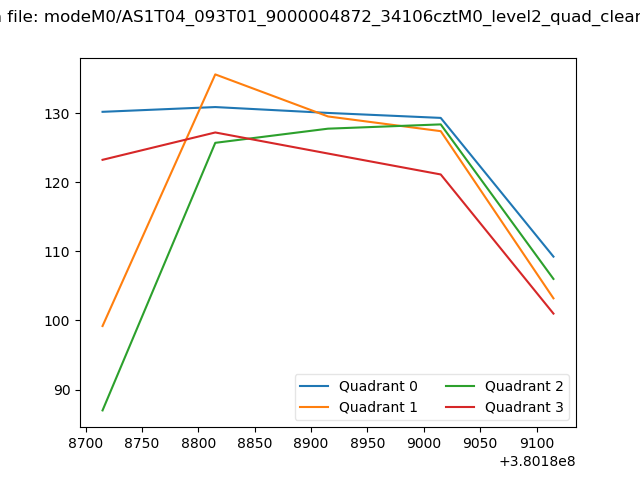 |
|
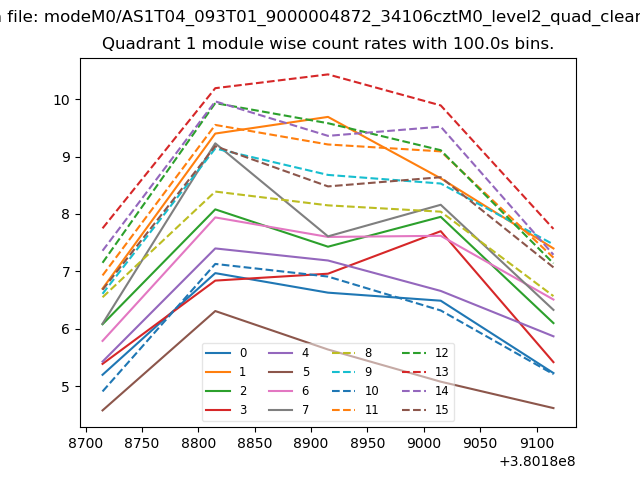
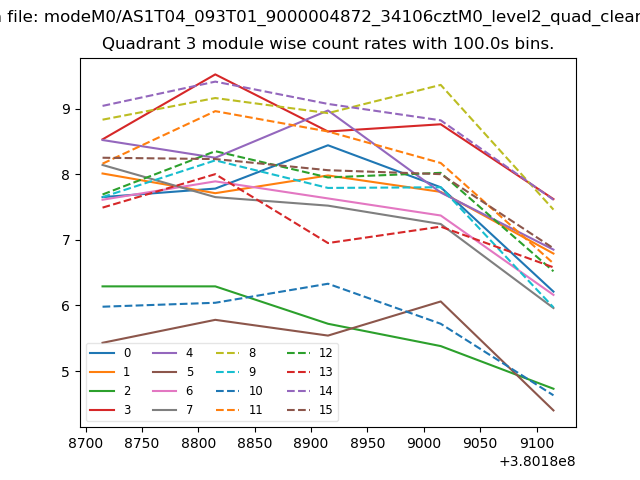
| Module-wise count rates for Quadrant A Data is divided into 100 sec bins |
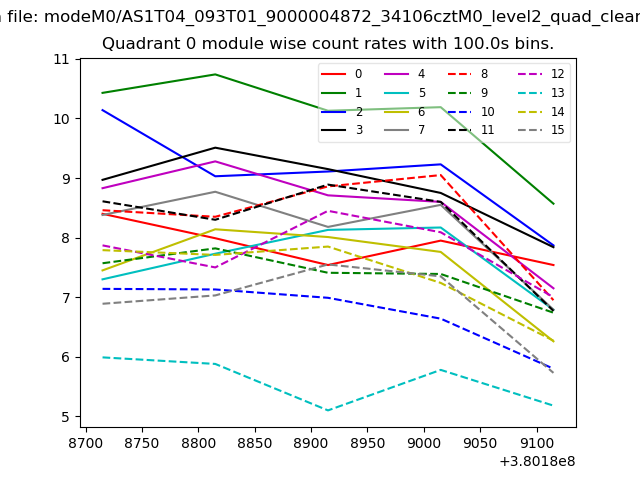 |
 |
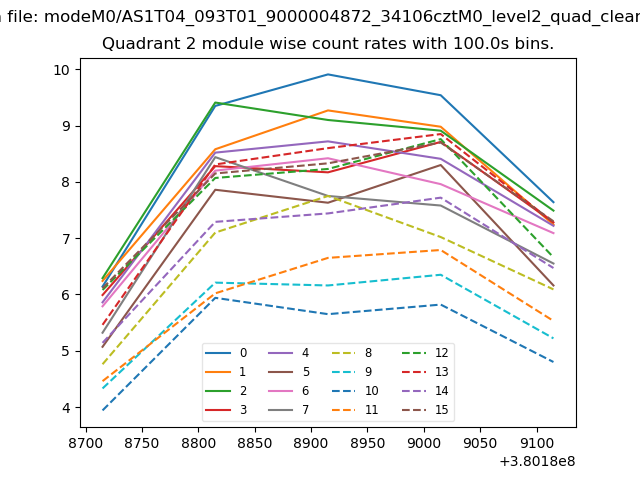
| Module-wise count rates for Quadrant B Data is divided into 100 sec bins |
 |
 |
| Module-wise count rates for Quadrant C Data is divided into 100 sec bins |
 |
 |
| Module-wise count rates for Quadrant D Data is divided into 100 sec bins |
 |
 |
| Parameter | Plot |
|---|---|
| CZT HV Monitor | 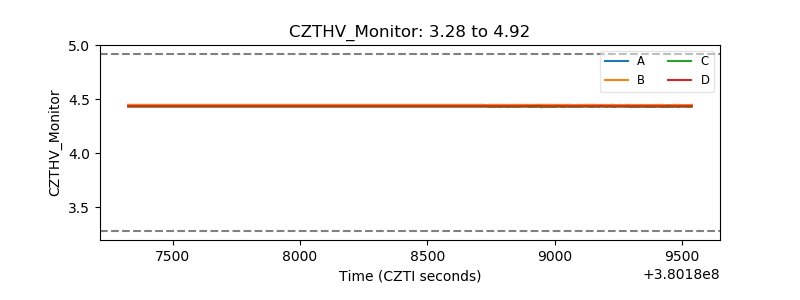 |
| D_VDD | 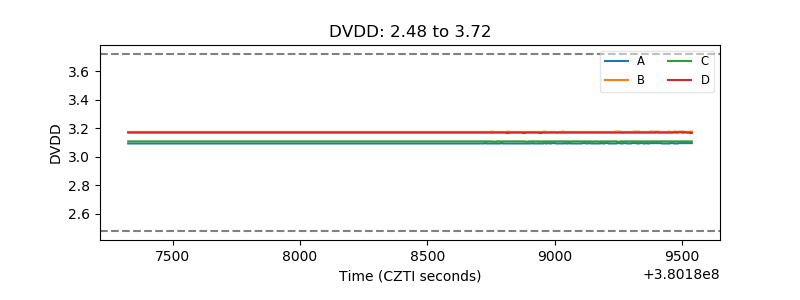 |
| Temperature 1 | 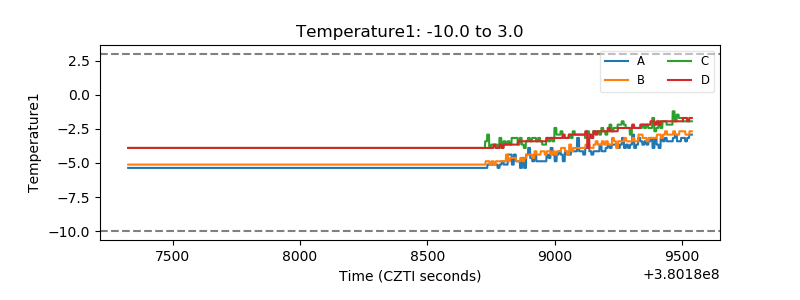 |
| Veto HV Monitor | 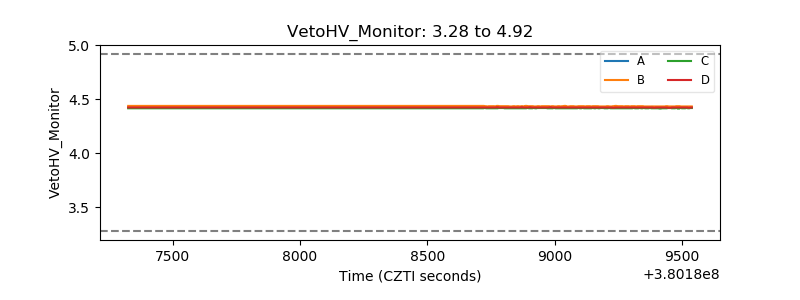 |
| Veto LLD | 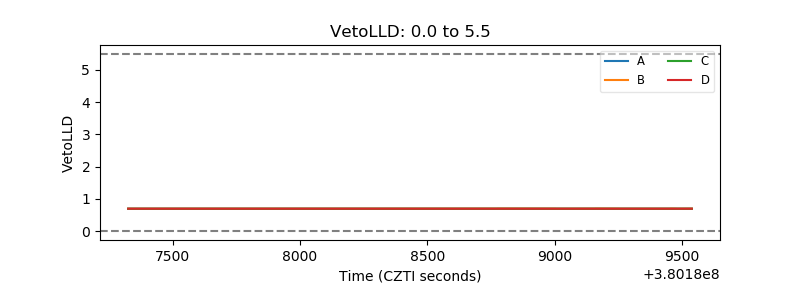 |
| Alpha Counter | 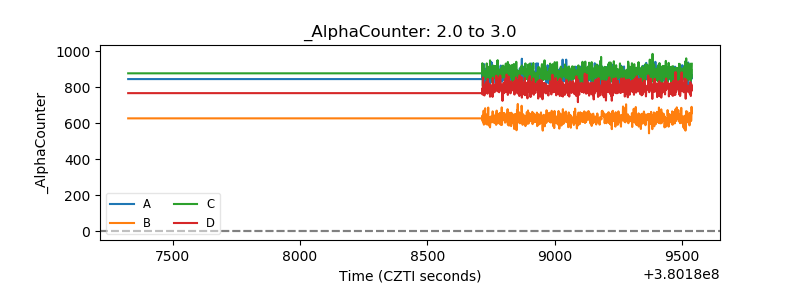 |
| _CPM_Rate | 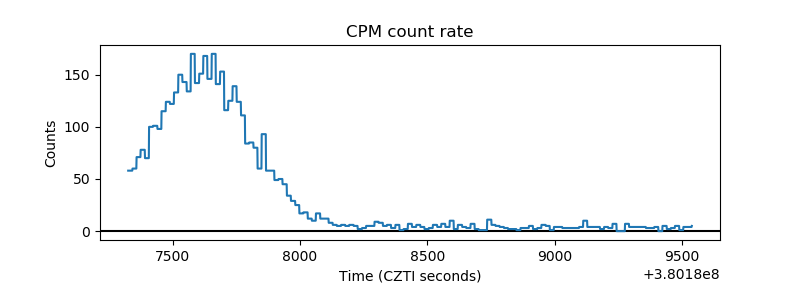 |
| CZT Counter | 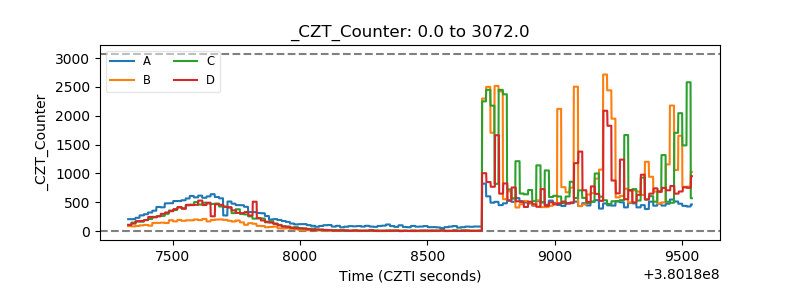 |
| +2.5 Volts monitor | 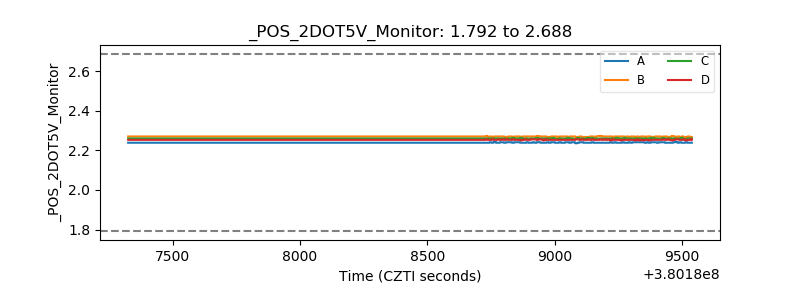 |
| +5 Volts monitor |  |
| _ROLL_ROT | 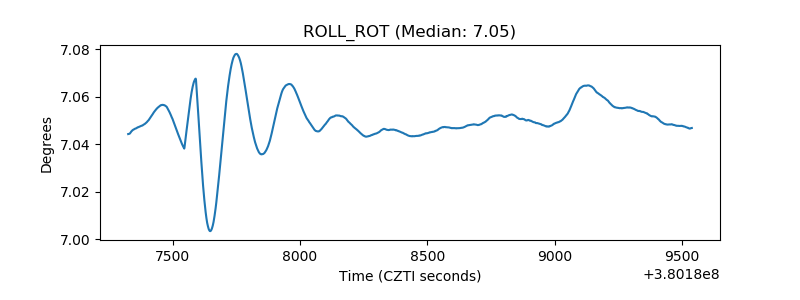 |
| _Roll_DEC | 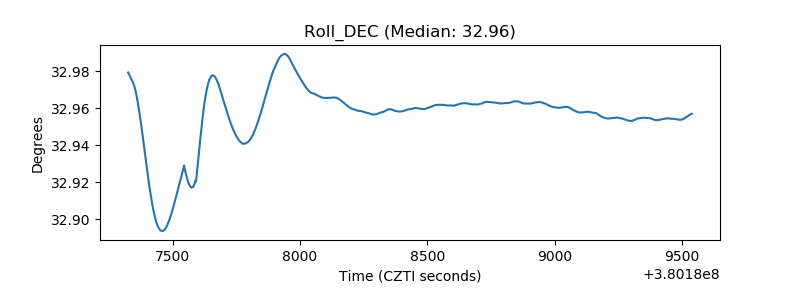 |
| _Roll_RA | 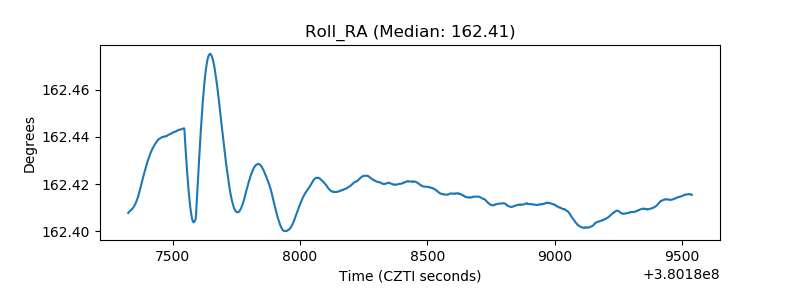 |
| Veto Counter | 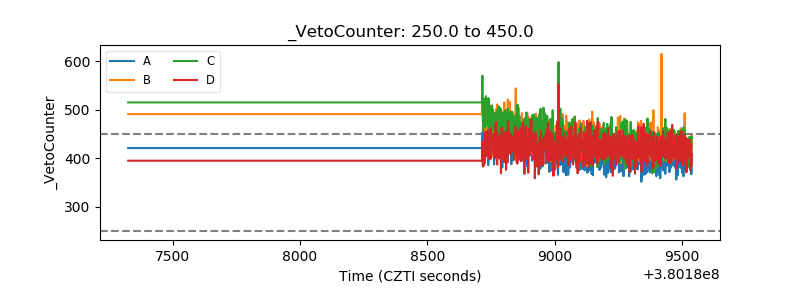 |