| Param | Original file | Final file |
|---|---|---|
| Filename | modeM0/AS1T04_093T01_9000004872_34112cztM0_level2.evt | modeM0/AS1T04_093T01_9000004872_34112cztM0_level2_quad_clean.evt |
| Size (bytes) | 677,897,280 | 96,756,480 |
| Size | 646.5 MB | 92.3 MB |
| Events in quadrant A | 3,341,199 | 626,905 |
| Events in quadrant B | 4,126,139 | 630,172 |
| Events in quadrant C | 6,233,223 | 572,712 |
| Events in quadrant D | 6,333,774 | 589,697 |
| Mode M0 | |||
|---|---|---|---|
| Quadrant | BADHDUFLAG | Total packets | Discarded packets |
| A | 0 | 14788 | 1 |
| B | 0 | 16945 | 1 |
| C | 0 | 23038 | 1 |
| D | 0 | 23749 | 1 |
| Mode SS | |||
|---|---|---|---|
| Quadrant | BADHDUFLAG | Total packets | Discarded packets |
| A | 0 | 148 | 0 |
| B | 0 | 148 | 0 |
| C | 0 | 148 | 0 |
| D | 0 | 148 | 0 |
| Mode M9 | |||
|---|---|---|---|
| Quadrant | BADHDUFLAG | Total packets | Discarded packets |
| A | 0 | 25 | 0 |
| B | 0 | 25 | 0 |
| C | 0 | 25 | 0 |
| D | 0 | 26 | 0 |
| Quadrant | Total seconds | Saturated seconds | Saturation percentage |
|---|---|---|---|
| A | 7336 | 8 | 0.109051% |
| B | 7336 | 131 | 1.785714% |
| C | 7336 | 804 | 10.959651% |
| D | 7336 | 345 | 4.702835% |
Noise dominated data is calculated using 1-second bins in cleaned event files. If a bin has >2000 counts, and if more than 50% of those come from <1% of pixels, then it is considered to be noise-dominated and hence unusable.
| Quadrant | # 1 sec bins | Bins with >0 counts | Bins with >2000 counts | High rate bins dominated by noise | Noise dominated (total time) | Noise dominated (detector-on time) | Marked lightcurve |
|---|---|---|---|---|---|---|---|
| A | 8649 | 7337 | 0 | 0 | 0.00% | 0.00% | 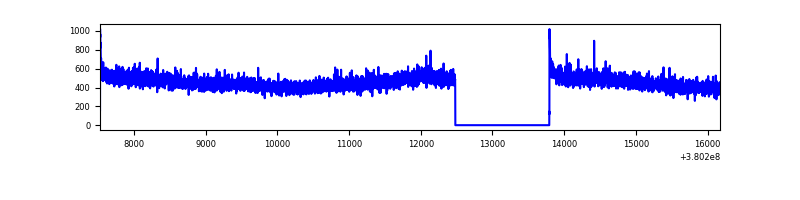 |
| B | 8649 | 7337 | 78 | 78 | 0.90% | 1.06% | 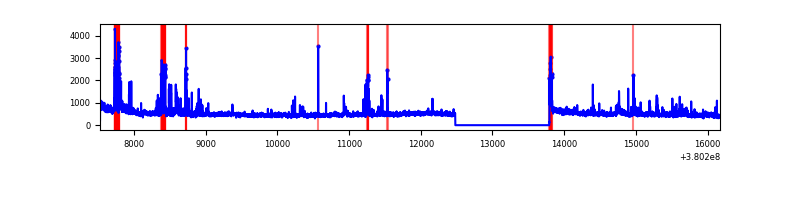 |
| C | 8649 | 7337 | 702 | 702 | 8.12% | 9.57% | 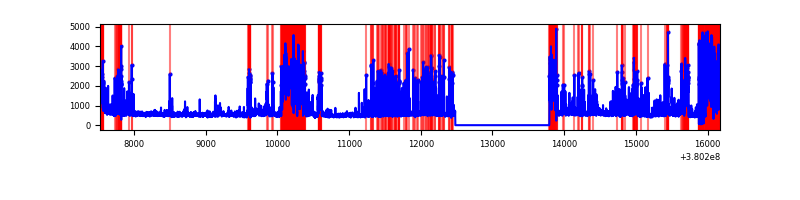 |
| D | 8649 | 7336 | 262 | 262 | 3.03% | 3.57% |  |
Top three noisy pixels from each quadrant. If the there are fewer than three noisy pixels in the level2.evt file, extra rows are filled as -1
| Pixel properties | Quadrant properties | ||||||
|---|---|---|---|---|---|---|---|
| Quadrant | DetID | PixID | Counts | Sigma | Mean | Median | Sigma |
| A | 10 | 83 | 22606 | 127.04 | 851 | 831 | 171.4 |
| A | 13 | 6 | 21538 | 120.81 | 851 | 831 | 171.4 |
| A | 13 | 254 | 13663 | 74.86 | 851 | 831 | 171.4 |
| B | 5 | 172 | 367323 | 2253.82 | 845 | 823 | 162.6 |
| B | 0 | 219 | 107071 | 653.38 | 845 | 823 | 162.6 |
| B | 5 | 31 | 90848 | 553.61 | 845 | 823 | 162.6 |
| C | 14 | 254 | 1820671 | 9951.19 | 788 | 795 | 182.9 |
| C | 0 | 10 | 963873 | 5266.17 | 788 | 795 | 182.9 |
| C | 15 | 214 | 302564 | 1650.09 | 788 | 795 | 182.9 |
| D | 8 | 195 | 1661791 | 7575.19 | 806 | 791 | 219.3 |
| D | 10 | 118 | 278399 | 1266.07 | 806 | 791 | 219.3 |
| D | 7 | 223 | 234303 | 1064.96 | 806 | 791 | 219.3 |
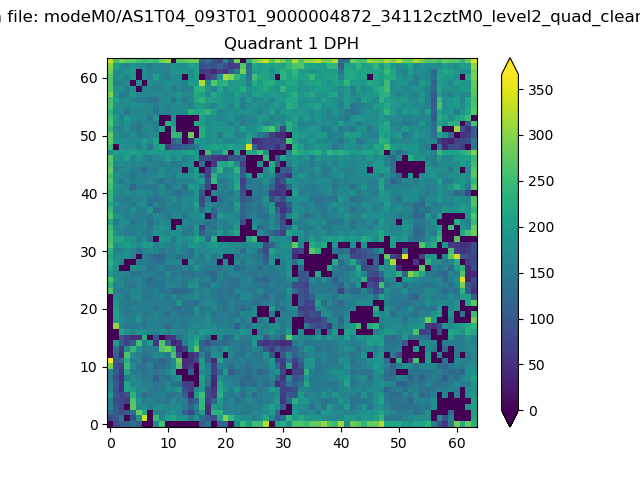
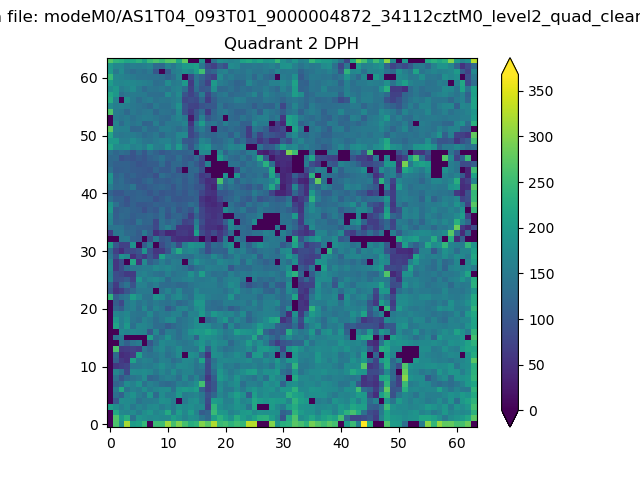
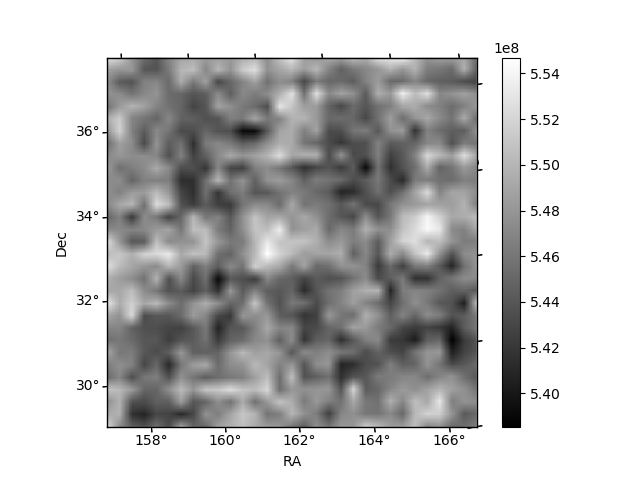
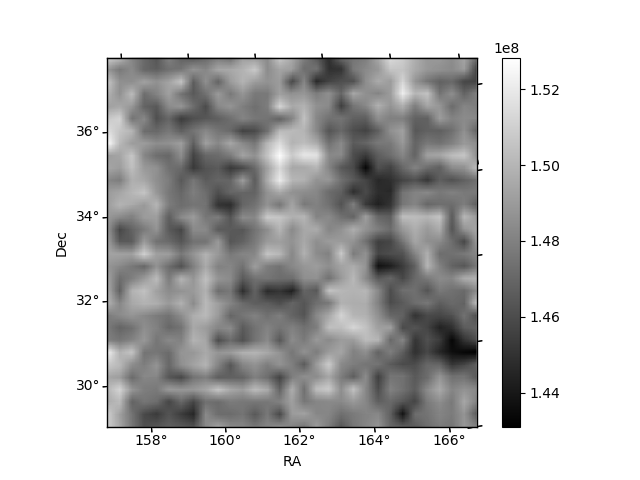
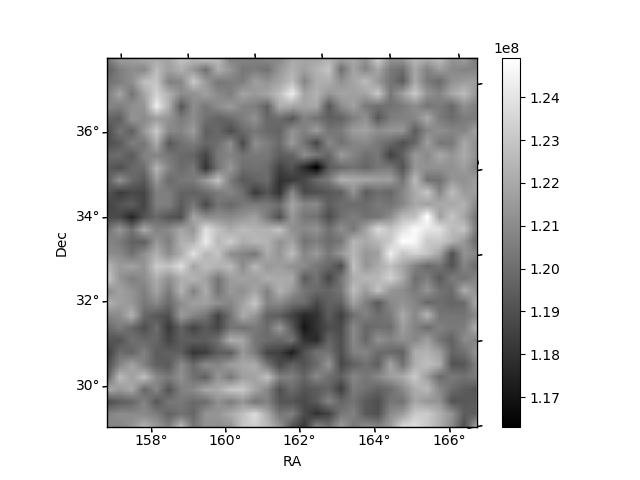
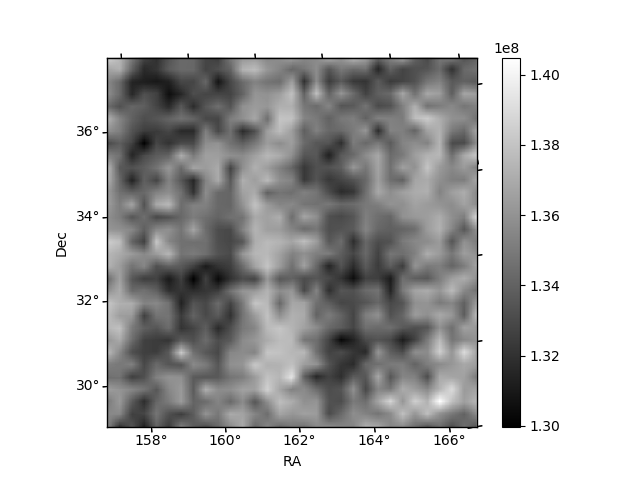
Histogram calculated using DETX and DETY for each event in the final _common_clean file
| Quadrant A | 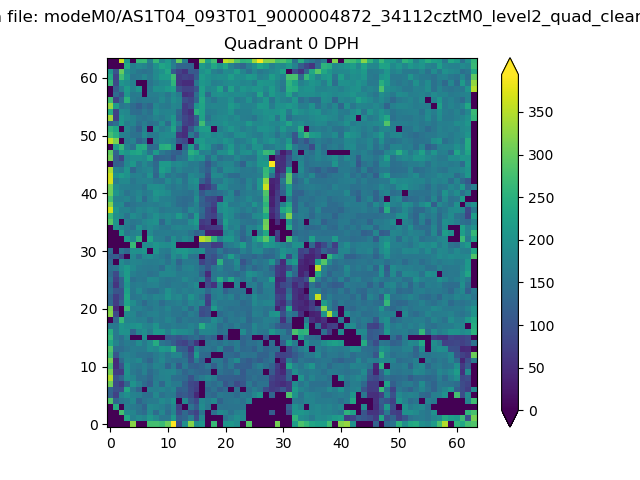 |
 |
Quadrant B |
|---|---|---|---|
| Quadrant D | 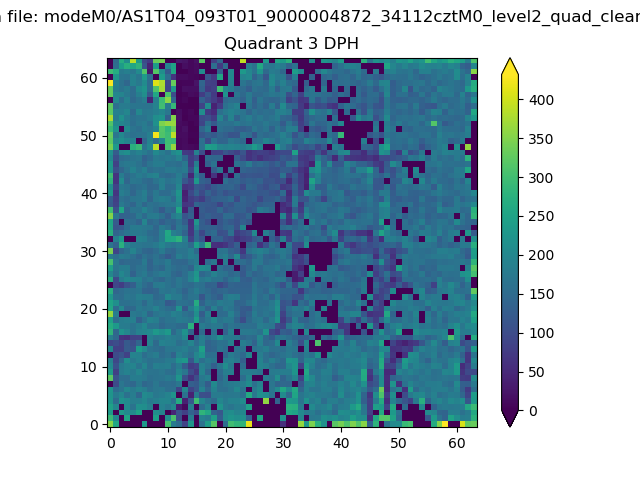 |
 |
Quadrant C |
| Plot type | Count rate plots | Images |
|---|---|---|
| Comparison with Poisson distribution Blue bars denote a histogram of data divided into 1 sec bins. Red curve is a Poisson curve with rate = median count rate of data. |
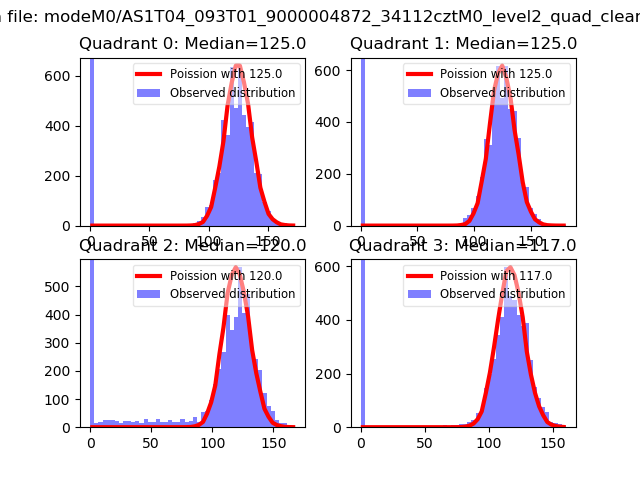 |
 |
| Quadrant-wise count rates Data is divided into 100 sec bins |
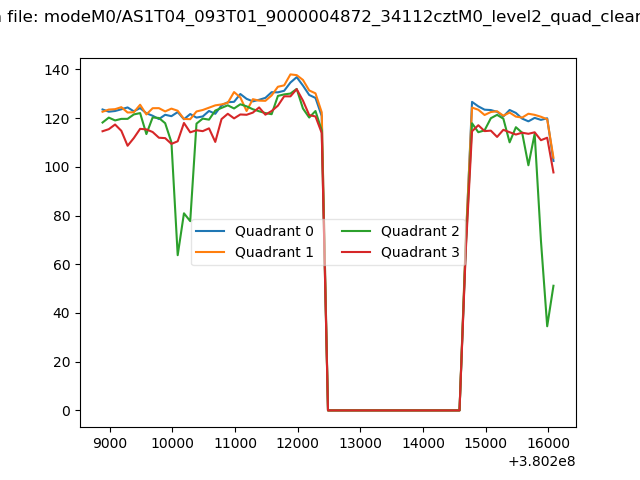 |
|
| Module-wise count rates for Quadrant A Data is divided into 100 sec bins |
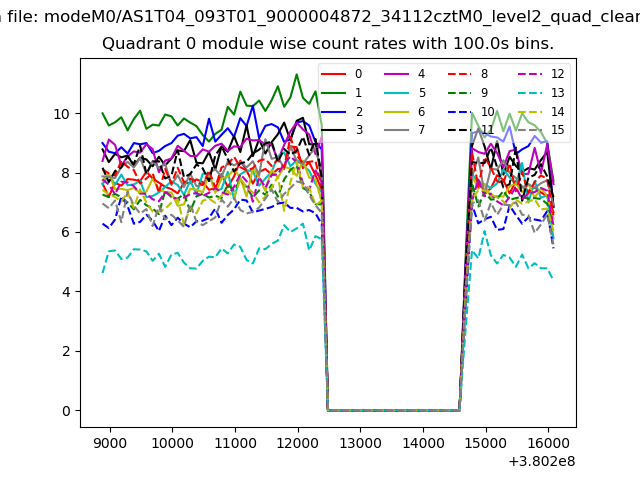 |
 |
| Module-wise count rates for Quadrant B Data is divided into 100 sec bins |
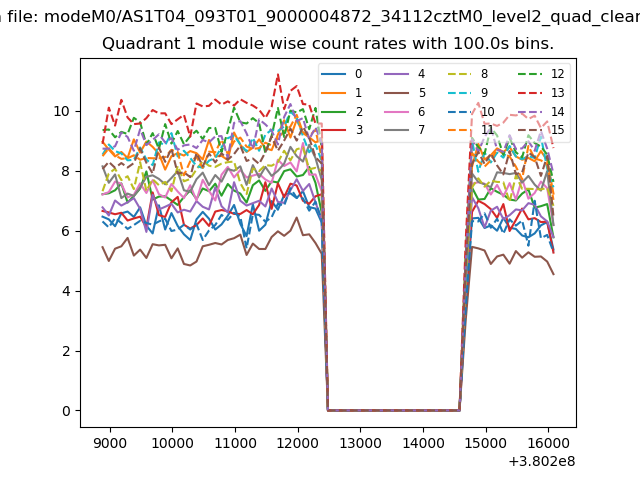 |
 |
| Module-wise count rates for Quadrant C Data is divided into 100 sec bins |
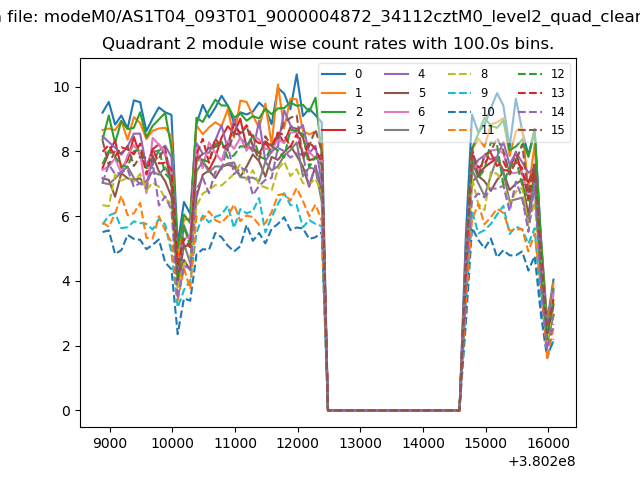 |
 |
| Module-wise count rates for Quadrant D Data is divided into 100 sec bins |
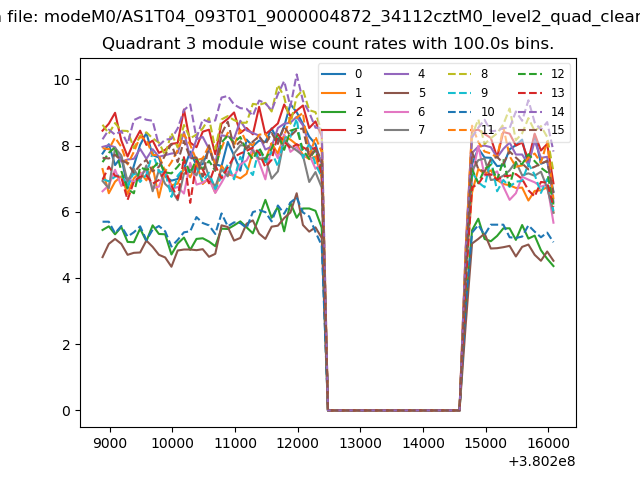 |
 |
| Parameter | Plot |
|---|---|
| CZT HV Monitor | 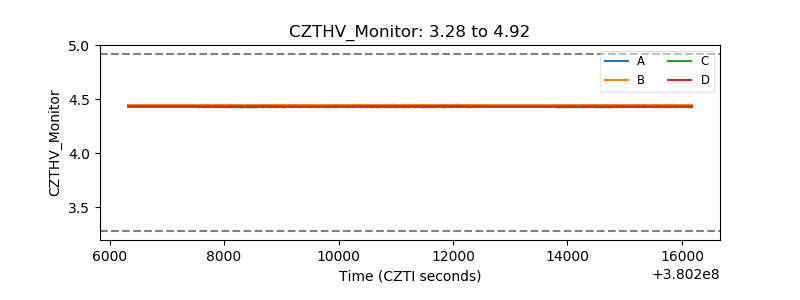 |
| D_VDD | 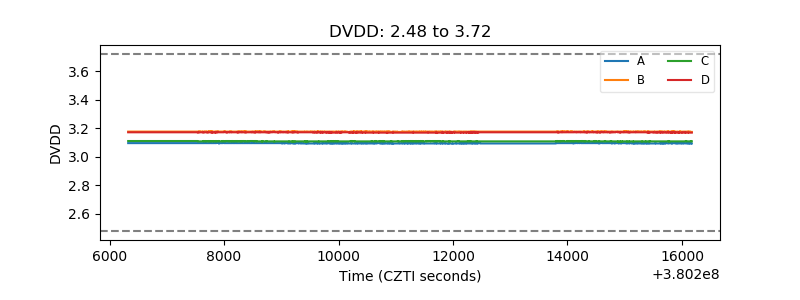 |
| Temperature 1 |  |
| Veto HV Monitor |  |
| Veto LLD | 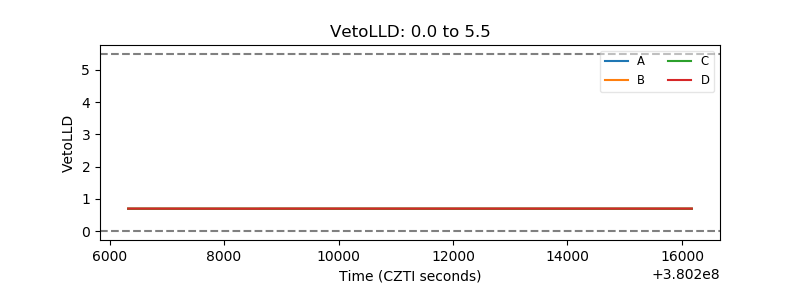 |
| Alpha Counter | 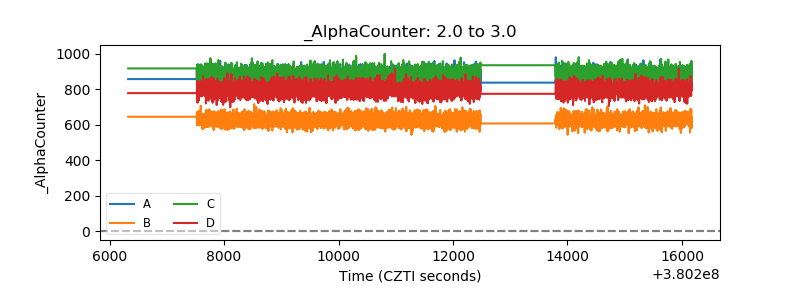 |
| _CPM_Rate | 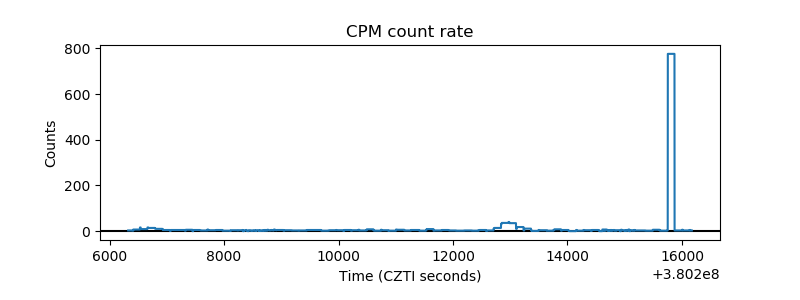 |
| CZT Counter | 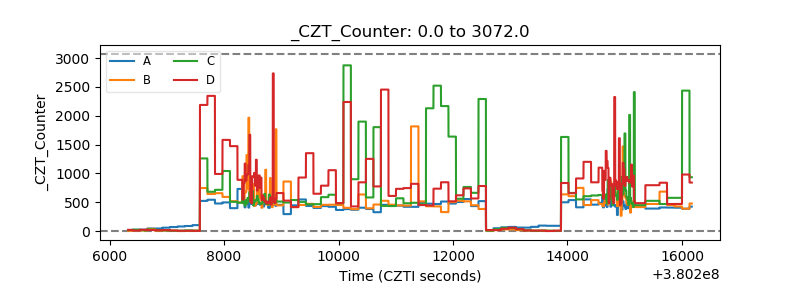 |
| +2.5 Volts monitor |  |
| +5 Volts monitor |  |
| _ROLL_ROT | 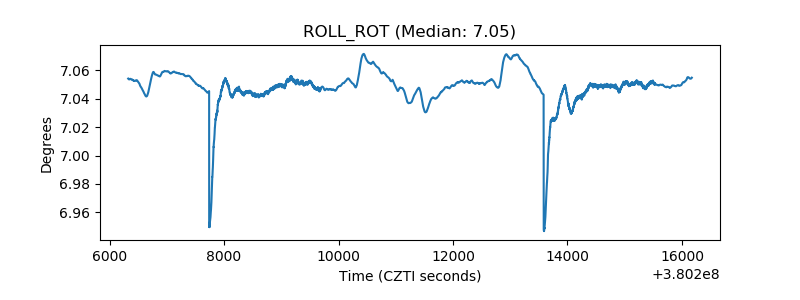 |
| _Roll_DEC |  |
| _Roll_RA | 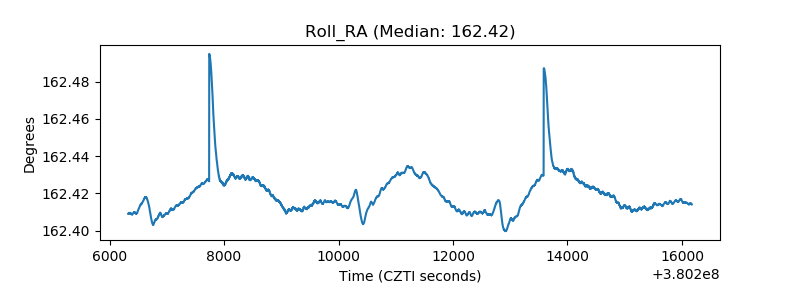 |
| Veto Counter | 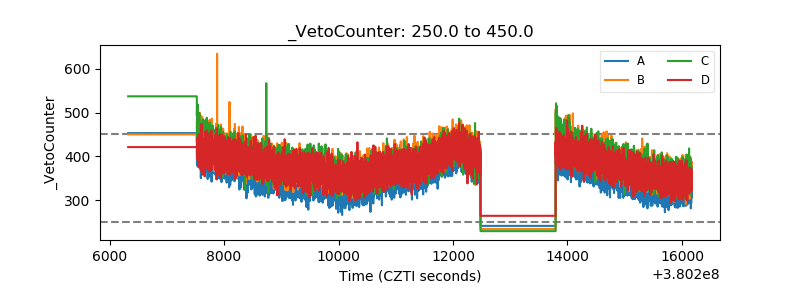 |