| Param | Original file | Final file |
|---|---|---|
| Filename | modeM0/AS1T04_093T01_9000004872_34113cztM0_level2.evt | modeM0/AS1T04_093T01_9000004872_34113cztM0_level2_quad_clean.evt |
| Size (bytes) | 243,864,000 | 20,854,080 |
| Size | 232.6 MB | 19.9 MB |
| Events in quadrant A | 1,199,709 | 114,014 |
| Events in quadrant B | 2,028,750 | 113,181 |
| Events in quadrant C | 1,616,617 | 110,645 |
| Events in quadrant D | 2,361,085 | 105,393 |
| Mode M0 | |||
|---|---|---|---|
| Quadrant | BADHDUFLAG | Total packets | Discarded packets |
| A | 0 | 5255 | 1 |
| B | 0 | 7797 | 0 |
| C | 0 | 6343 | 0 |
| D | 0 | 8783 | 0 |
| Mode SS | |||
|---|---|---|---|
| Quadrant | BADHDUFLAG | Total packets | Discarded packets |
| A | 0 | 52 | 0 |
| B | 0 | 52 | 0 |
| C | 0 | 52 | 0 |
| D | 0 | 52 | 0 |
| Quadrant | Total seconds | Saturated seconds | Saturation percentage |
|---|---|---|---|
| A | 2618 | 5 | 0.190985% |
| B | 2618 | 173 | 6.608098% |
| C | 2618 | 43 | 1.642475% |
| D | 2618 | 136 | 5.194805% |
Noise dominated data is calculated using 1-second bins in cleaned event files. If a bin has >2000 counts, and if more than 50% of those come from <1% of pixels, then it is considered to be noise-dominated and hence unusable.
| Quadrant | # 1 sec bins | Bins with >0 counts | Bins with >2000 counts | High rate bins dominated by noise | Noise dominated (total time) | Noise dominated (detector-on time) | Marked lightcurve |
|---|---|---|---|---|---|---|---|
| A | 2618 | 2618 | 0 | 0 | 0.00% | 0.00% | 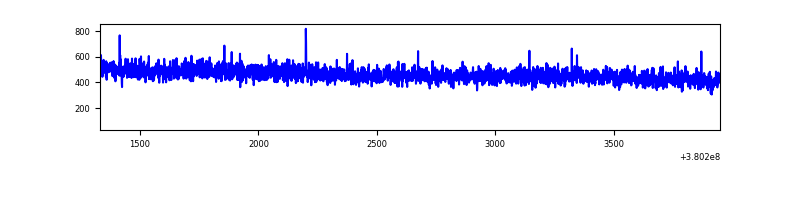 |
| B | 2618 | 2618 | 103 | 103 | 3.93% | 3.93% | 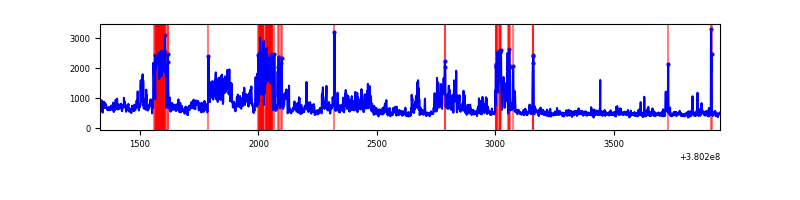 |
| C | 2618 | 2618 | 37 | 37 | 1.41% | 1.41% | 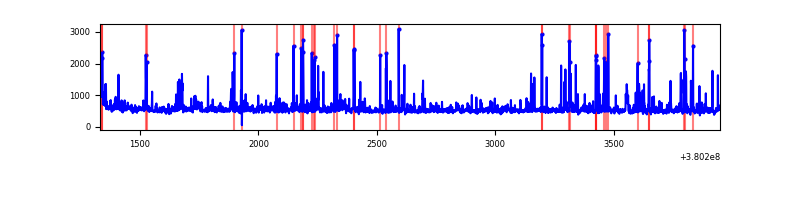 |
| D | 2618 | 2618 | 95 | 95 | 3.63% | 3.63% | 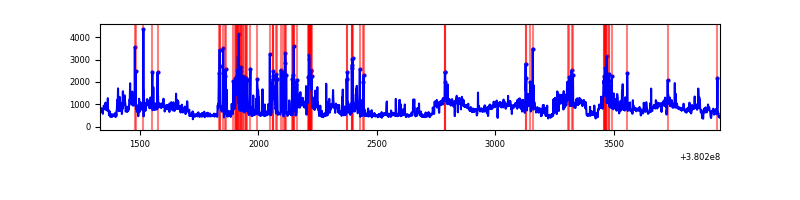 |
Top three noisy pixels from each quadrant. If the there are fewer than three noisy pixels in the level2.evt file, extra rows are filled as -1
| Pixel properties | Quadrant properties | ||||||
|---|---|---|---|---|---|---|---|
| Quadrant | DetID | PixID | Counts | Sigma | Mean | Median | Sigma |
| A | 13 | 6 | 7623 | 116.39 | 307 | 300 | 62.9 |
| A | 13 | 254 | 5077 | 75.92 | 307 | 300 | 62.9 |
| A | 10 | 83 | 4040 | 59.44 | 307 | 300 | 62.9 |
| B | 5 | 172 | 552662 | 9339.44 | 298 | 290 | 59.1 |
| B | 0 | 189 | 160706 | 2712.3 | 298 | 290 | 59.1 |
| B | 5 | 31 | 51835 | 871.52 | 298 | 290 | 59.1 |
| C | 0 | 10 | 287511 | 4081.65 | 297 | 299 | 70.4 |
| C | 15 | 214 | 113404 | 1607.37 | 297 | 299 | 70.4 |
| C | 14 | 254 | 36395 | 512.97 | 297 | 299 | 70.4 |
| D | 8 | 195 | 681253 | 9111.74 | 295 | 286 | 74.7 |
| D | 13 | 249 | 284683 | 3805.4 | 295 | 286 | 74.7 |
| D | 7 | 223 | 83867 | 1118.36 | 295 | 286 | 74.7 |
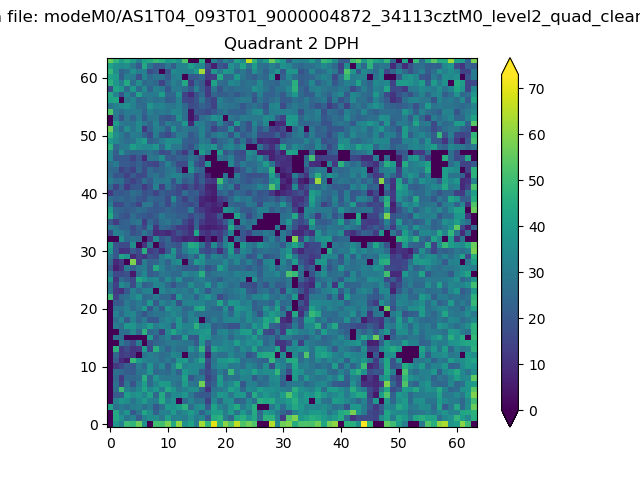
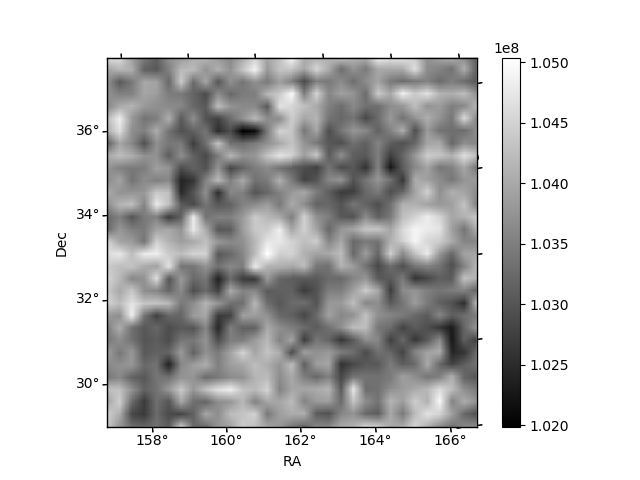
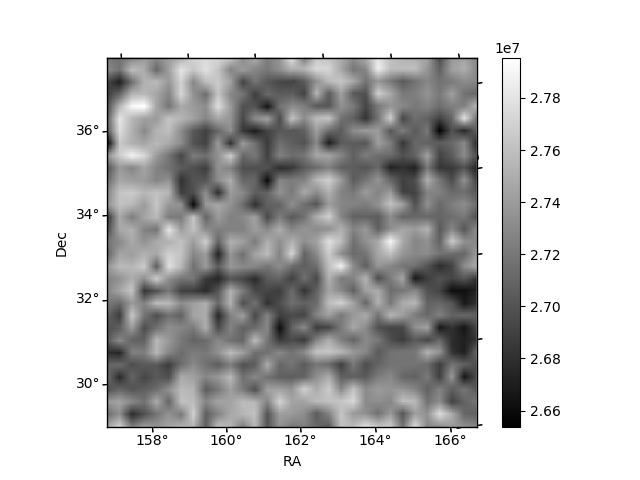
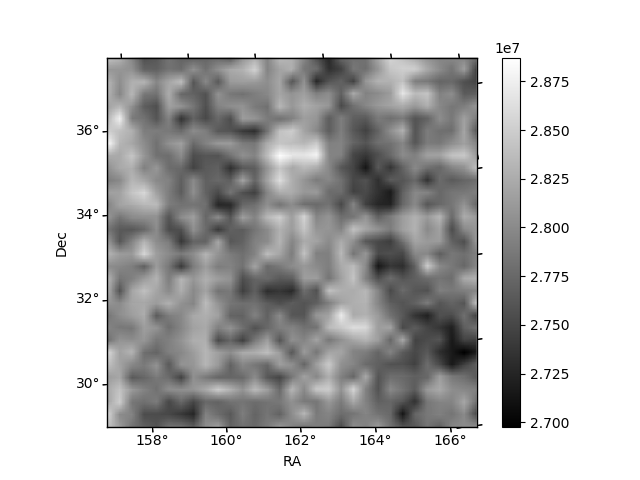
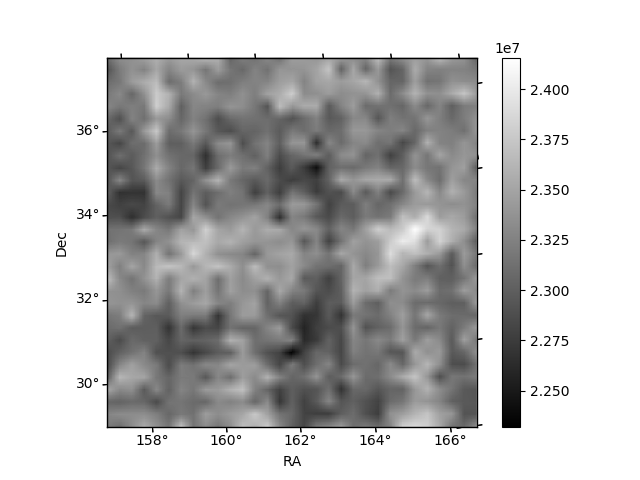
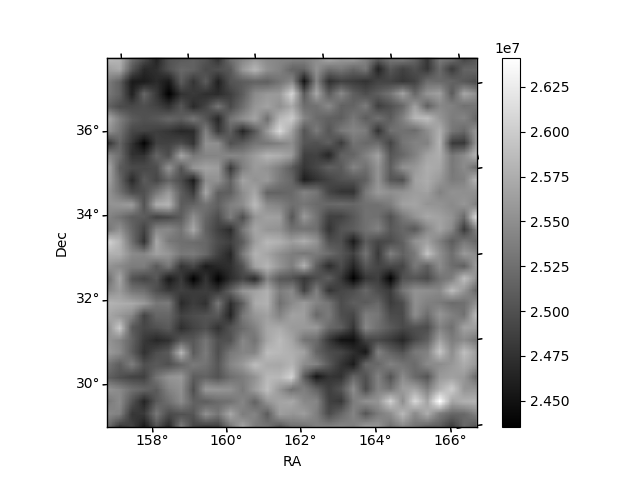
Histogram calculated using DETX and DETY for each event in the final _common_clean file
| Quadrant A | 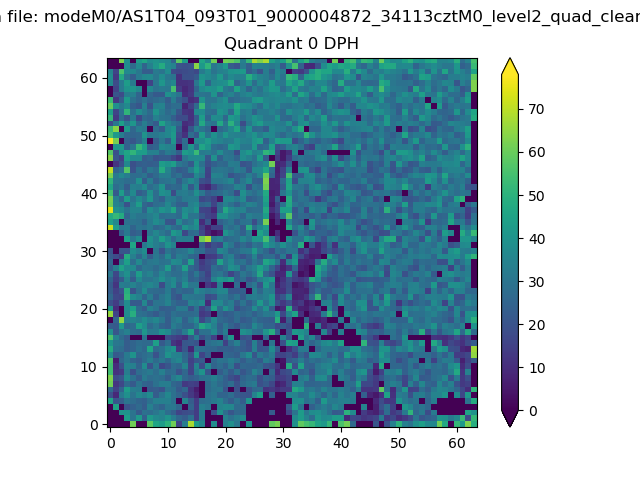 |
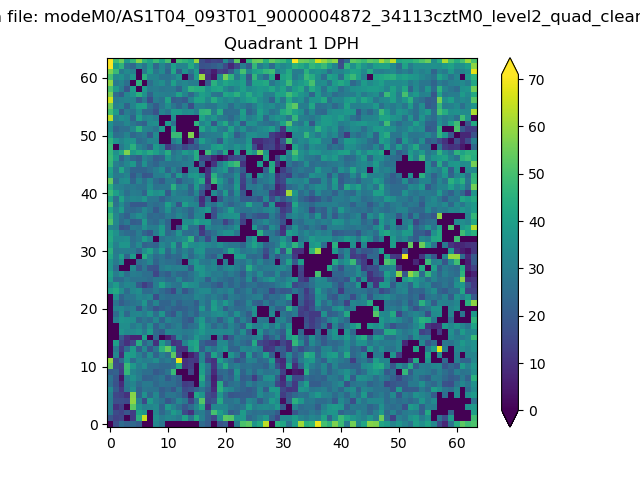 |
Quadrant B |
|---|---|---|---|
| Quadrant D | 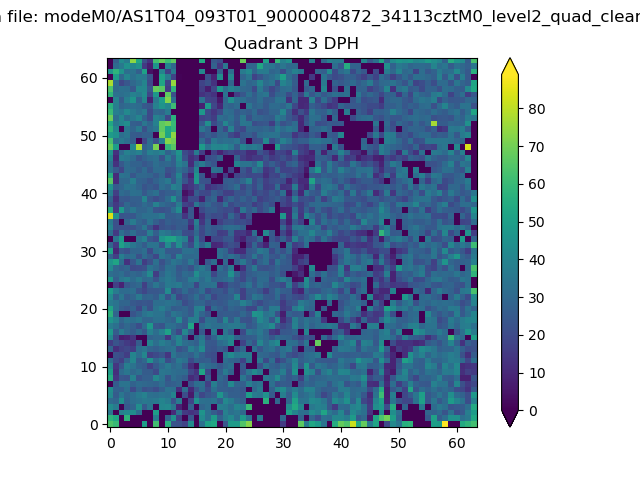 |
 |
Quadrant C |
| Plot type | Count rate plots | Images |
|---|---|---|
| Comparison with Poisson distribution Blue bars denote a histogram of data divided into 1 sec bins. Red curve is a Poisson curve with rate = median count rate of data. |
 |
 |
| Quadrant-wise count rates Data is divided into 100 sec bins |
 |
|
| Module-wise count rates for Quadrant A Data is divided into 100 sec bins |
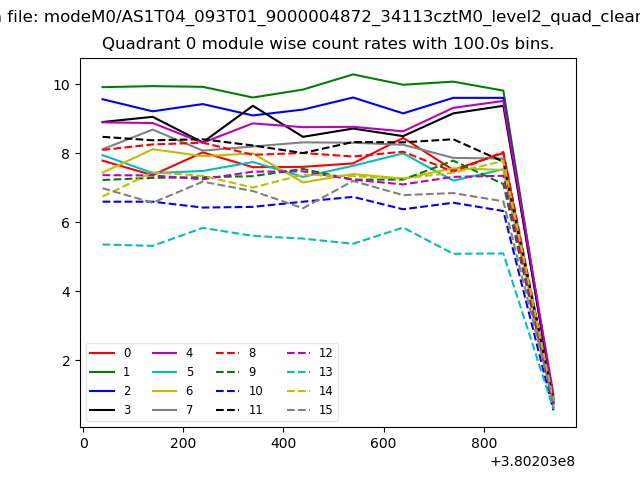 |
 |
| Module-wise count rates for Quadrant B Data is divided into 100 sec bins |
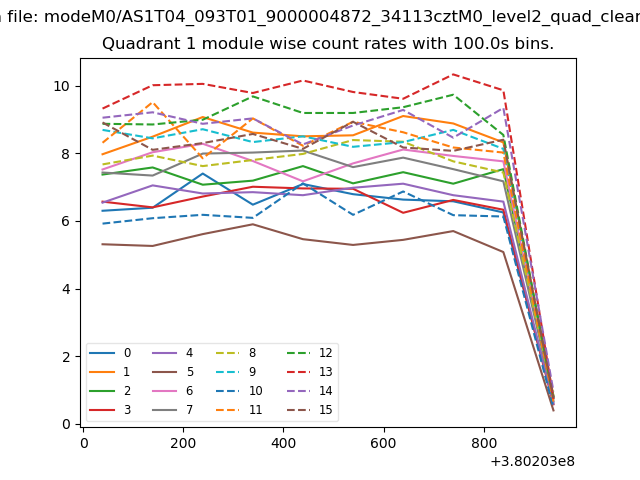 |
 |
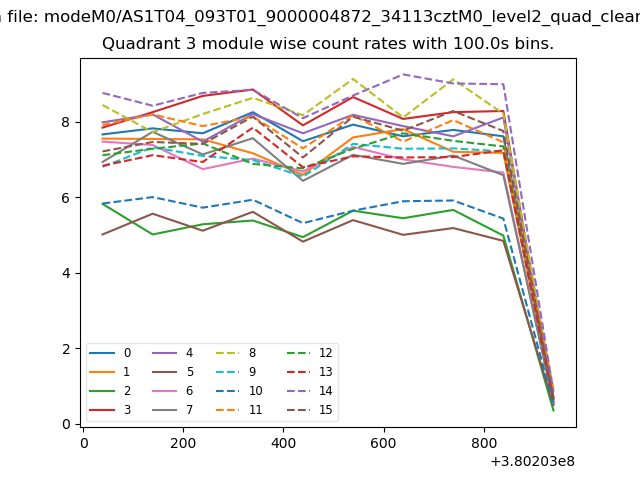
| Module-wise count rates for Quadrant C Data is divided into 100 sec bins |
 |
 |
| Module-wise count rates for Quadrant D Data is divided into 100 sec bins |
 |
 |
| Parameter | Plot |
|---|---|
| CZT HV Monitor |  |
| D_VDD | 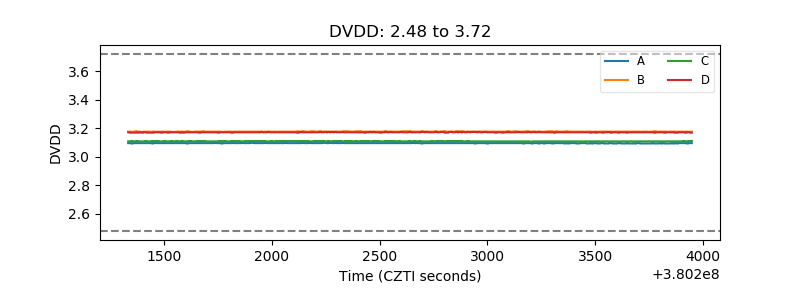 |
| Temperature 1 | 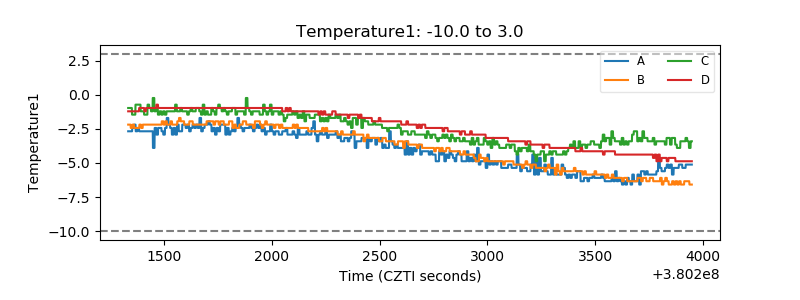 |
| Veto HV Monitor | 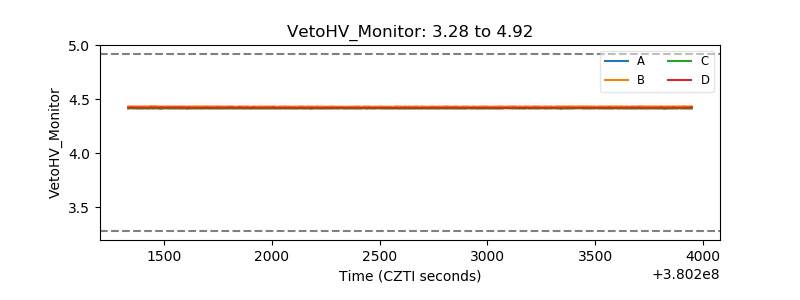 |
| Veto LLD | 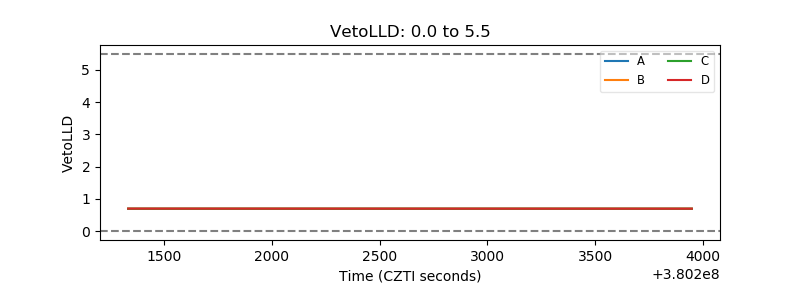 |
| Alpha Counter |  |
| _CPM_Rate | 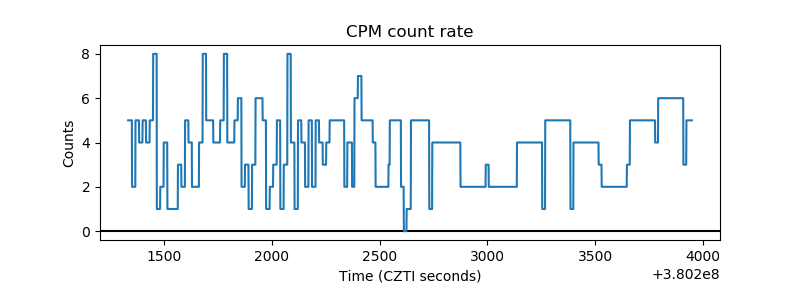 |
| CZT Counter | 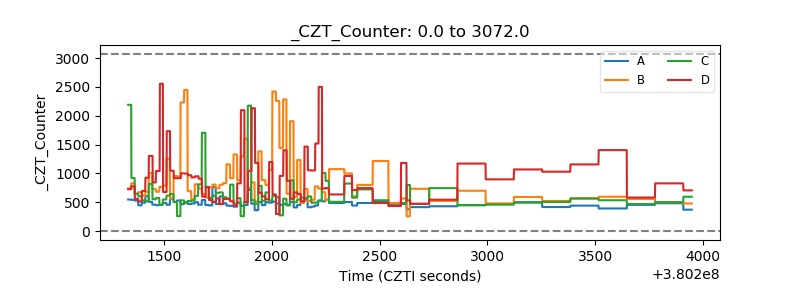 |
| +2.5 Volts monitor | 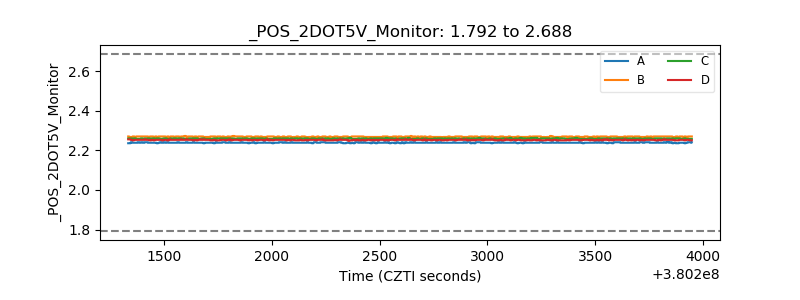 |
| +5 Volts monitor |  |
| _ROLL_ROT | 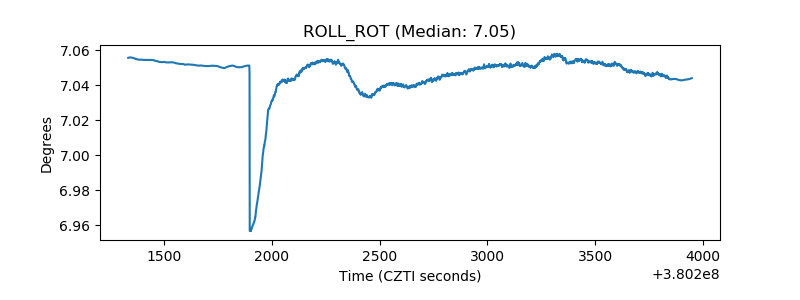 |
| _Roll_DEC | 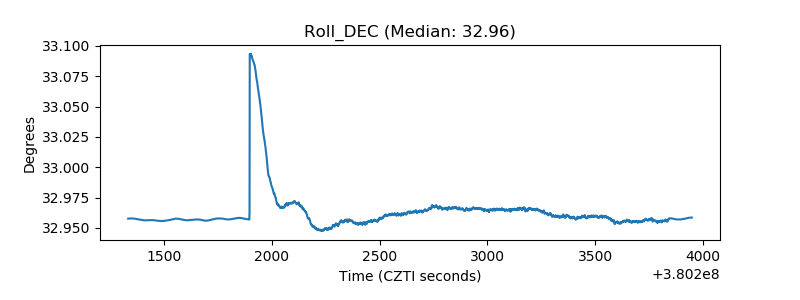 |
| _Roll_RA | 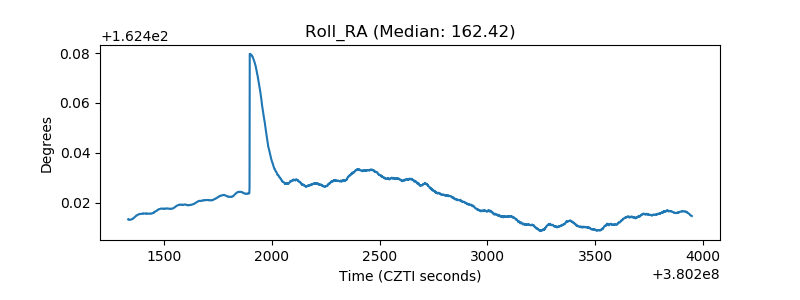 |
| Veto Counter | 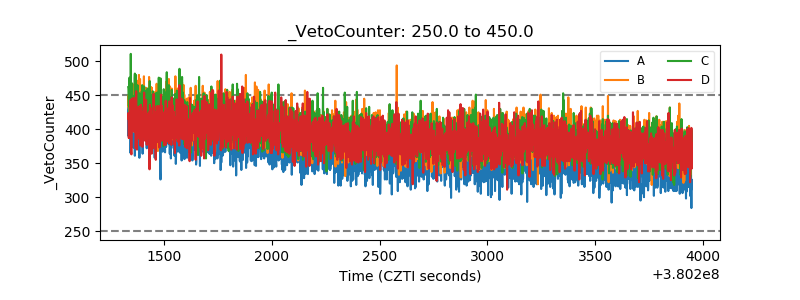 |