| Param | Original file | Final file |
|---|---|---|
| Filename | modeM0/AS1A11_059T05_9000004876cztM0_level2.fits | modeM0/AS1A11_059T05_9000004876cztM0_level2_quad_clean.evt |
| Size (bytes) | 544,668,480 | 428,281,920 |
| Size | 519.4 MB | 408.4 MB |
| Events in quadrant A | 3,459,242 | 2,589,113 |
| Events in quadrant B | 2,815,222 | 1,726,810 |
| Events in quadrant C | 3,354,272 | 2,476,477 |
| Events in quadrant D | 2,879,028 | 2,197,625 |
| Mode M9 | |||
|---|---|---|---|
| Quadrant | BADHDUFLAG | Total packets | Discarded packets |
| A | 0 | 224 | 0 |
| B | 0 | 224 | 0 |
| C | 0 | 224 | 0 |
| D | 0 | 224 | 0 |
| Mode M0 | |||
|---|---|---|---|
| Quadrant | BADHDUFLAG | Total packets | Discarded packets |
| A | 0 | 118611 | 0 |
| B | 0 | 263286 | 0 |
| C | 0 | 138937 | 0 |
| D | 0 | 168054 | 0 |
| Mode SS | |||
|---|---|---|---|
| Quadrant | BADHDUFLAG | Total packets | Discarded packets |
| A | 0 | 1184 | 0 |
| B | 0 | 1184 | 0 |
| C | 0 | 1184 | 0 |
| D | 0 | 1184 | 0 |
| Quadrant | Total seconds | Saturated seconds | Saturation percentage |
|---|---|---|---|
| A | 57991 | 60 | 0.103464% |
| B | 57990 | 20458 | 35.278496% |
| C | 57991 | 1101 | 1.898570% |
| D | 57991 | 1710 | 2.948733% |
Noise dominated data is calculated using 1-second bins in cleaned event files. If a bin has >2000 counts, and if more than 50% of those come from <1% of pixels, then it is considered to be noise-dominated and hence unusable.
| Quadrant | # 1 sec bins | Bins with >0 counts | Bins with >2000 counts | High rate bins dominated by noise | Noise dominated (total time) | Noise dominated (detector-on time) | Marked lightcurve |
|---|---|---|---|---|---|---|---|
| A | 78875 | 57989 | 0 | 0 | 0.00% | 0.00% |  |
| B | 78875 | 57975 | 0 | 0 | 0.00% | 0.00% | 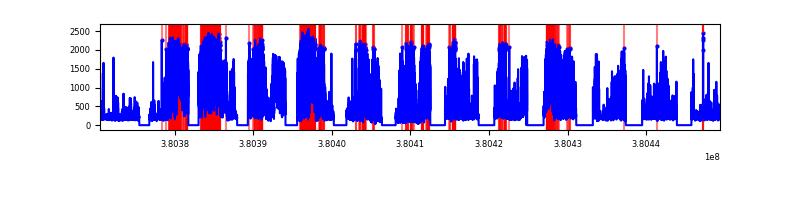 |
| C | 78875 | 57981 | 0 | 0 | 0.00% | 0.00% |  |
| D | 78875 | 57977 | 0 | 0 | 0.00% | 0.00% |  |
Top three noisy pixels from each quadrant. If the there are fewer than three noisy pixels in the level2.evt file, extra rows are filled as -1
| Pixel properties | Quadrant properties | ||||||
|---|---|---|---|---|---|---|---|
| Quadrant | DetID | PixID | Counts | Sigma | Mean | Median | Sigma |
| A | 7 | 110 | 2869 | 9.05 | 900 | 842 | 223.9 |
| A | 9 | 19 | 2823 | 8.85 | 900 | 842 | 223.9 |
| A | 0 | 29 | 2716 | 8.37 | 900 | 842 | 223.9 |
| B | 2 | 9 | 2478 | 12.12 | 744 | 712 | 145.7 |
| B | 3 | 80 | 2161 | 9.95 | 744 | 712 | 145.7 |
| B | 2 | 8 | 2029 | 9.04 | 744 | 712 | 145.7 |
| C | 1 | 81 | 2815 | 8.87 | 886 | 833 | 223.6 |
| C | 1 | 80 | 2756 | 8.6 | 886 | 833 | 223.6 |
| C | 3 | 203 | 2647 | 8.11 | 886 | 833 | 223.6 |
| D | 7 | 3 | 2150 | 6.35 | 824 | 751 | 220.3 |
| D | 10 | 113 | 2147 | 6.34 | 824 | 751 | 220.3 |
| D | 4 | 160 | 2088 | 6.07 | 824 | 751 | 220.3 |
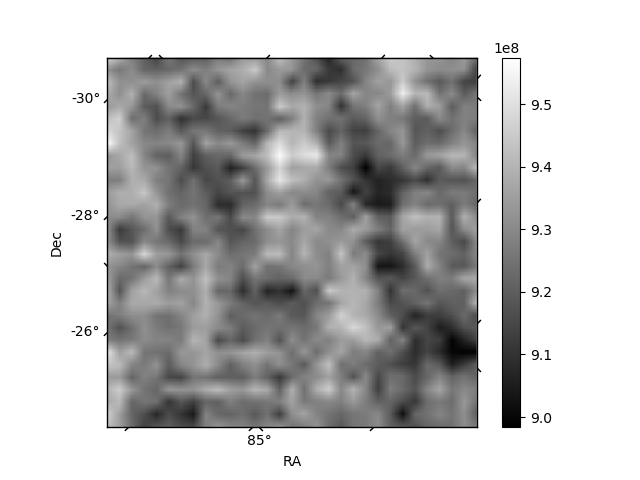
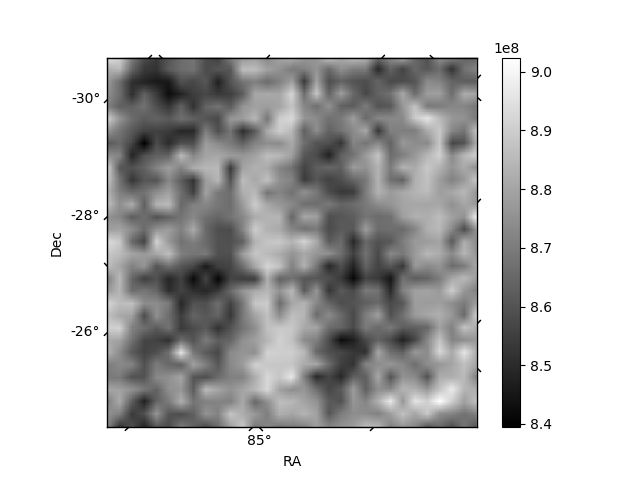
Histogram calculated using DETX and DETY for each event in the final _common_clean file
| Quadrant A | 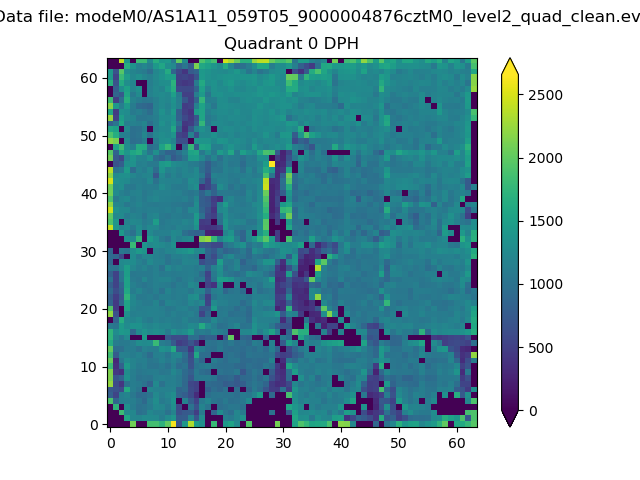 |
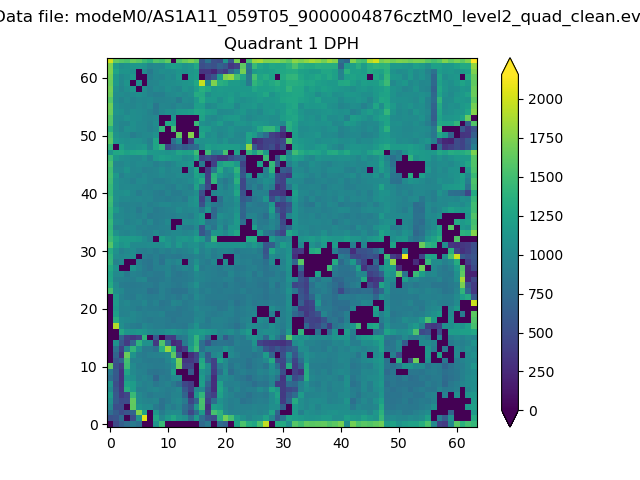 |
Quadrant B |
|---|---|---|---|
| Quadrant D | 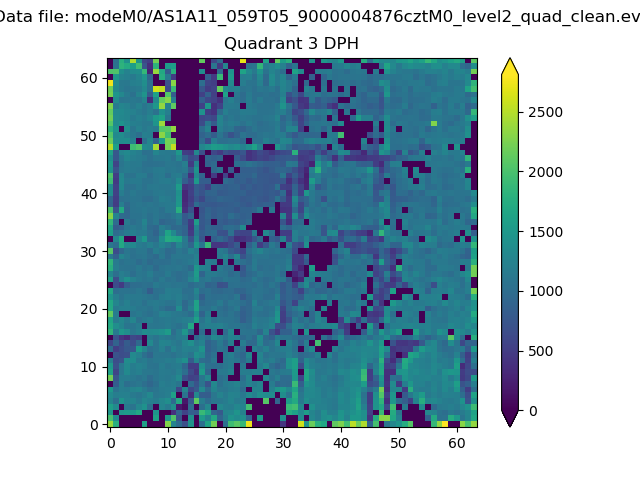 |
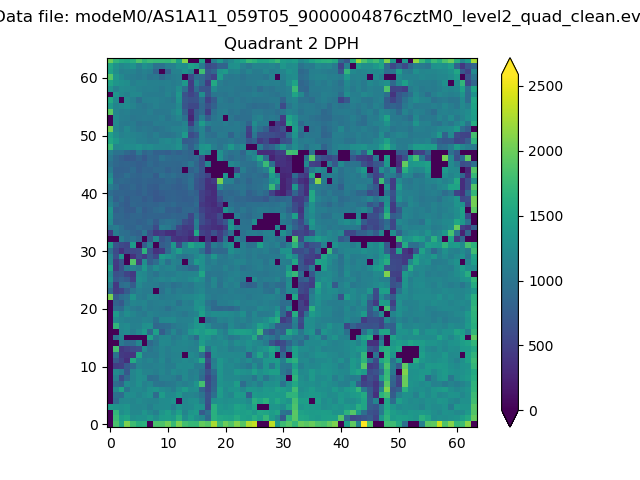 |
Quadrant C |
| Plot type | Count rate plots | Images |
|---|---|---|
| Comparison with Poisson distribution Blue bars denote a histogram of data divided into 1 sec bins. Red curve is a Poisson curve with rate = median count rate of data. |
 |
 |
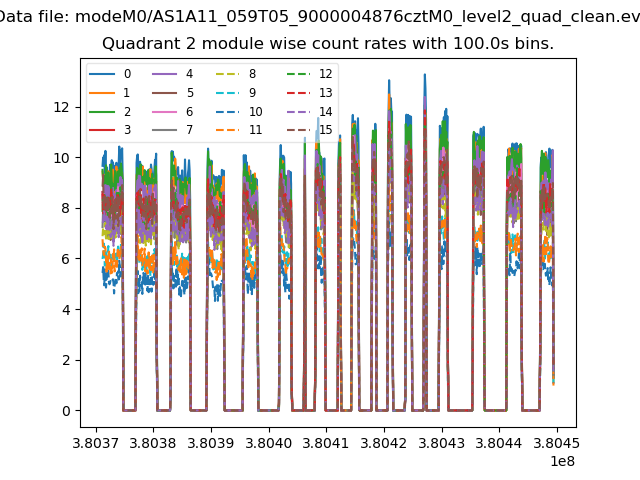
| Quadrant-wise count rates Data is divided into 100 sec bins |
 |
|
| Module-wise count rates for Quadrant A Data is divided into 100 sec bins |
 |
 |
| Module-wise count rates for Quadrant B Data is divided into 100 sec bins |
 |
 |
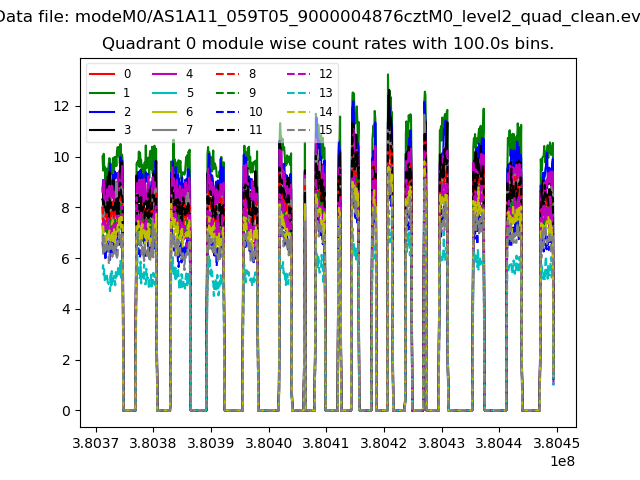
| Module-wise count rates for Quadrant C Data is divided into 100 sec bins |
 |
 |
| Module-wise count rates for Quadrant D Data is divided into 100 sec bins |
 |
 |
| Parameter | Plot |
|---|---|
| CZT HV Monitor |  |
| D_VDD | 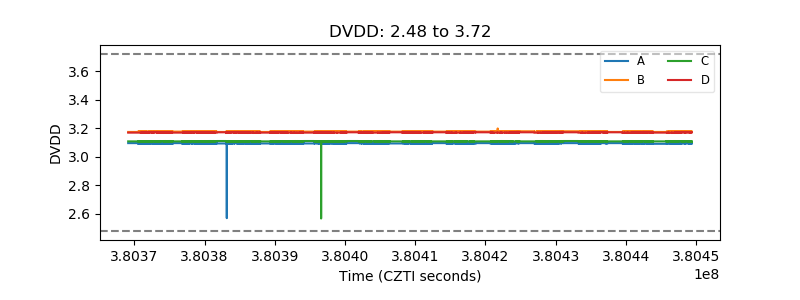 |
| Temperature 1 | 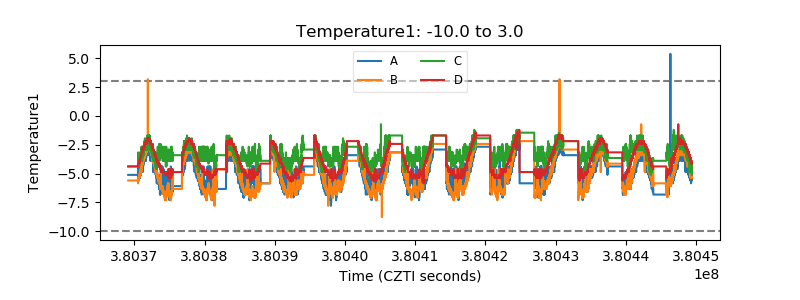 |
| Veto HV Monitor | 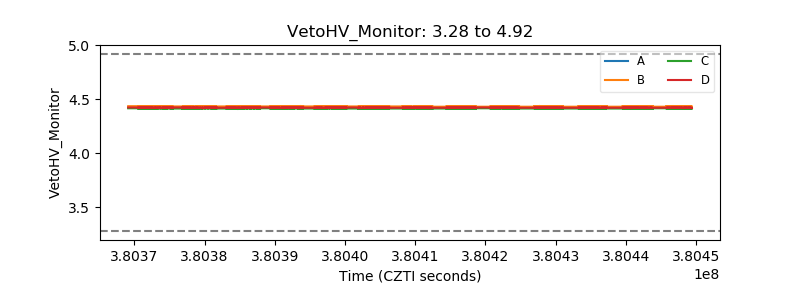 |
| Veto LLD | 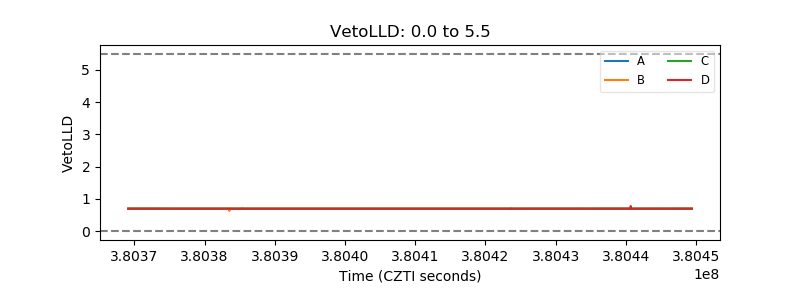 |
| Alpha Counter |  |
| _CPM_Rate |  |
| CZT Counter |  |
| +2.5 Volts monitor | 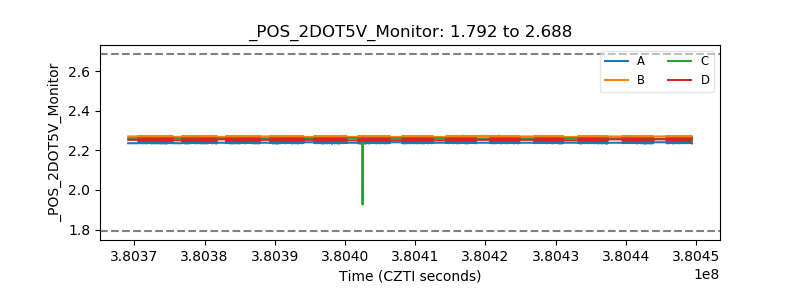 |
| +5 Volts monitor |  |
| _ROLL_ROT | 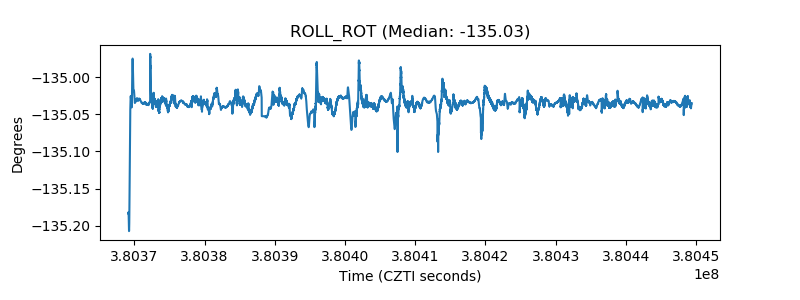 |
| _Roll_DEC | 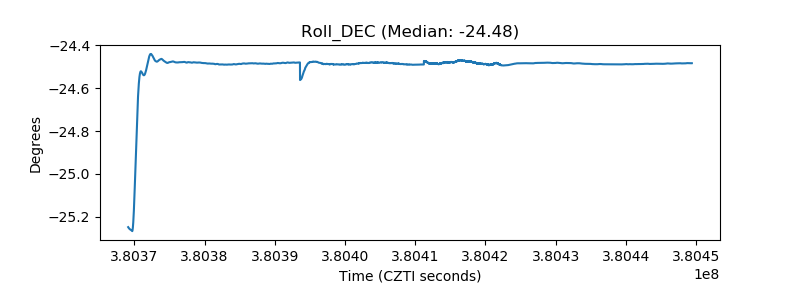 |
| _Roll_RA | 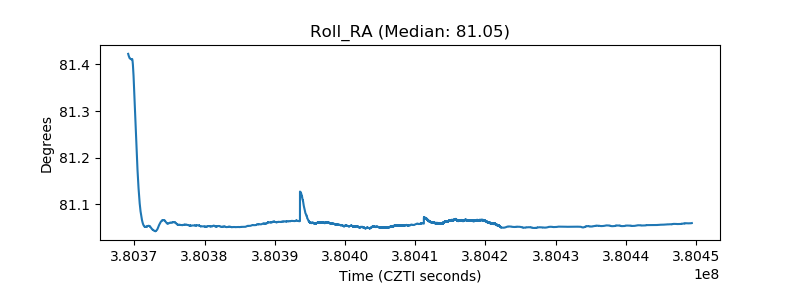 |
| Veto Counter | 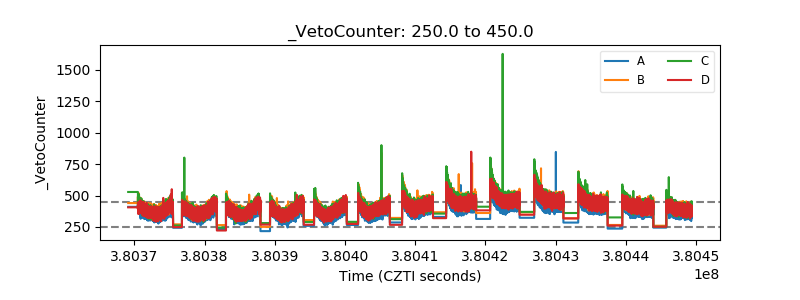 |