| Param | Original file | Final file |
|---|---|---|
| Filename | modeM0/AS1A11_059T05_9000004876_34137cztM0_level2.evt | modeM0/AS1A11_059T05_9000004876_34137cztM0_level2_quad_clean.evt |
| Size (bytes) | 77,564,160 | 8,127,360 |
| Size | 74.0 MB | 7.8 MB |
| Events in quadrant A | 523,592 | 41,516 |
| Events in quadrant B | 513,322 | 42,552 |
| Events in quadrant C | 671,224 | 43,160 |
| Events in quadrant D | 569,858 | 41,198 |
| Mode M9 | |||
|---|---|---|---|
| Quadrant | BADHDUFLAG | Total packets | Discarded packets |
| A | 0 | 14 | 0 |
| B | 0 | 14 | 0 |
| C | 0 | 14 | 0 |
| D | 0 | 14 | 0 |
| Mode M0 | |||
|---|---|---|---|
| Quadrant | BADHDUFLAG | Total packets | Discarded packets |
| A | 0 | 2131 | 2 |
| B | 0 | 2101 | 3 |
| C | 0 | 2535 | 1 |
| D | 0 | 2264 | 1 |
| Mode SS | |||
|---|---|---|---|
| Quadrant | BADHDUFLAG | Total packets | Discarded packets |
| A | 0 | 22 | 0 |
| B | 0 | 22 | 0 |
| C | 0 | 22 | 0 |
| D | 0 | 22 | 0 |
| Quadrant | Total seconds | Saturated seconds | Saturation percentage |
|---|---|---|---|
| A | 998 | 4 | 0.400802% |
| B | 997 | 5 | 0.501505% |
| C | 998 | 47 | 4.709419% |
| D | 998 | 11 | 1.102204% |
Noise dominated data is calculated using 1-second bins in cleaned event files. If a bin has >2000 counts, and if more than 50% of those come from <1% of pixels, then it is considered to be noise-dominated and hence unusable.
| Quadrant | # 1 sec bins | Bins with >0 counts | Bins with >2000 counts | High rate bins dominated by noise | Noise dominated (total time) | Noise dominated (detector-on time) | Marked lightcurve |
|---|---|---|---|---|---|---|---|
| A | 998 | 998 | 0 | 0 | 0.00% | 0.00% | 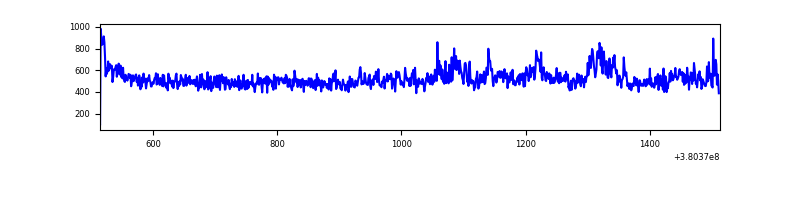 |
| B | 998 | 998 | 2 | 2 | 0.20% | 0.20% | 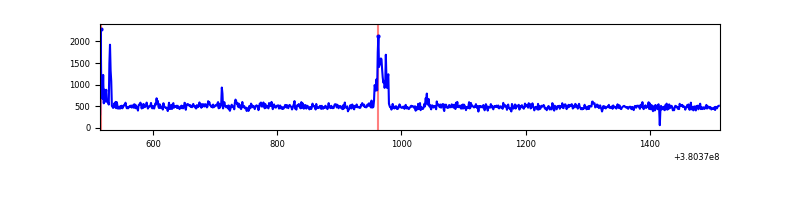 |
| C | 998 | 998 | 34 | 34 | 3.41% | 3.41% | 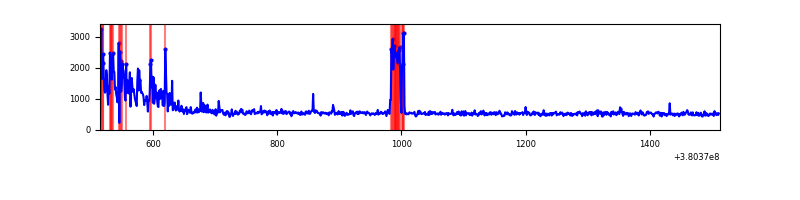 |
| D | 998 | 998 | 7 | 7 | 0.70% | 0.70% | 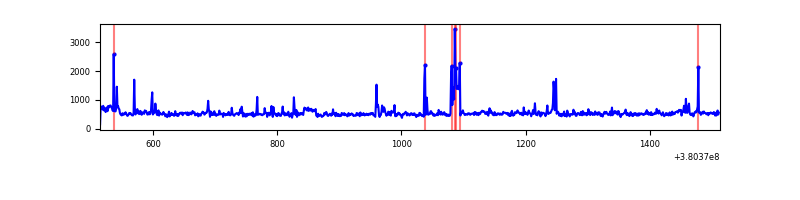 |
Top three noisy pixels from each quadrant. If the there are fewer than three noisy pixels in the level2.evt file, extra rows are filled as -1
| Pixel properties | Quadrant properties | ||||||
|---|---|---|---|---|---|---|---|
| Quadrant | DetID | PixID | Counts | Sigma | Mean | Median | Sigma |
| A | 15 | 169 | 40998 | 1564.45 | 121 | 119 | 26.1 |
| A | 10 | 83 | 8889 | 335.63 | 121 | 119 | 26.1 |
| A | 13 | 6 | 2855 | 104.71 | 121 | 119 | 26.1 |
| B | 5 | 172 | 31786 | 1243.83 | 120 | 117 | 25.5 |
| B | 0 | 219 | 6423 | 247.67 | 120 | 117 | 25.5 |
| B | 12 | 111 | 2929 | 110.44 | 120 | 117 | 25.5 |
| C | 0 | 10 | 118980 | 4074.32 | 117 | 118 | 29.2 |
| C | 15 | 214 | 47862 | 1636.55 | 117 | 118 | 29.2 |
| C | 14 | 254 | 43315 | 1480.69 | 117 | 118 | 29.2 |
| D | 8 | 195 | 44221 | 1417.07 | 119 | 115 | 31.1 |
| D | 10 | 118 | 21508 | 687.33 | 119 | 115 | 31.1 |
| D | 2 | 250 | 17388 | 554.96 | 119 | 115 | 31.1 |
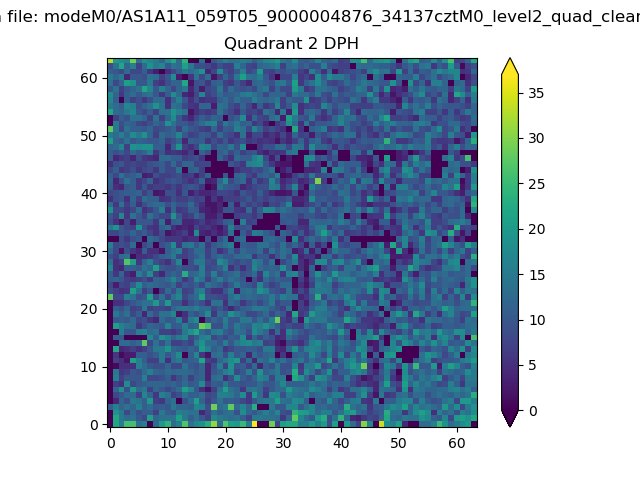
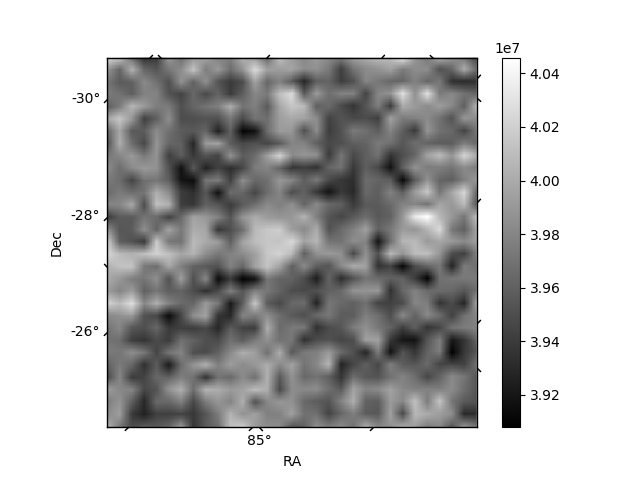
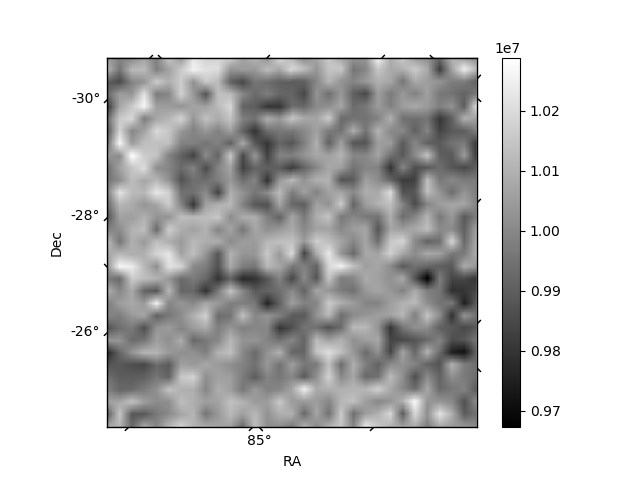
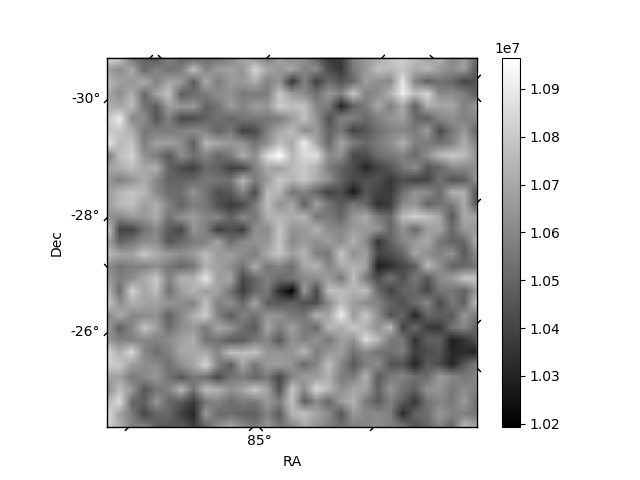
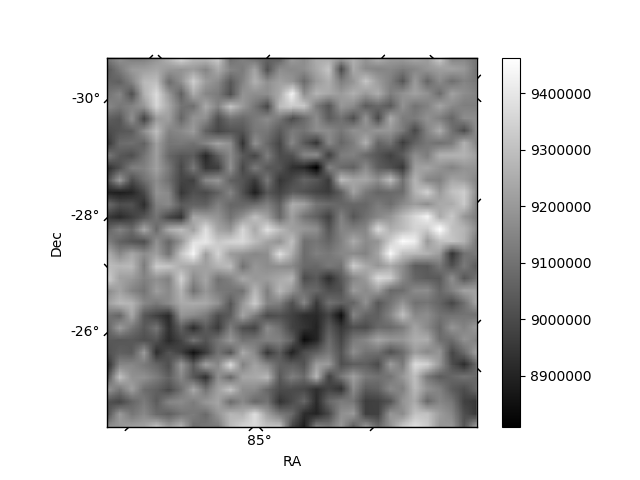
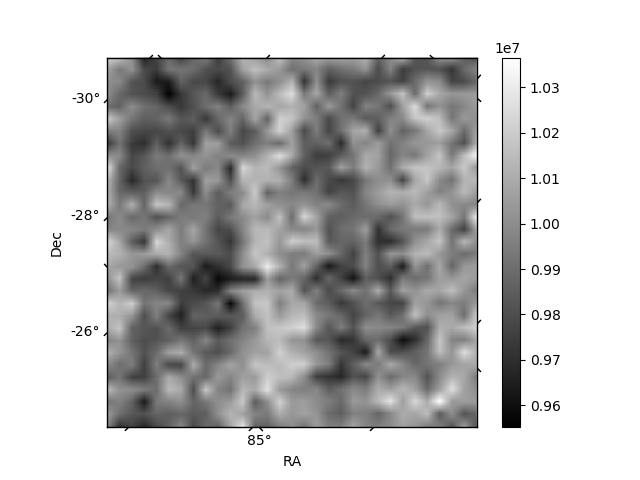
Histogram calculated using DETX and DETY for each event in the final _common_clean file
| Quadrant A | 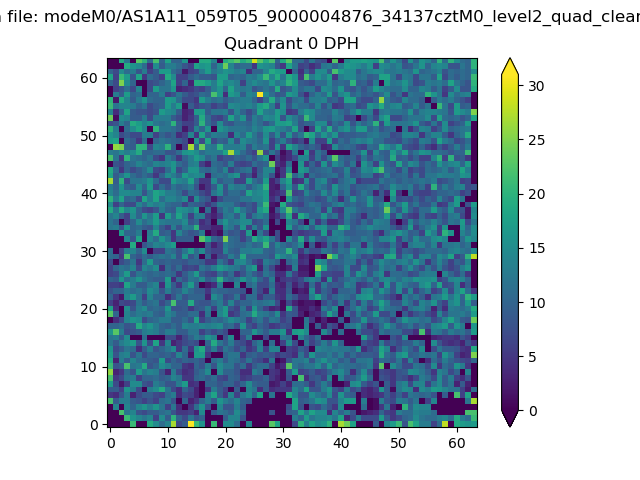 |
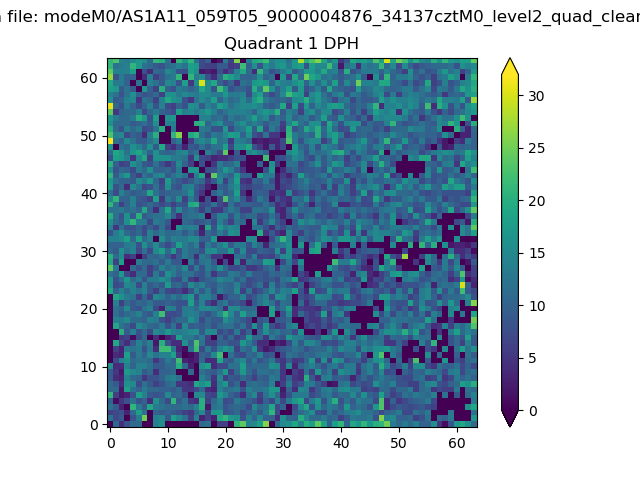 |
Quadrant B |
|---|---|---|---|
| Quadrant D | 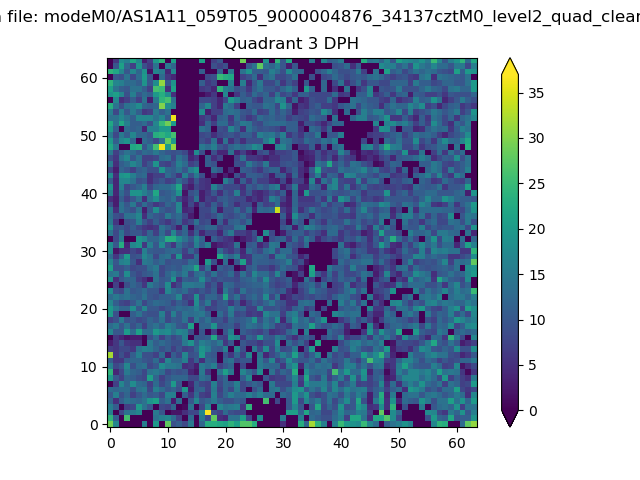 |
 |
Quadrant C |
| Plot type | Count rate plots | Images |
|---|---|---|
| Comparison with Poisson distribution Blue bars denote a histogram of data divided into 1 sec bins. Red curve is a Poisson curve with rate = median count rate of data. |
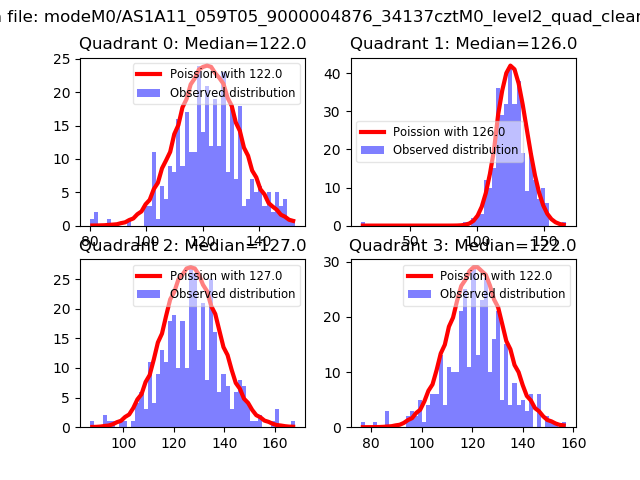 |
 |
| Quadrant-wise count rates Data is divided into 100 sec bins |
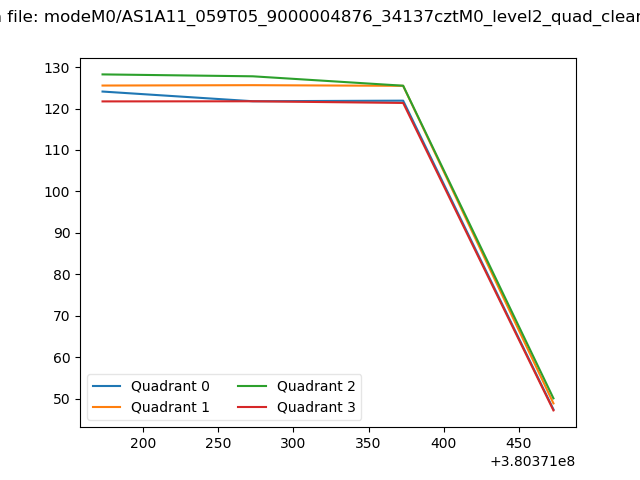 |
|
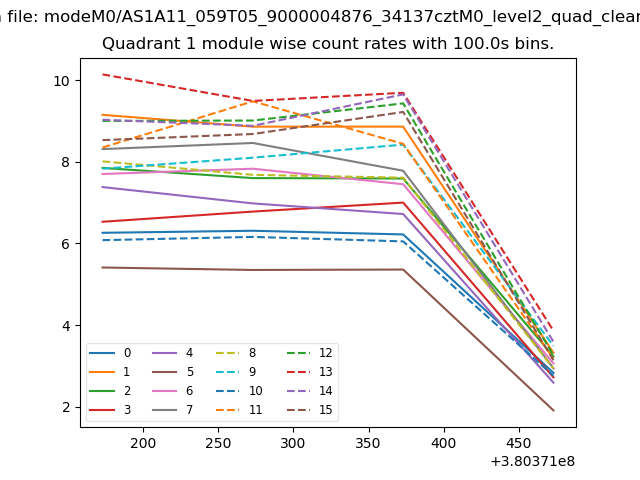
| Module-wise count rates for Quadrant A Data is divided into 100 sec bins |
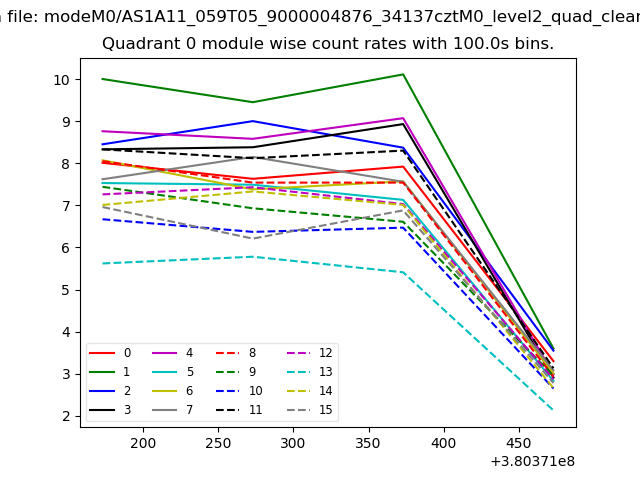 |
 |
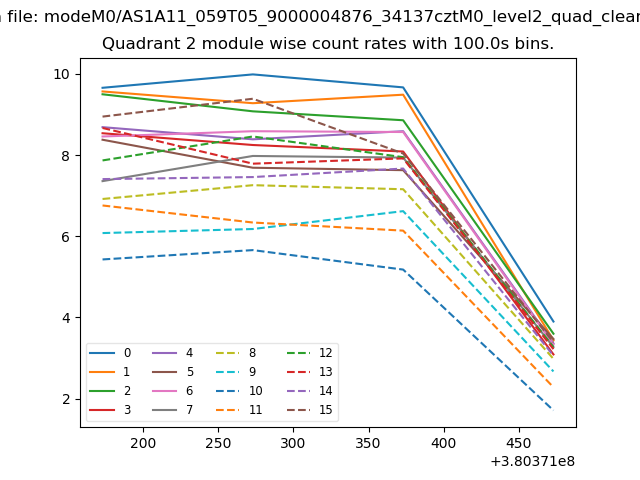
| Module-wise count rates for Quadrant B Data is divided into 100 sec bins |
 |
 |
| Module-wise count rates for Quadrant C Data is divided into 100 sec bins |
 |
 |
| Module-wise count rates for Quadrant D Data is divided into 100 sec bins |
 |
 |
| Parameter | Plot |
|---|---|
| CZT HV Monitor | 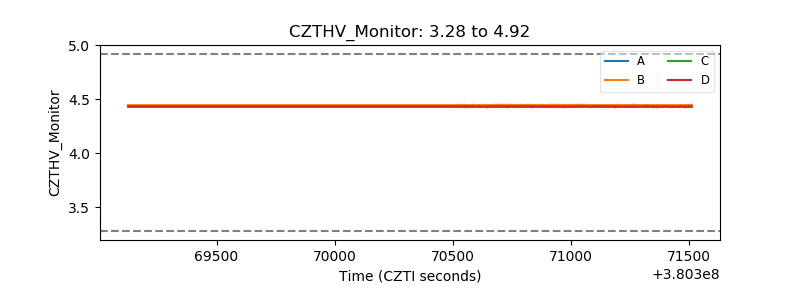 |
| D_VDD | 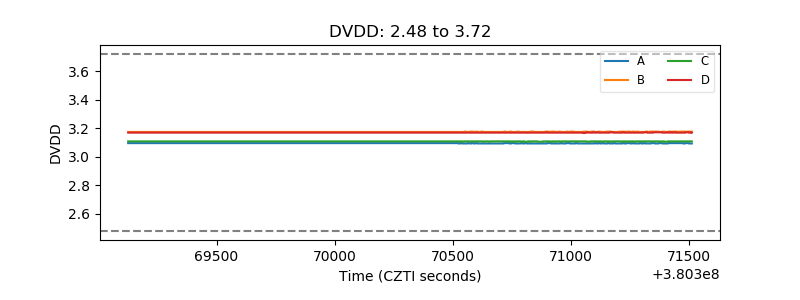 |
| Temperature 1 | 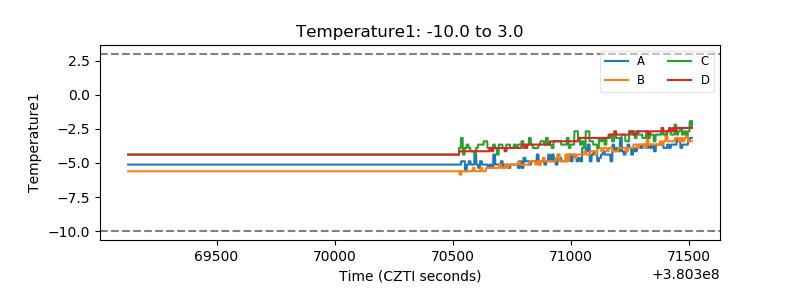 |
| Veto HV Monitor | 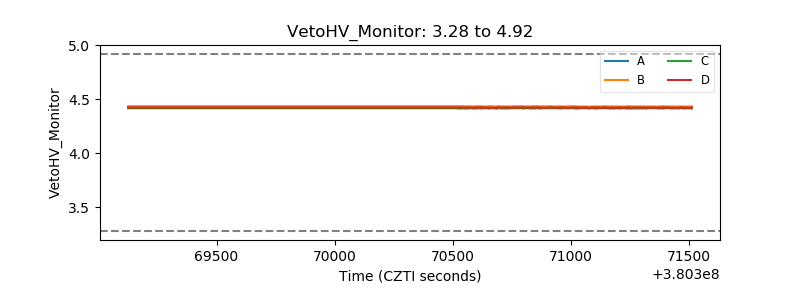 |
| Veto LLD | 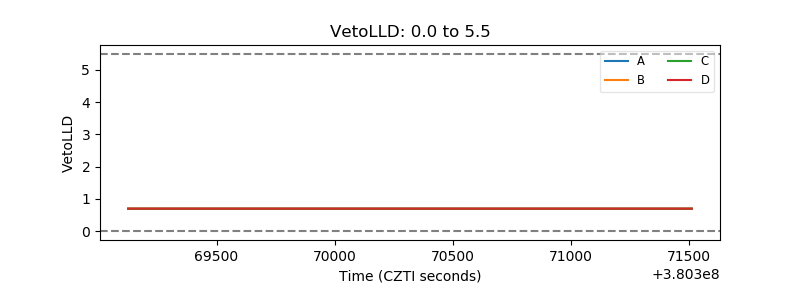 |
| Alpha Counter | 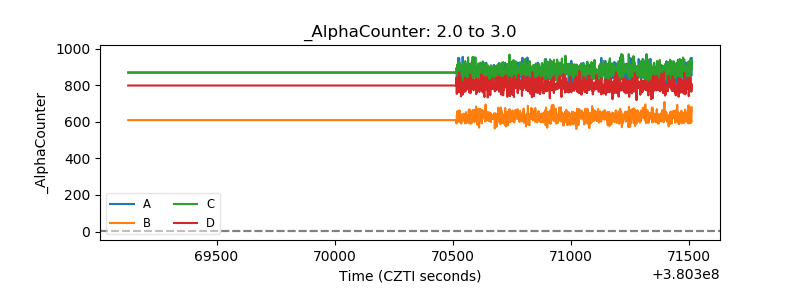 |
| _CPM_Rate | 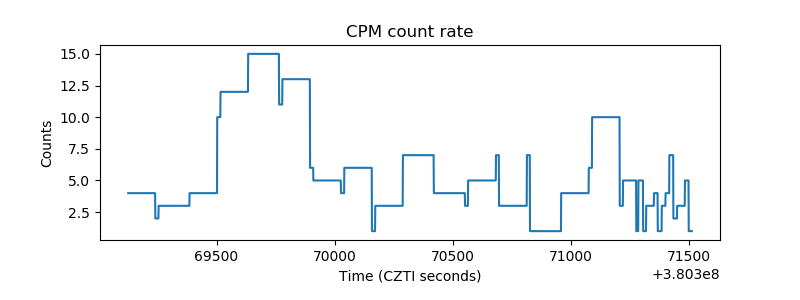 |
| CZT Counter | 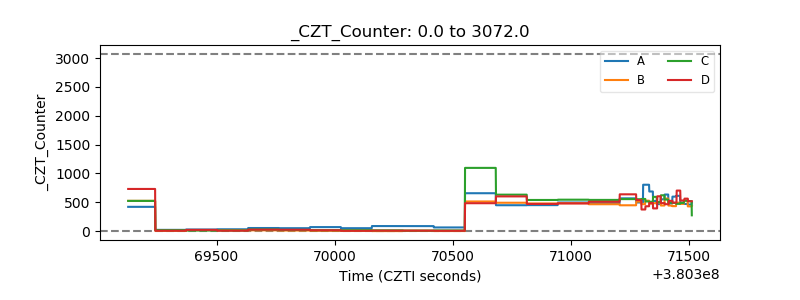 |
| +2.5 Volts monitor |  |
| +5 Volts monitor |  |
| _ROLL_ROT | 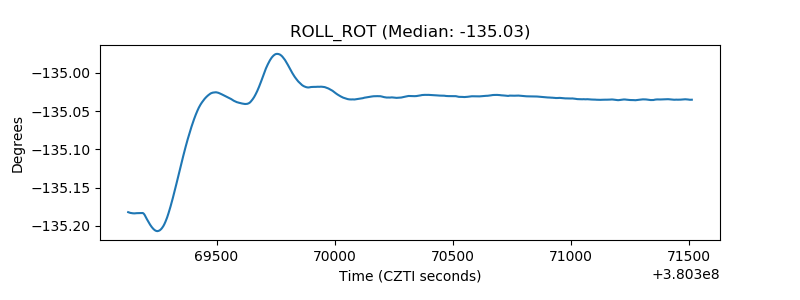 |
| _Roll_DEC | 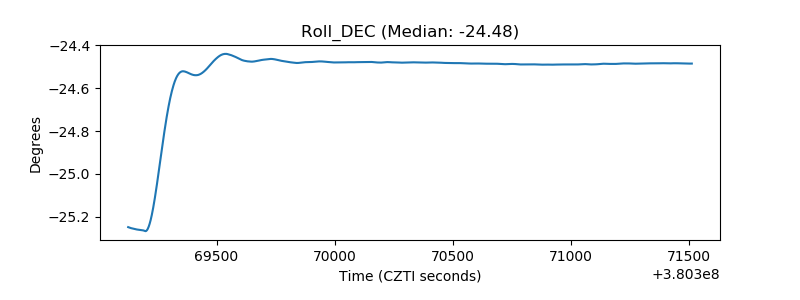 |
| _Roll_RA | 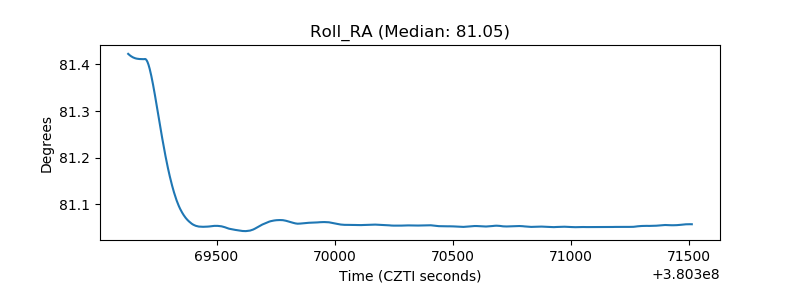 |
| Veto Counter | 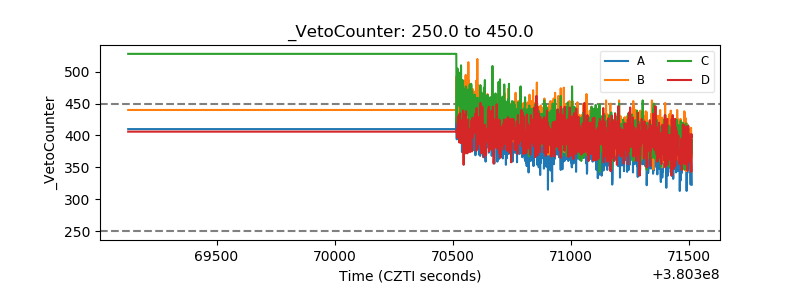 |