| Param | Original file | Final file |
|---|---|---|
| Filename | modeM0/AS1A11_059T05_9000004876_34142cztM0_level2.evt | modeM0/AS1A11_059T05_9000004876_34142cztM0_level2_quad_clean.evt |
| Size (bytes) | 662,713,920 | 66,744,000 |
| Size | 632.0 MB | 63.7 MB |
| Events in quadrant A | 2,565,008 | 444,781 |
| Events in quadrant B | 8,957,578 | 342,533 |
| Events in quadrant C | 3,504,247 | 430,546 |
| Events in quadrant D | 4,660,968 | 406,759 |
| Mode M9 | |||
|---|---|---|---|
| Quadrant | BADHDUFLAG | Total packets | Discarded packets |
| A | 0 | 16 | 0 |
| B | 0 | 16 | 0 |
| C | 0 | 16 | 0 |
| D | 0 | 17 | 0 |
| Mode M0 | |||
|---|---|---|---|
| Quadrant | BADHDUFLAG | Total packets | Discarded packets |
| A | 0 | 11426 | 3 |
| B | 0 | 30241 | 2 |
| C | 0 | 14013 | 2 |
| D | 0 | 17687 | 2 |
| Mode SS | |||
|---|---|---|---|
| Quadrant | BADHDUFLAG | Total packets | Discarded packets |
| A | 0 | 116 | 0 |
| B | 0 | 116 | 0 |
| C | 0 | 116 | 0 |
| D | 0 | 116 | 0 |
| Quadrant | Total seconds | Saturated seconds | Saturation percentage |
|---|---|---|---|
| A | 5649 | 5 | 0.088511% |
| B | 5649 | 2820 | 49.920340% |
| C | 5649 | 173 | 3.062489% |
| D | 5649 | 219 | 3.876792% |
Noise dominated data is calculated using 1-second bins in cleaned event files. If a bin has >2000 counts, and if more than 50% of those come from <1% of pixels, then it is considered to be noise-dominated and hence unusable.
| Quadrant | # 1 sec bins | Bins with >0 counts | Bins with >2000 counts | High rate bins dominated by noise | Noise dominated (total time) | Noise dominated (detector-on time) | Marked lightcurve |
|---|---|---|---|---|---|---|---|
| A | 7262 | 5650 | 1 | 1 | 0.01% | 0.02% |  |
| B | 7262 | 5650 | 2761 | 2761 | 38.02% | 48.87% | 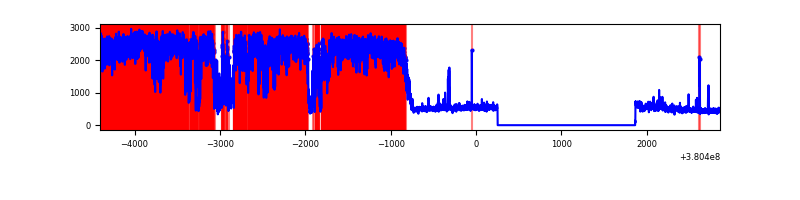 |
| C | 7262 | 5650 | 144 | 144 | 1.98% | 2.55% | 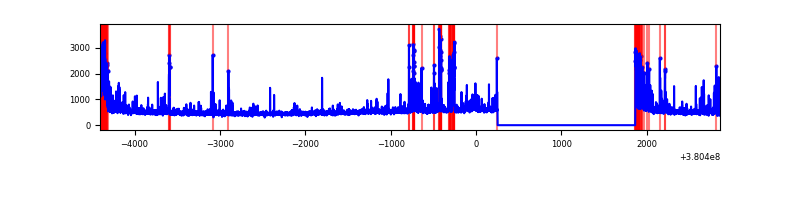 |
| D | 7262 | 5650 | 214 | 214 | 2.95% | 3.79% | 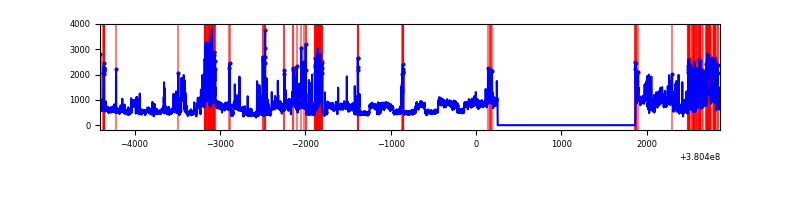 |
Top three noisy pixels from each quadrant. If the there are fewer than three noisy pixels in the level2.evt file, extra rows are filled as -1
| Pixel properties | Quadrant properties | ||||||
|---|---|---|---|---|---|---|---|
| Quadrant | DetID | PixID | Counts | Sigma | Mean | Median | Sigma |
| A | 10 | 83 | 21819 | 159.67 | 655 | 642 | 132.6 |
| A | 13 | 254 | 11242 | 79.92 | 655 | 642 | 132.6 |
| A | 3 | 137 | 6772 | 46.22 | 655 | 642 | 132.6 |
| B | 5 | 31 | 3615976 | 34971.93 | 537 | 523 | 103.4 |
| B | 5 | 15 | 2386092 | 23075.38 | 537 | 523 | 103.4 |
| B | 5 | 14 | 654862 | 6329.36 | 537 | 523 | 103.4 |
| C | 0 | 10 | 652341 | 4472.93 | 626 | 632 | 145.7 |
| C | 15 | 214 | 242426 | 1659.52 | 626 | 632 | 145.7 |
| C | 14 | 254 | 126506 | 863.92 | 626 | 632 | 145.7 |
| D | 8 | 195 | 1113609 | 7263.07 | 626 | 608 | 153.2 |
| D | 10 | 118 | 620009 | 4042.0 | 626 | 608 | 153.2 |
| D | 7 | 80 | 198424 | 1290.88 | 626 | 608 | 153.2 |
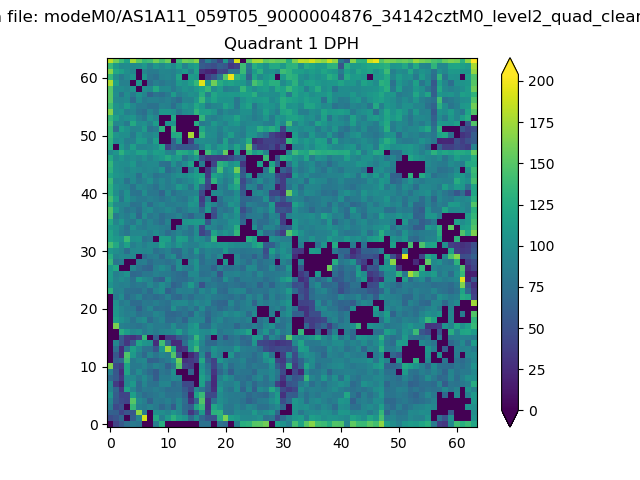
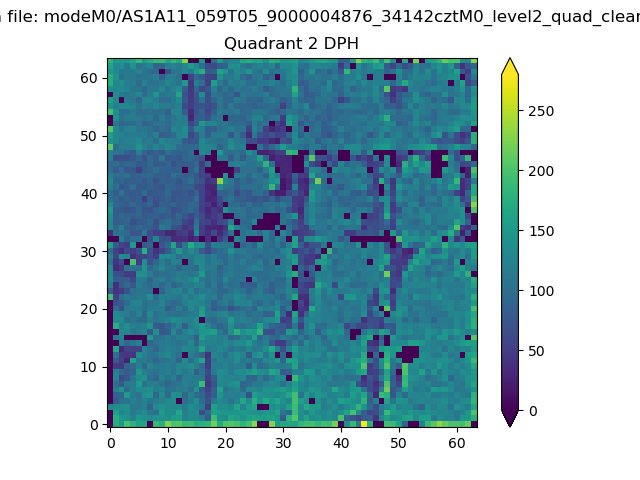
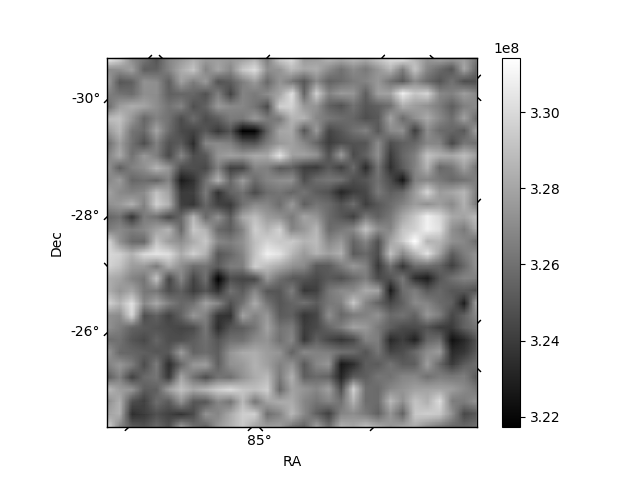
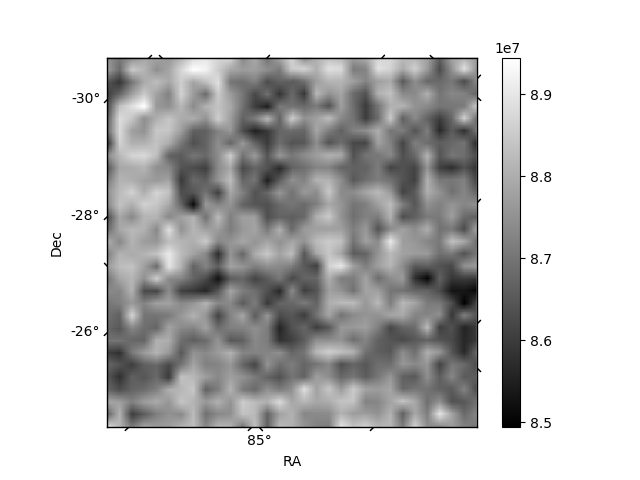
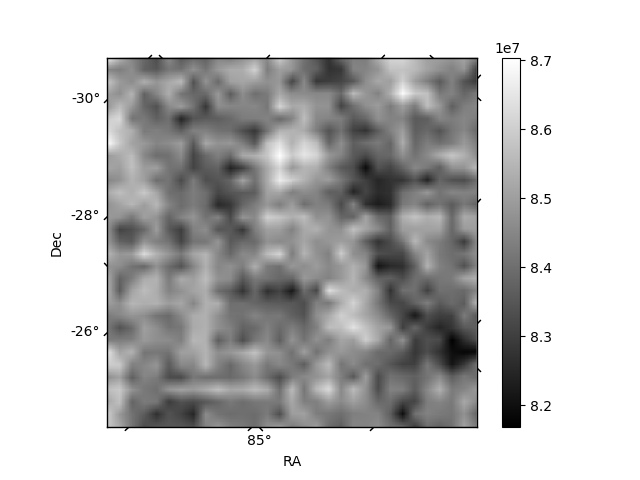
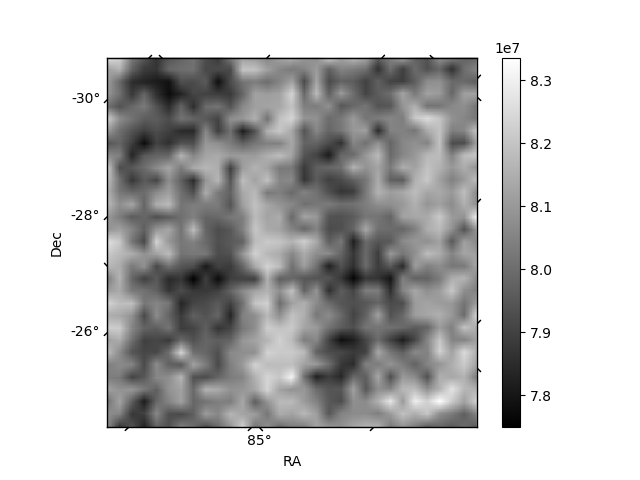
Histogram calculated using DETX and DETY for each event in the final _common_clean file
| Quadrant A | 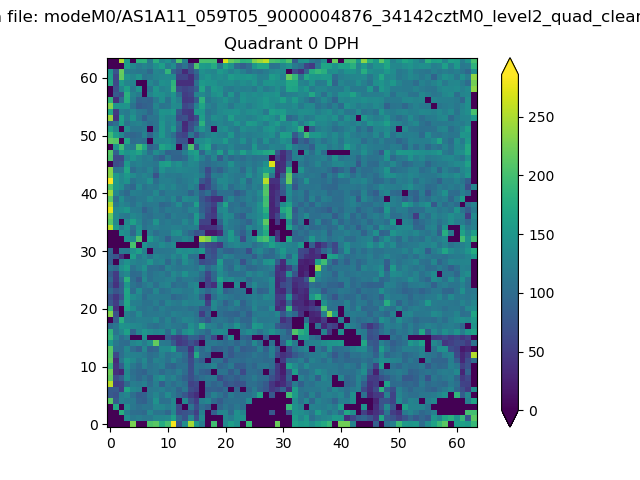 |
 |
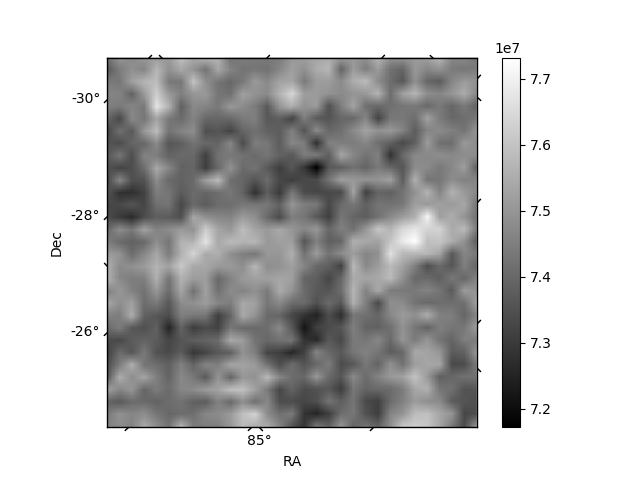
Quadrant B |
|---|---|---|---|
| Quadrant D | 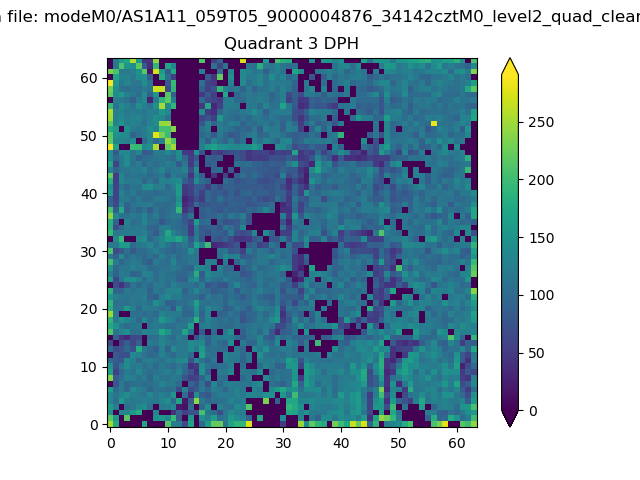 |
 |
Quadrant C |
| Plot type | Count rate plots | Images |
|---|---|---|
| Comparison with Poisson distribution Blue bars denote a histogram of data divided into 1 sec bins. Red curve is a Poisson curve with rate = median count rate of data. |
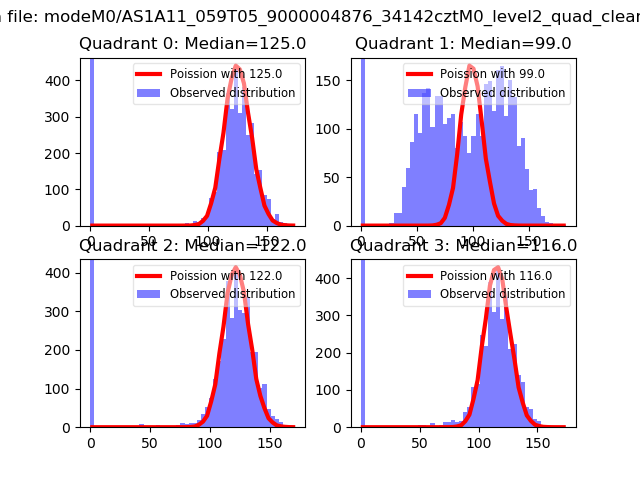 |
 |
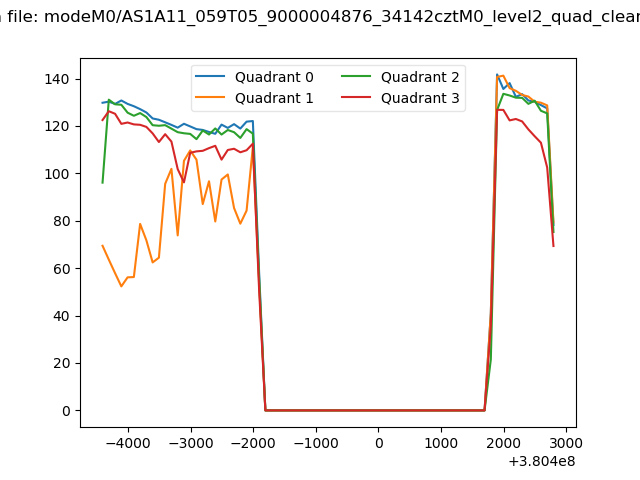
| Quadrant-wise count rates Data is divided into 100 sec bins |
 |
|
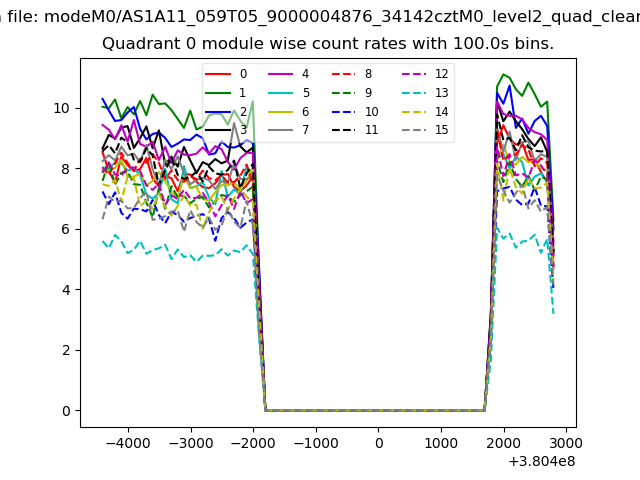
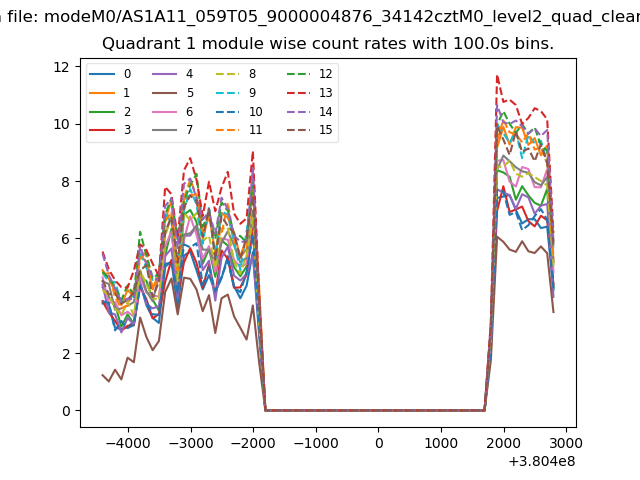
| Module-wise count rates for Quadrant A Data is divided into 100 sec bins |
 |
 |
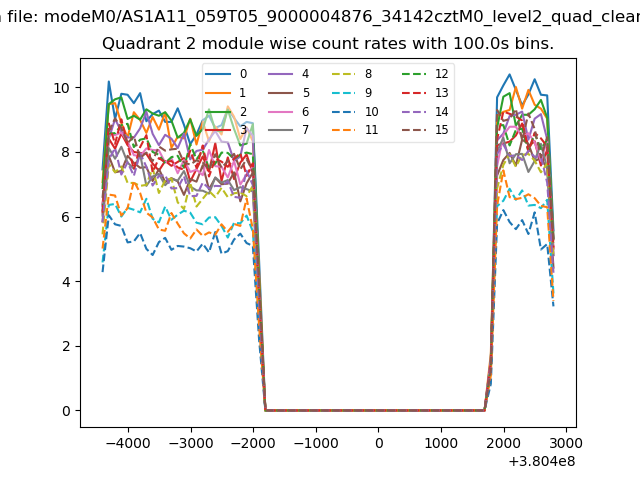
| Module-wise count rates for Quadrant B Data is divided into 100 sec bins |
 |
 |
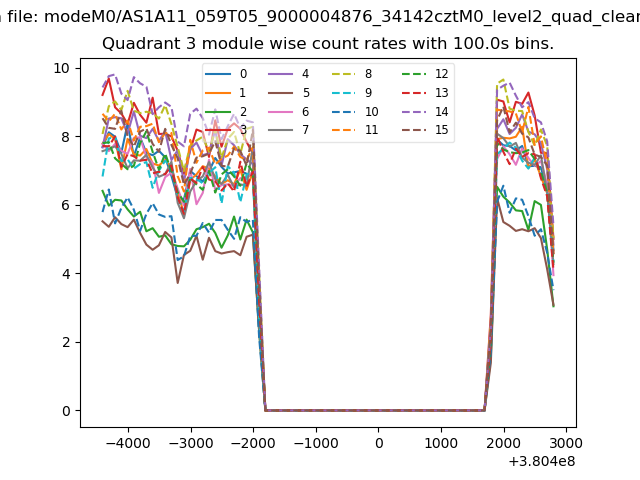
| Module-wise count rates for Quadrant C Data is divided into 100 sec bins |
 |
 |
| Module-wise count rates for Quadrant D Data is divided into 100 sec bins |
 |
 |
| Parameter | Plot |
|---|---|
| CZT HV Monitor | 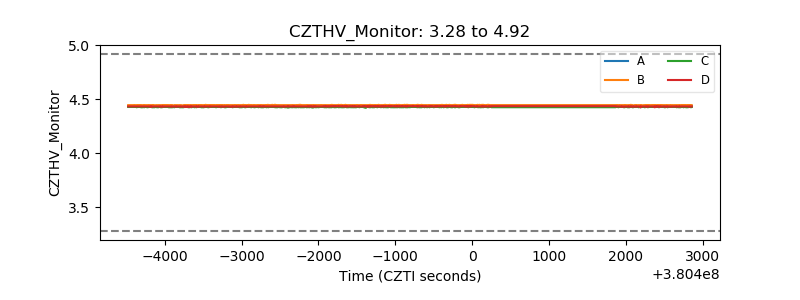 |
| D_VDD | 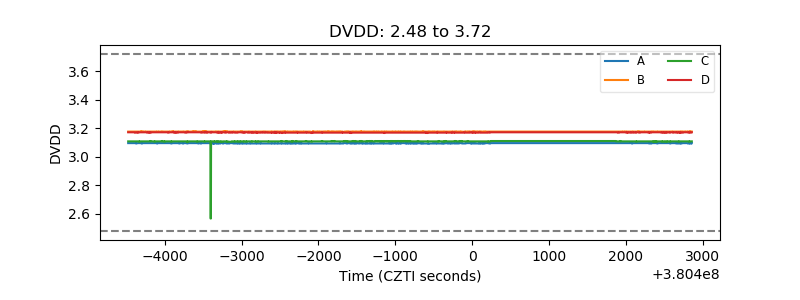 |
| Temperature 1 | 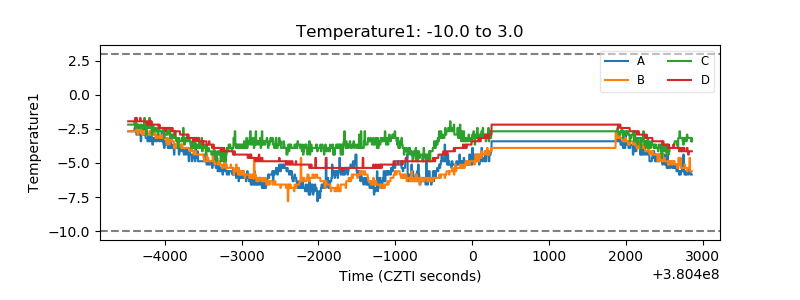 |
| Veto HV Monitor | 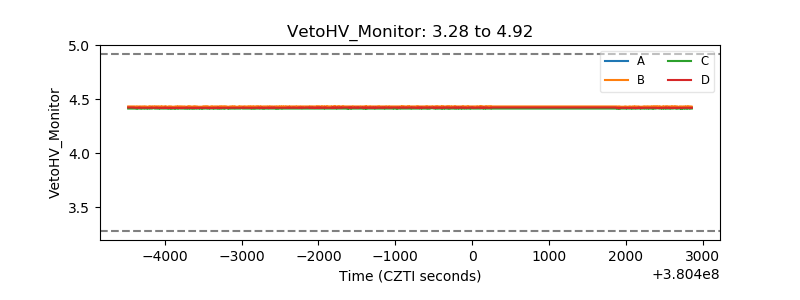 |
| Veto LLD | 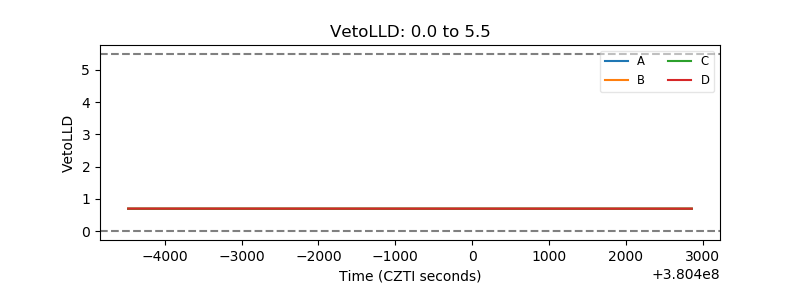 |
| Alpha Counter | 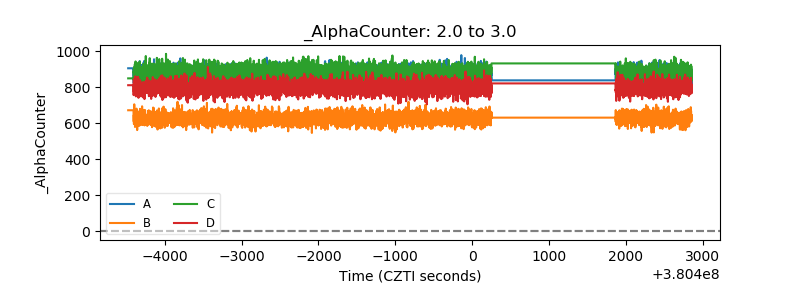 |
| _CPM_Rate | 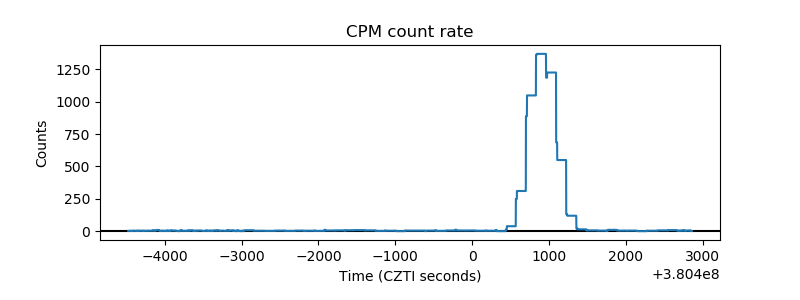 |
| CZT Counter | 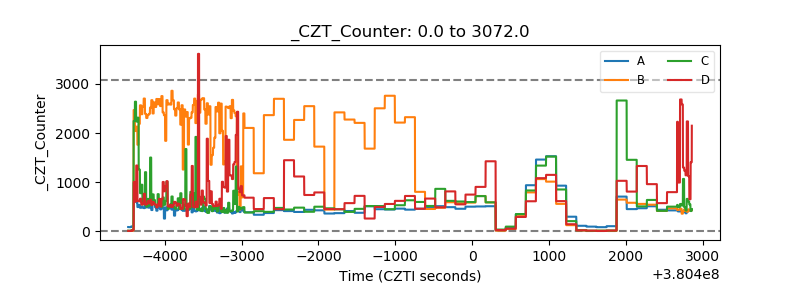 |
| +2.5 Volts monitor | 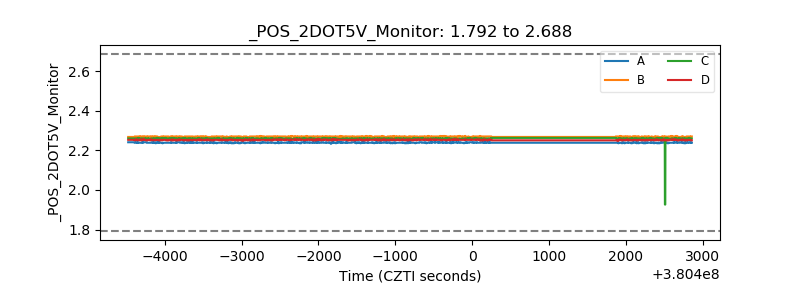 |
| +5 Volts monitor |  |
| _ROLL_ROT | 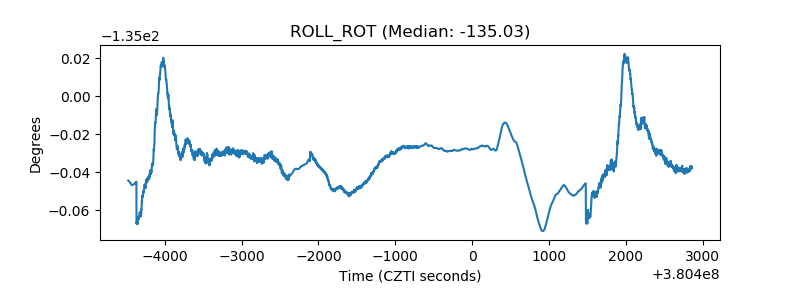 |
| _Roll_DEC | 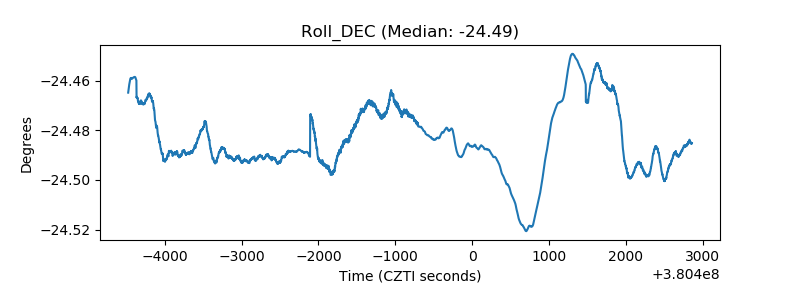 |
| _Roll_RA | 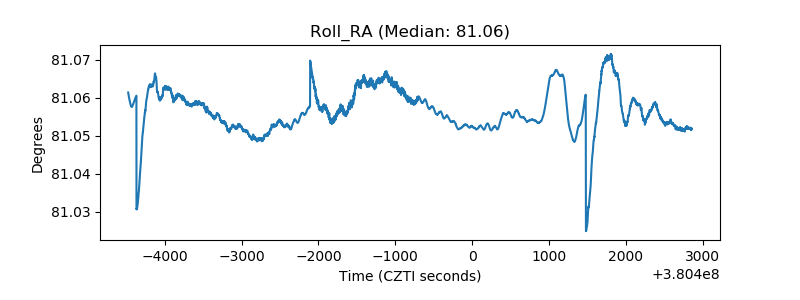 |
| Veto Counter | 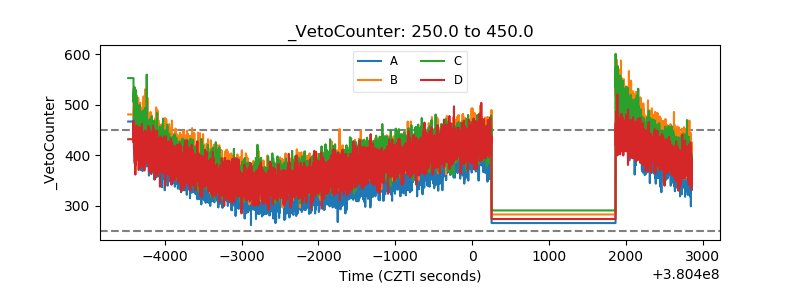 |