| Param | Original file | Final file |
|---|---|---|
| Filename | modeM0/AS1A11_059T05_9000004876_34144cztM0_level2.evt | modeM0/AS1A11_059T05_9000004876_34144cztM0_level2_quad_clean.evt |
| Size (bytes) | 694,100,160 | 62,916,480 |
| Size | 661.9 MB | 60.0 MB |
| Events in quadrant A | 2,639,273 | 418,230 |
| Events in quadrant B | 9,573,946 | 333,826 |
| Events in quadrant C | 3,295,076 | 405,168 |
| Events in quadrant D | 5,145,207 | 366,900 |
| Mode M9 | |||
|---|---|---|---|
| Quadrant | BADHDUFLAG | Total packets | Discarded packets |
| A | 0 | 22 | 0 |
| B | 0 | 22 | 0 |
| C | 0 | 22 | 0 |
| D | 0 | 23 | 0 |
| Mode M0 | |||
|---|---|---|---|
| Quadrant | BADHDUFLAG | Total packets | Discarded packets |
| A | 0 | 11553 | 3 |
| B | 0 | 32138 | 2 |
| C | 0 | 13027 | 2 |
| D | 0 | 19009 | 2 |
| Mode SS | |||
|---|---|---|---|
| Quadrant | BADHDUFLAG | Total packets | Discarded packets |
| A | 0 | 110 | 0 |
| B | 0 | 110 | 0 |
| C | 0 | 110 | 0 |
| D | 0 | 110 | 0 |
| Quadrant | Total seconds | Saturated seconds | Saturation percentage |
|---|---|---|---|
| A | 5428 | 3 | 0.055269% |
| B | 5428 | 3451 | 63.577745% |
| C | 5428 | 107 | 1.971260% |
| D | 5428 | 433 | 7.977155% |
Noise dominated data is calculated using 1-second bins in cleaned event files. If a bin has >2000 counts, and if more than 50% of those come from <1% of pixels, then it is considered to be noise-dominated and hence unusable.
| Quadrant | # 1 sec bins | Bins with >0 counts | Bins with >2000 counts | High rate bins dominated by noise | Noise dominated (total time) | Noise dominated (detector-on time) | Marked lightcurve |
|---|---|---|---|---|---|---|---|
| A | 7189 | 5429 | 0 | 0 | 0.00% | 0.00% | 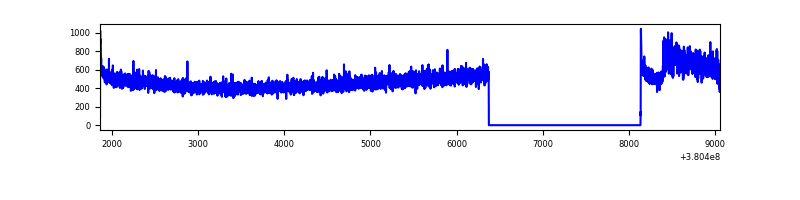 |
| B | 7189 | 5429 | 3285 | 3285 | 45.69% | 60.51% | 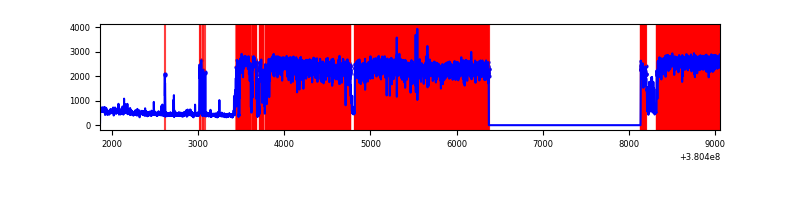 |
| C | 7189 | 5429 | 104 | 104 | 1.45% | 1.92% | 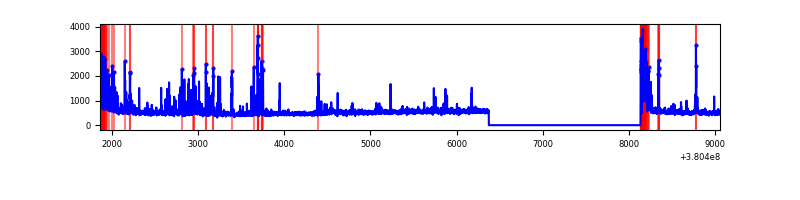 |
| D | 7189 | 5429 | 470 | 470 | 6.54% | 8.66% | 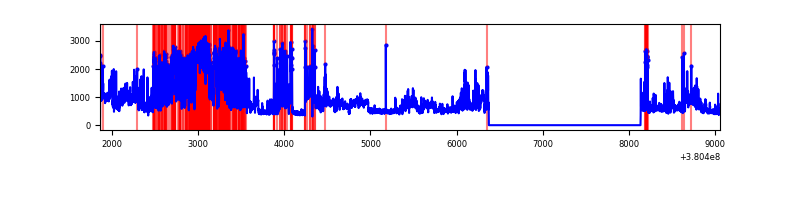 |
Top three noisy pixels from each quadrant. If the there are fewer than three noisy pixels in the level2.evt file, extra rows are filled as -1
| Pixel properties | Quadrant properties | ||||||
|---|---|---|---|---|---|---|---|
| Quadrant | DetID | PixID | Counts | Sigma | Mean | Median | Sigma |
| A | 15 | 169 | 150824 | 1174.14 | 637 | 625 | 127.9 |
| A | 10 | 83 | 21223 | 161.02 | 637 | 625 | 127.9 |
| A | 13 | 254 | 9176 | 66.84 | 637 | 625 | 127.9 |
| B | 5 | 31 | 3104839 | 34525.93 | 468 | 457 | 89.9 |
| B | 5 | 15 | 2797827 | 31111.44 | 468 | 457 | 89.9 |
| B | 5 | 14 | 1498602 | 16661.88 | 468 | 457 | 89.9 |
| C | 0 | 10 | 504096 | 3515.67 | 617 | 623 | 143.2 |
| C | 15 | 214 | 232637 | 1620.11 | 617 | 623 | 143.2 |
| C | 14 | 254 | 108164 | 750.94 | 617 | 623 | 143.2 |
| D | 10 | 118 | 1674258 | 11342.14 | 600 | 584 | 147.6 |
| D | 8 | 195 | 807094 | 5465.55 | 600 | 584 | 147.6 |
| D | 7 | 223 | 191748 | 1295.48 | 600 | 584 | 147.6 |
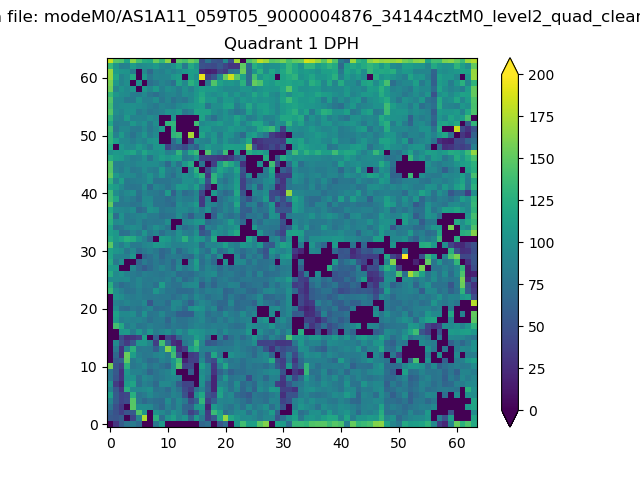
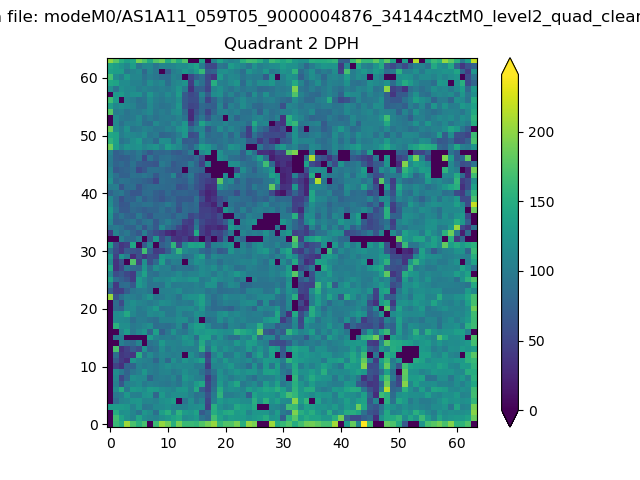
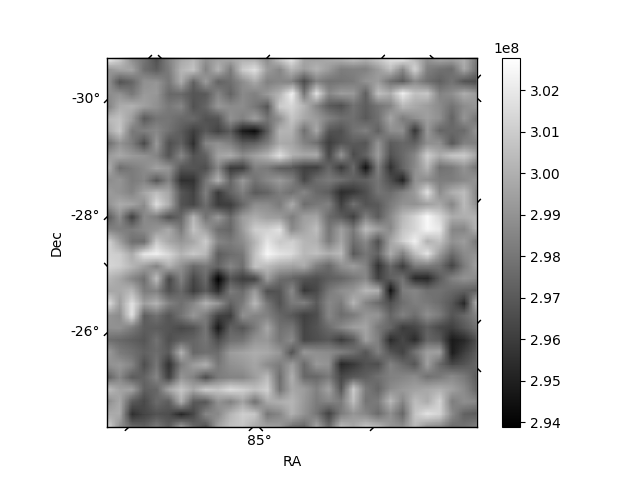
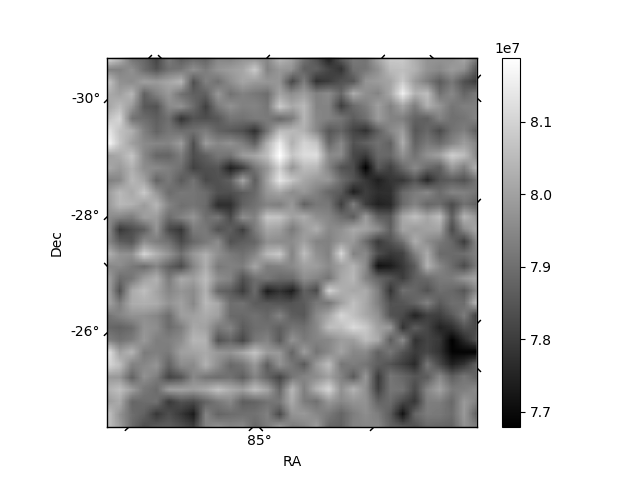
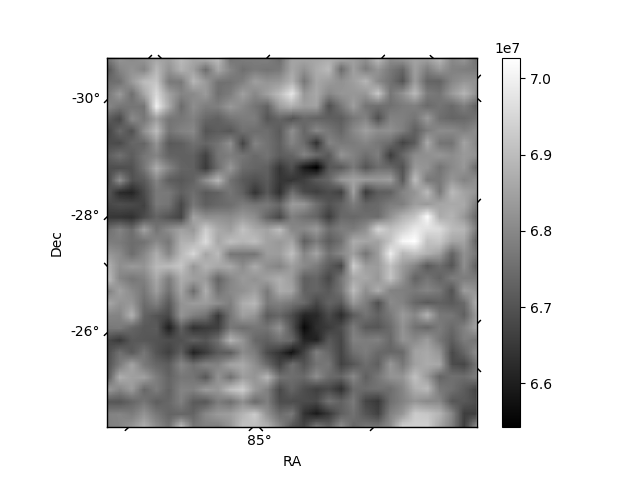
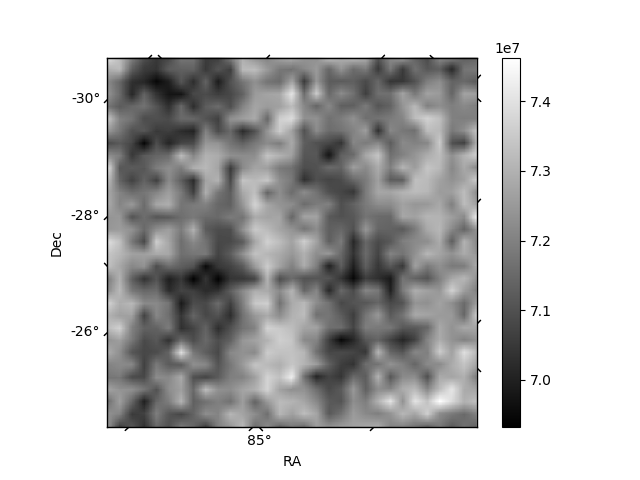
Histogram calculated using DETX and DETY for each event in the final _common_clean file
| Quadrant A |  |
 |
Quadrant B |
|---|---|---|---|
| Quadrant D | 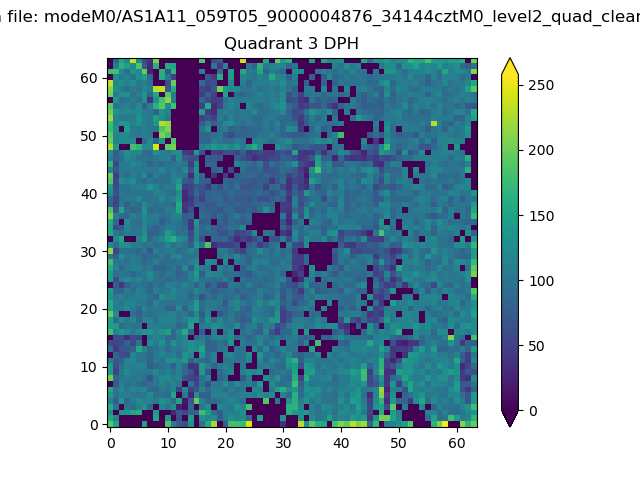 |
 |
Quadrant C |
| Plot type | Count rate plots | Images |
|---|---|---|
| Comparison with Poisson distribution Blue bars denote a histogram of data divided into 1 sec bins. Red curve is a Poisson curve with rate = median count rate of data. |
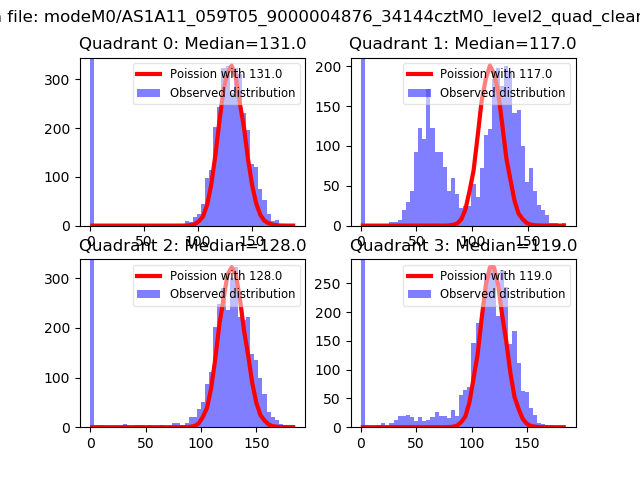 |
 |
| Quadrant-wise count rates Data is divided into 100 sec bins |
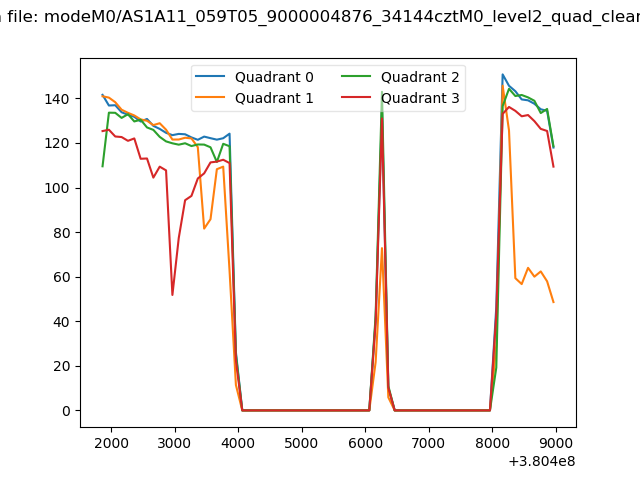 |
|
| Module-wise count rates for Quadrant A Data is divided into 100 sec bins |
 |
 |
| Module-wise count rates for Quadrant B Data is divided into 100 sec bins |
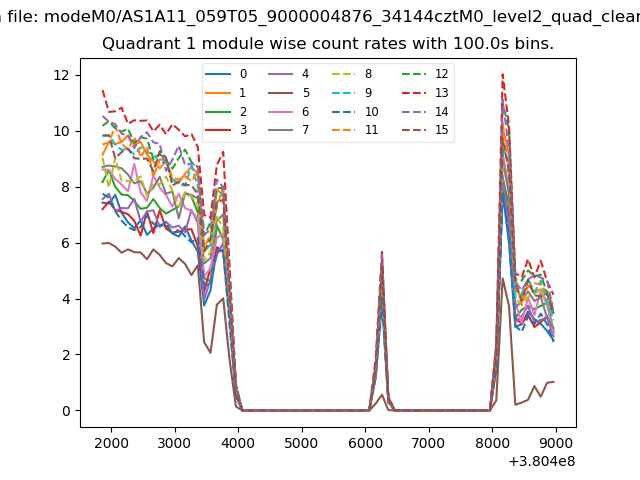 |
 |
| Module-wise count rates for Quadrant C Data is divided into 100 sec bins |
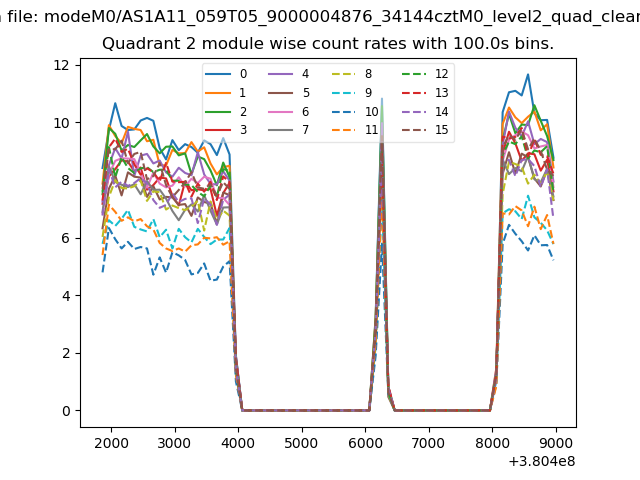 |
 |
| Module-wise count rates for Quadrant D Data is divided into 100 sec bins |
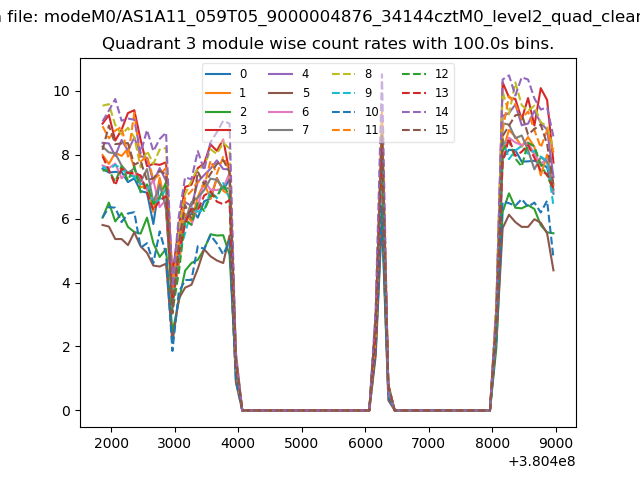 |
 |
| Parameter | Plot |
|---|---|
| CZT HV Monitor | 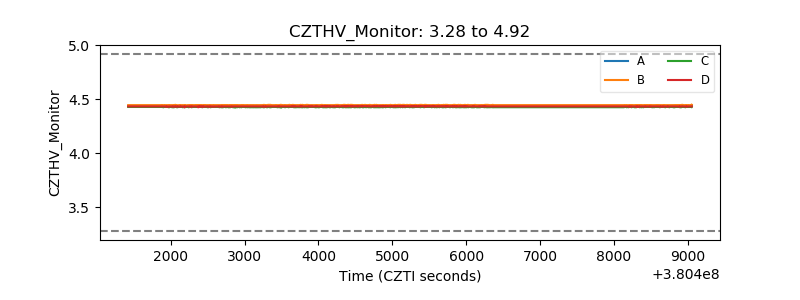 |
| D_VDD | 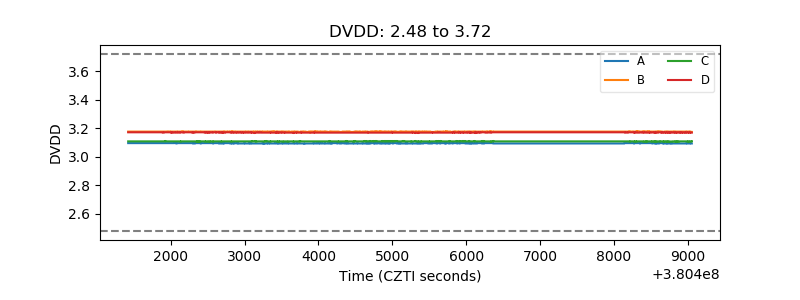 |
| Temperature 1 | 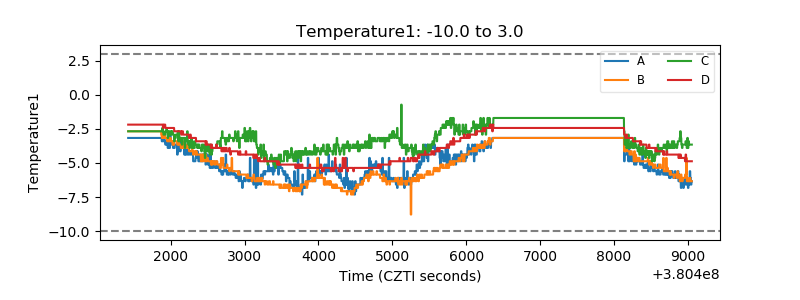 |
| Veto HV Monitor | 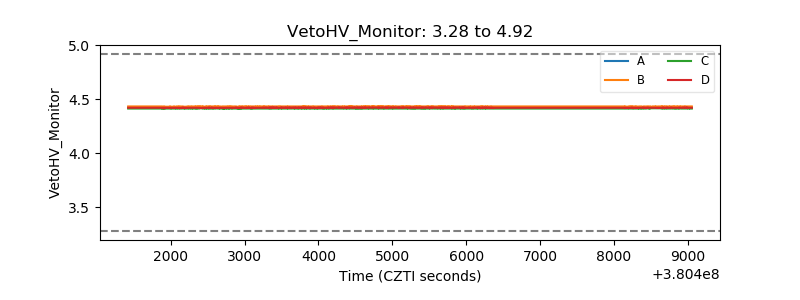 |
| Veto LLD | 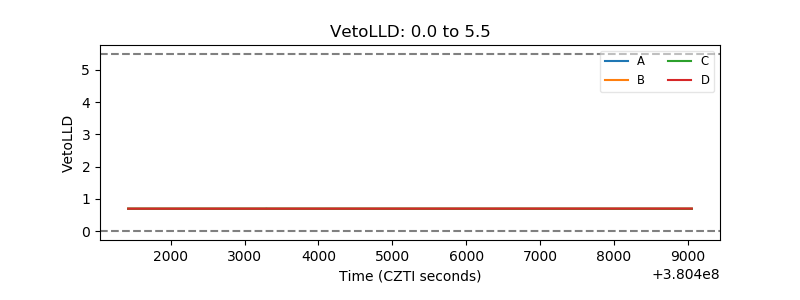 |
| Alpha Counter | 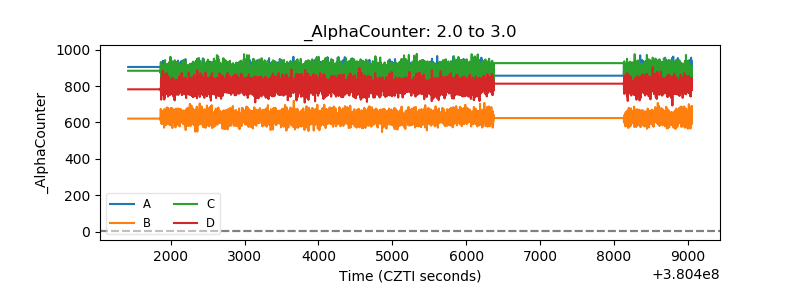 |
| _CPM_Rate | 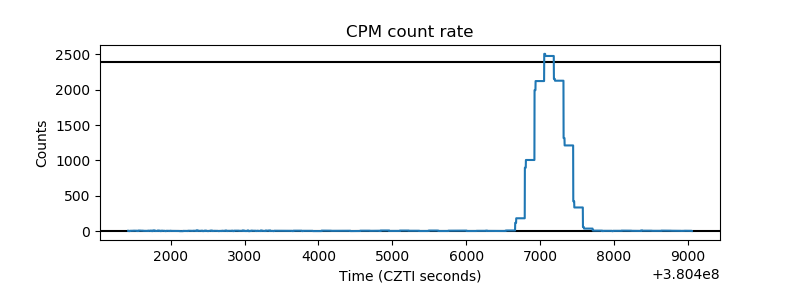 |
| CZT Counter | 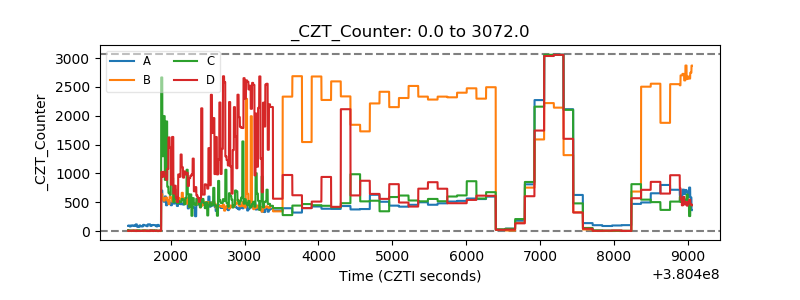 |
| +2.5 Volts monitor |  |
| +5 Volts monitor |  |
| _ROLL_ROT |  |
| _Roll_DEC | 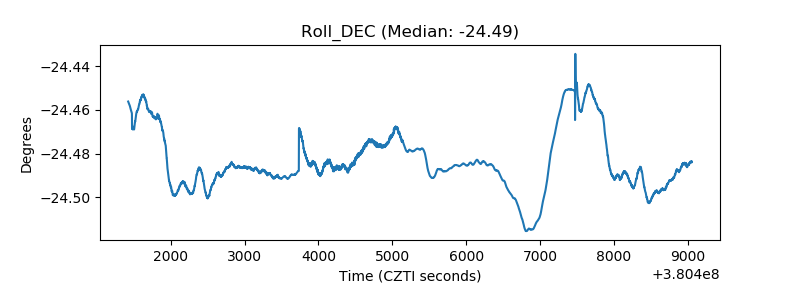 |
| _Roll_RA | 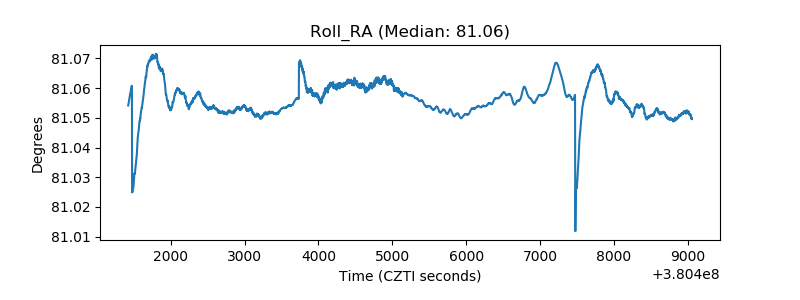 |
| Veto Counter |  |