| Param | Original file | Final file |
|---|---|---|
| Filename | modeM0/AS1A11_059T05_9000004876_34145cztM0_level2.evt | modeM0/AS1A11_059T05_9000004876_34145cztM0_level2_quad_clean.evt |
| Size (bytes) | 733,409,280 | 62,953,920 |
| Size | 699.4 MB | 60.0 MB |
| Events in quadrant A | 2,662,956 | 431,290 |
| Events in quadrant B | 11,887,221 | 278,338 |
| Events in quadrant C | 3,473,021 | 422,440 |
| Events in quadrant D | 3,827,734 | 400,007 |
| Mode M9 | |||
|---|---|---|---|
| Quadrant | BADHDUFLAG | Total packets | Discarded packets |
| A | 0 | 29 | 0 |
| B | 0 | 29 | 0 |
| C | 0 | 29 | 0 |
| D | 0 | 30 | 0 |
| Mode M0 | |||
|---|---|---|---|
| Quadrant | BADHDUFLAG | Total packets | Discarded packets |
| A | 0 | 11362 | 3 |
| B | 0 | 38874 | 2 |
| C | 0 | 13638 | 2 |
| D | 0 | 15054 | 2 |
| Mode SS | |||
|---|---|---|---|
| Quadrant | BADHDUFLAG | Total packets | Discarded packets |
| A | 0 | 108 | 0 |
| B | 0 | 108 | 0 |
| C | 0 | 108 | 0 |
| D | 0 | 108 | 0 |
| Quadrant | Total seconds | Saturated seconds | Saturation percentage |
|---|---|---|---|
| A | 5328 | 7 | 0.131381% |
| B | 5328 | 4450 | 83.521021% |
| C | 5328 | 140 | 2.627628% |
| D | 5328 | 71 | 1.332583% |
Noise dominated data is calculated using 1-second bins in cleaned event files. If a bin has >2000 counts, and if more than 50% of those come from <1% of pixels, then it is considered to be noise-dominated and hence unusable.
| Quadrant | # 1 sec bins | Bins with >0 counts | Bins with >2000 counts | High rate bins dominated by noise | Noise dominated (total time) | Noise dominated (detector-on time) | Marked lightcurve |
|---|---|---|---|---|---|---|---|
| A | 7211 | 5329 | 0 | 0 | 0.00% | 0.00% | 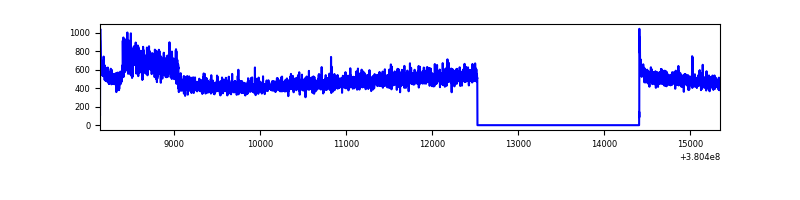 |
| B | 7211 | 5329 | 4348 | 4348 | 60.30% | 81.59% | 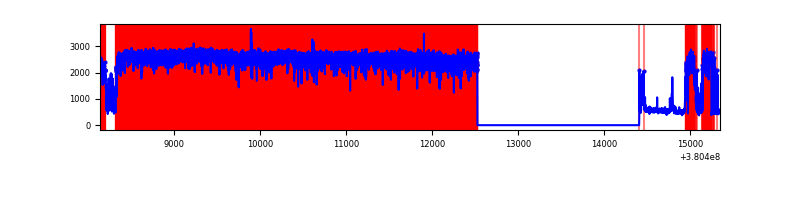 |
| C | 7211 | 5329 | 108 | 108 | 1.50% | 2.03% | 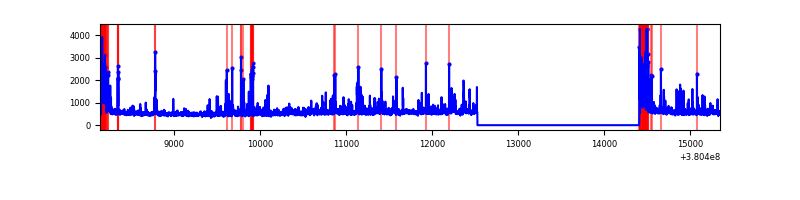 |
| D | 7211 | 5329 | 84 | 84 | 1.16% | 1.58% | 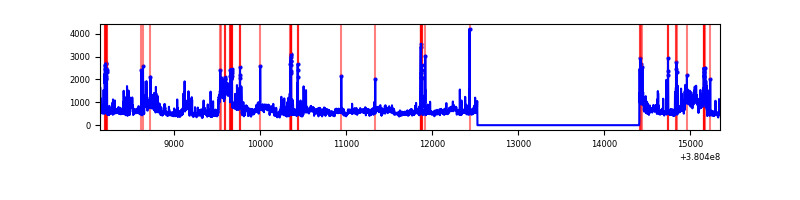 |
Top three noisy pixels from each quadrant. If the there are fewer than three noisy pixels in the level2.evt file, extra rows are filled as -1
| Pixel properties | Quadrant properties | ||||||
|---|---|---|---|---|---|---|---|
| Quadrant | DetID | PixID | Counts | Sigma | Mean | Median | Sigma |
| A | 15 | 169 | 150962 | 1172.68 | 641 | 628 | 128.2 |
| A | 10 | 83 | 20679 | 156.41 | 641 | 628 | 128.2 |
| A | 13 | 6 | 11871 | 87.7 | 641 | 628 | 128.2 |
| B | 5 | 31 | 4329015 | 60370.13 | 373 | 364 | 71.7 |
| B | 5 | 15 | 3810907 | 53144.27 | 373 | 364 | 71.7 |
| B | 5 | 14 | 1996646 | 27841.42 | 373 | 364 | 71.7 |
| C | 0 | 10 | 472810 | 3246.74 | 626 | 634 | 145.4 |
| C | 15 | 214 | 227664 | 1561.09 | 626 | 634 | 145.4 |
| C | 14 | 254 | 226806 | 1555.19 | 626 | 634 | 145.4 |
| D | 8 | 195 | 696243 | 4501.87 | 623 | 606 | 154.5 |
| D | 7 | 223 | 234410 | 1513.08 | 623 | 606 | 154.5 |
| D | 10 | 118 | 203140 | 1310.71 | 623 | 606 | 154.5 |
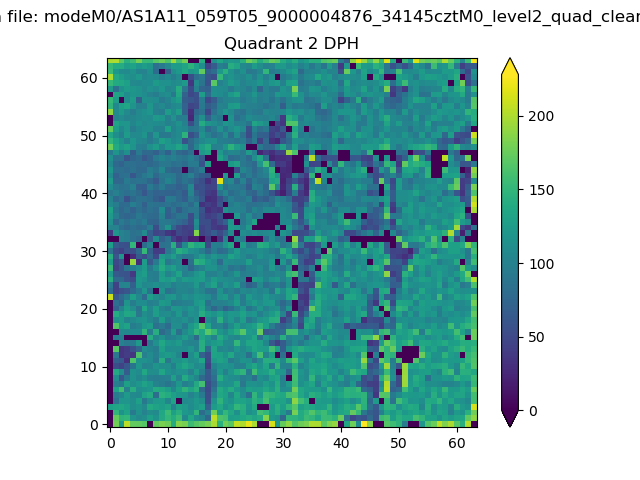
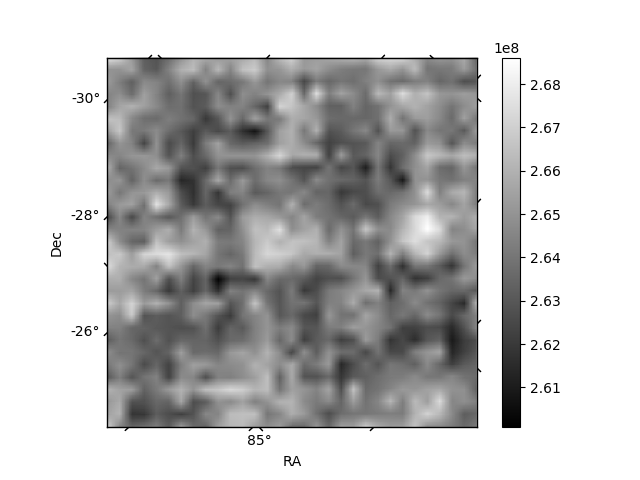
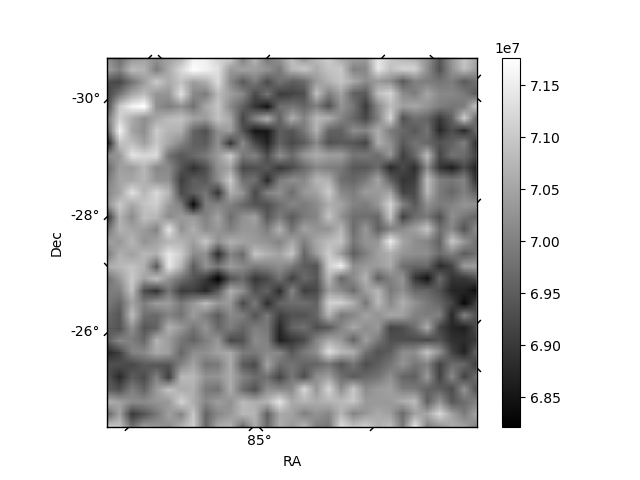
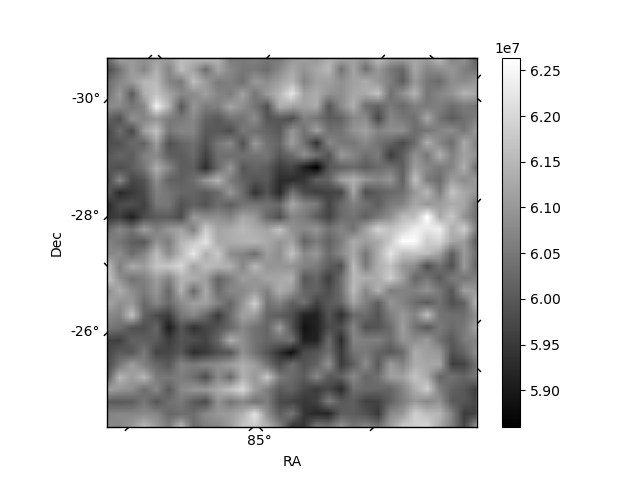
Histogram calculated using DETX and DETY for each event in the final _common_clean file
| Quadrant A | 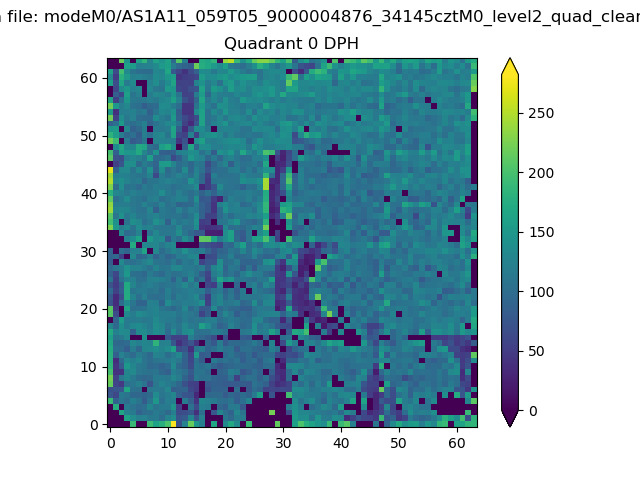 |
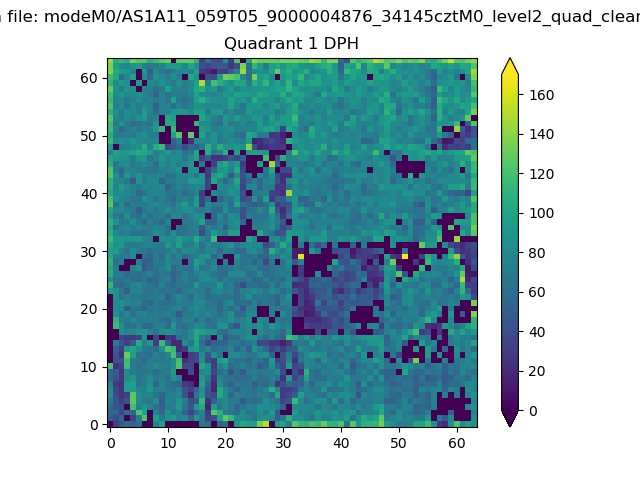 |
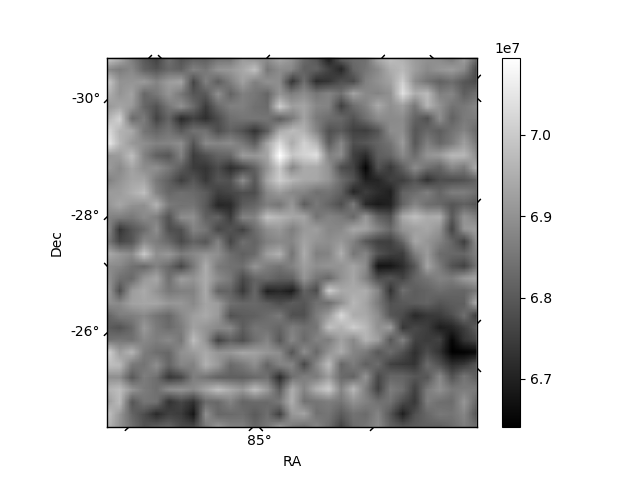
Quadrant B |
|---|---|---|---|
| Quadrant D | 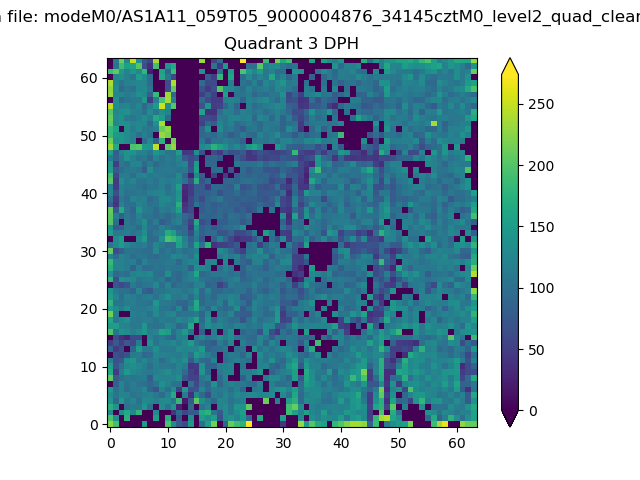 |
 |
Quadrant C |
| Plot type | Count rate plots | Images |
|---|---|---|
| Comparison with Poisson distribution Blue bars denote a histogram of data divided into 1 sec bins. Red curve is a Poisson curve with rate = median count rate of data. |
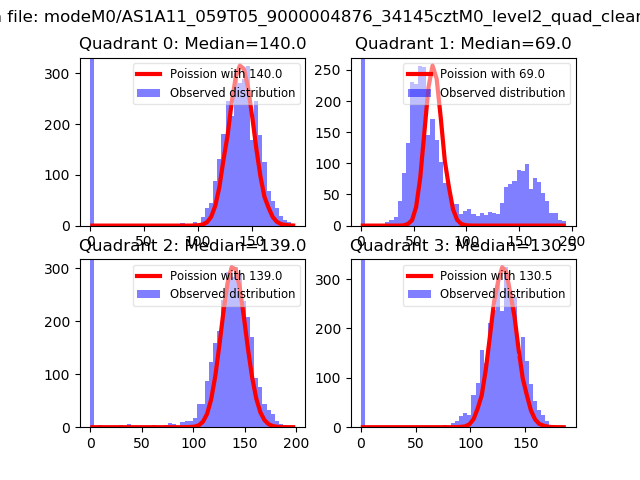 |
 |
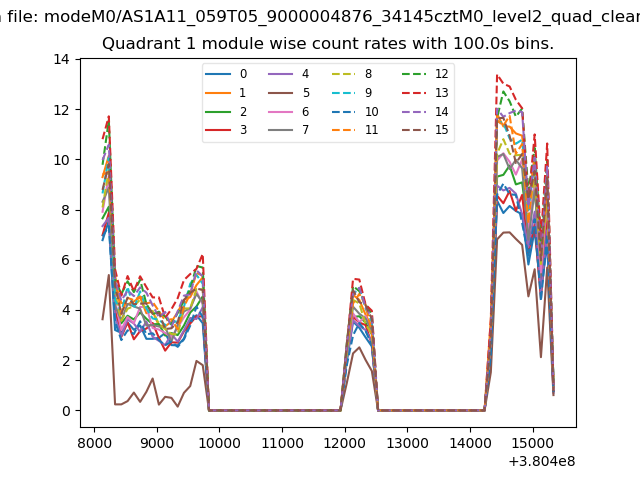
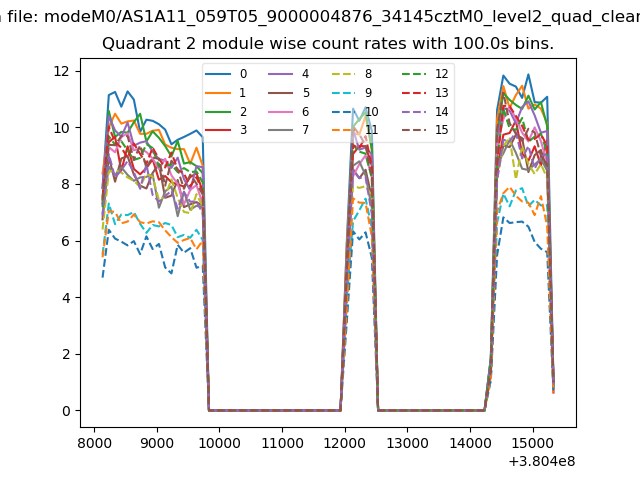
| Quadrant-wise count rates Data is divided into 100 sec bins |
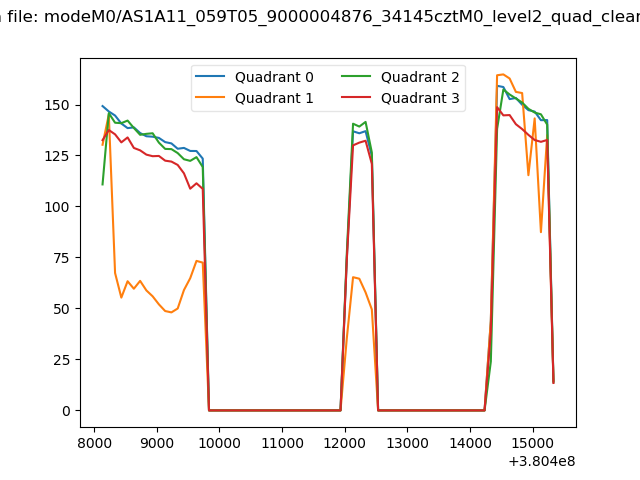 |
|
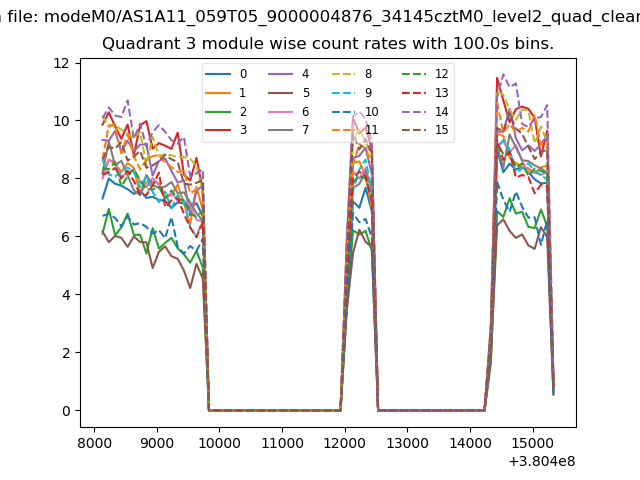
| Module-wise count rates for Quadrant A Data is divided into 100 sec bins |
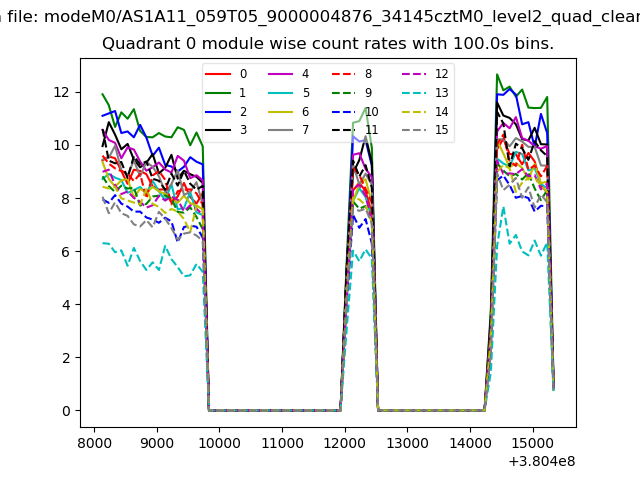 |
 |
| Module-wise count rates for Quadrant B Data is divided into 100 sec bins |
 |
 |
| Module-wise count rates for Quadrant C Data is divided into 100 sec bins |
 |
 |
| Module-wise count rates for Quadrant D Data is divided into 100 sec bins |
 |
 |
| Parameter | Plot |
|---|---|
| CZT HV Monitor | 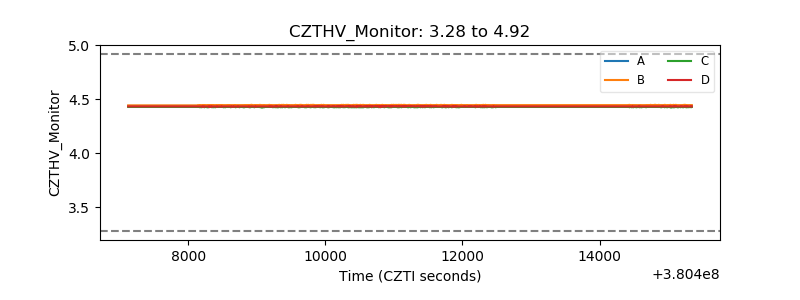 |
| D_VDD |  |
| Temperature 1 | 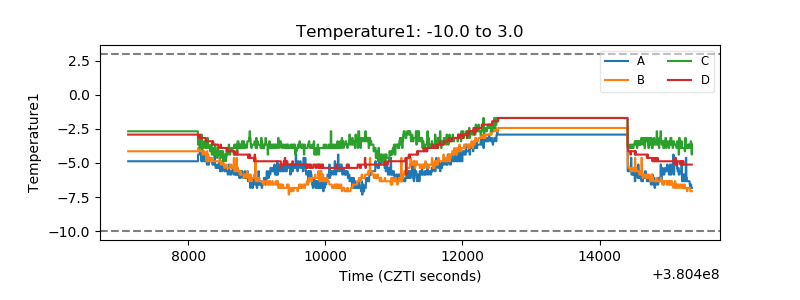 |
| Veto HV Monitor |  |
| Veto LLD | 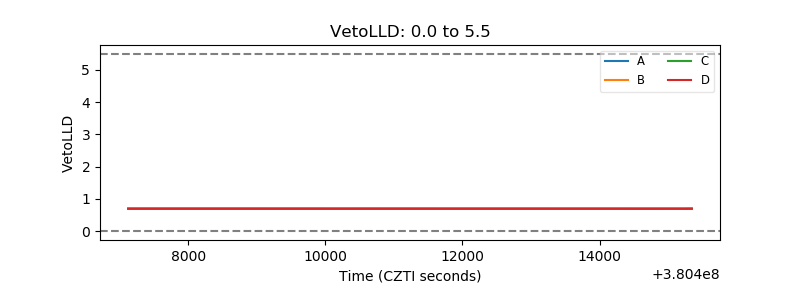 |
| Alpha Counter | 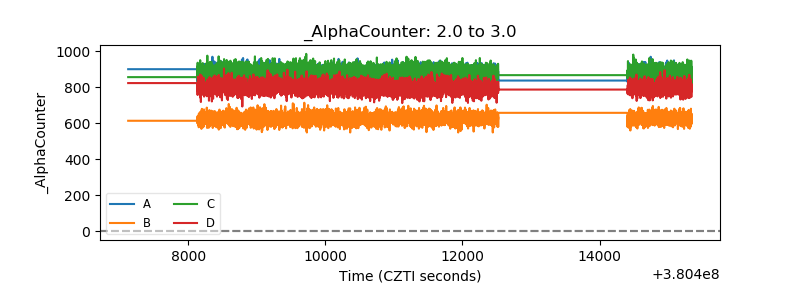 |
| _CPM_Rate | 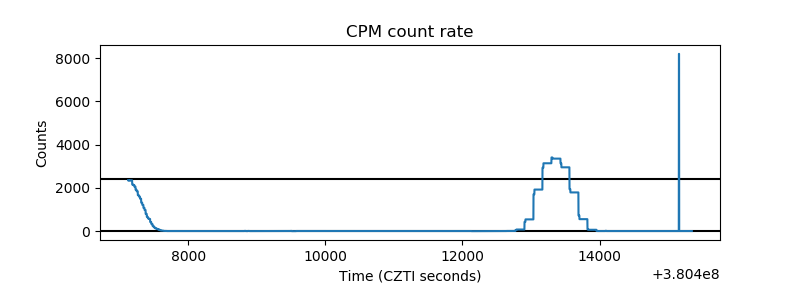 |
| CZT Counter | 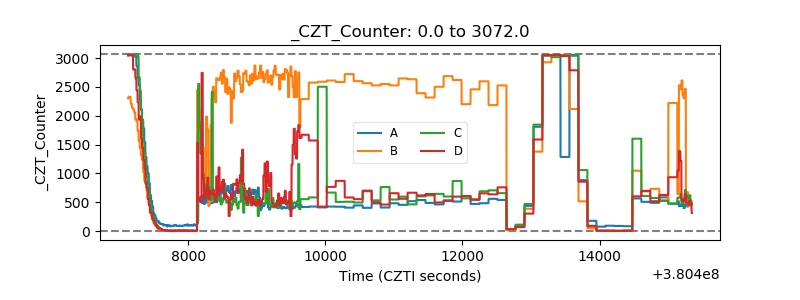 |
| +2.5 Volts monitor |  |
| +5 Volts monitor |  |
| _ROLL_ROT |  |
| _Roll_DEC | 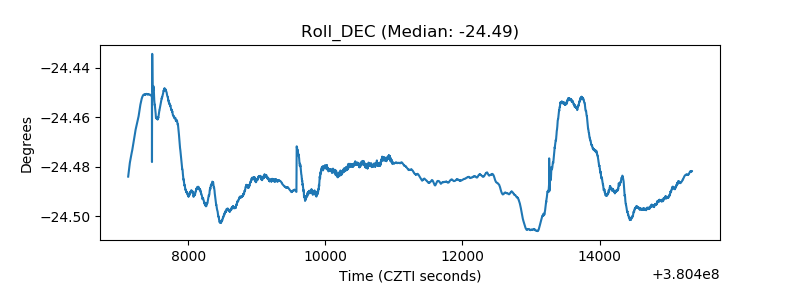 |
| _Roll_RA | 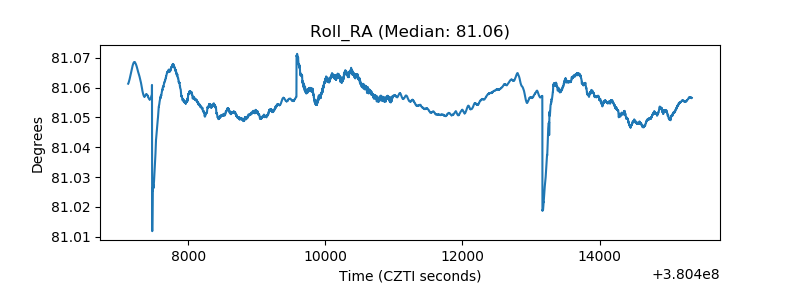 |
| Veto Counter | 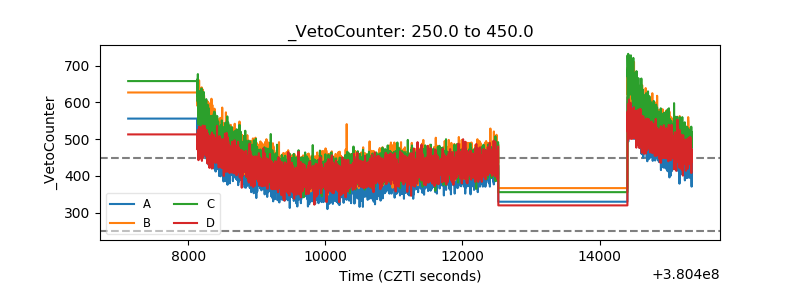 |