| Param | Original file | Final file |
|---|---|---|
| Filename | modeM0/AS1A11_059T05_9000004876_34148cztM0_level2.evt | modeM0/AS1A11_059T05_9000004876_34148cztM0_level2_quad_clean.evt |
| Size (bytes) | 630,048,960 | 47,162,880 |
| Size | 600.9 MB | 45.0 MB |
| Events in quadrant A | 2,555,431 | 277,340 |
| Events in quadrant B | 8,764,598 | 248,140 |
| Events in quadrant C | 3,436,018 | 279,843 |
| Events in quadrant D | 3,977,285 | 261,869 |
| Mode M9 | |||
|---|---|---|---|
| Quadrant | BADHDUFLAG | Total packets | Discarded packets |
| A | 0 | 31 | 0 |
| B | 0 | 31 | 0 |
| C | 0 | 31 | 0 |
| D | 0 | 32 | 0 |
| Mode M0 | |||
|---|---|---|---|
| Quadrant | BADHDUFLAG | Total packets | Discarded packets |
| A | 0 | 10458 | 3 |
| B | 0 | 29416 | 2 |
| C | 0 | 13369 | 2 |
| D | 0 | 15159 | 2 |
| Mode SS | |||
|---|---|---|---|
| Quadrant | BADHDUFLAG | Total packets | Discarded packets |
| A | 0 | 104 | 0 |
| B | 0 | 104 | 0 |
| C | 0 | 104 | 0 |
| D | 0 | 104 | 0 |
| Quadrant | Total seconds | Saturated seconds | Saturation percentage |
|---|---|---|---|
| A | 5140 | 5 | 0.097276% |
| B | 5140 | 2818 | 54.824903% |
| C | 5140 | 150 | 2.918288% |
| D | 5140 | 79 | 1.536965% |
Noise dominated data is calculated using 1-second bins in cleaned event files. If a bin has >2000 counts, and if more than 50% of those come from <1% of pixels, then it is considered to be noise-dominated and hence unusable.
| Quadrant | # 1 sec bins | Bins with >0 counts | Bins with >2000 counts | High rate bins dominated by noise | Noise dominated (total time) | Noise dominated (detector-on time) | Marked lightcurve |
|---|---|---|---|---|---|---|---|
| A | 7264 | 5141 | 0 | 0 | 0.00% | 0.00% | 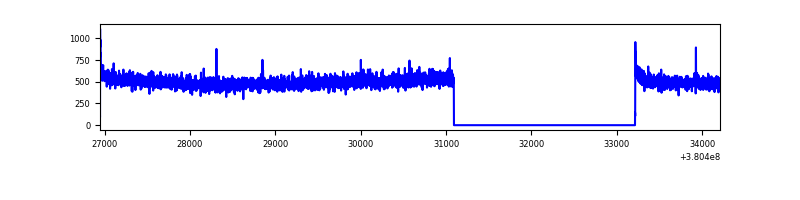 |
| B | 7264 | 5141 | 2567 | 2567 | 35.34% | 49.93% | 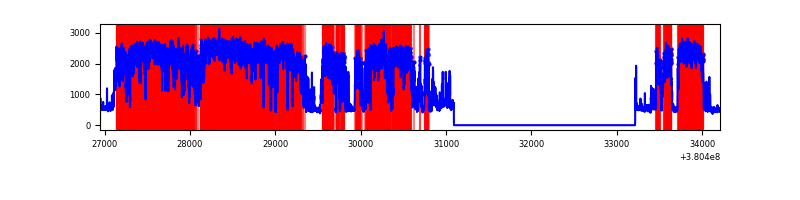 |
| C | 7264 | 5141 | 116 | 116 | 1.60% | 2.26% | 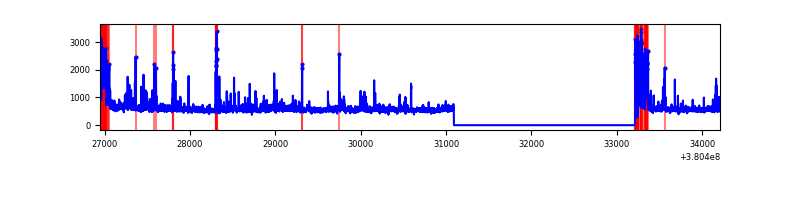 |
| D | 7264 | 5141 | 66 | 66 | 0.91% | 1.28% | 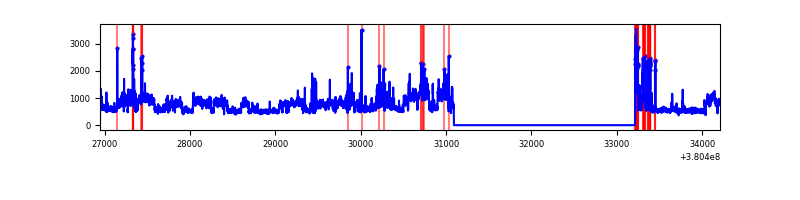 |
Top three noisy pixels from each quadrant. If the there are fewer than three noisy pixels in the level2.evt file, extra rows are filled as -1
| Pixel properties | Quadrant properties | ||||||
|---|---|---|---|---|---|---|---|
| Quadrant | DetID | PixID | Counts | Sigma | Mean | Median | Sigma |
| A | 10 | 83 | 20660 | 152.92 | 653 | 642 | 130.9 |
| A | 13 | 6 | 13497 | 98.2 | 653 | 642 | 130.9 |
| A | 13 | 254 | 8646 | 61.14 | 653 | 642 | 130.9 |
| B | 5 | 31 | 3336048 | 32227.18 | 548 | 535 | 103.5 |
| B | 5 | 15 | 2362273 | 22818.73 | 548 | 535 | 103.5 |
| B | 5 | 14 | 682208 | 6586.21 | 548 | 535 | 103.5 |
| C | 0 | 10 | 447091 | 3023.05 | 643 | 650 | 147.7 |
| C | 15 | 214 | 219159 | 1479.62 | 643 | 650 | 147.7 |
| C | 14 | 254 | 158095 | 1066.13 | 643 | 650 | 147.7 |
| D | 8 | 195 | 1046748 | 6692.36 | 641 | 626 | 156.3 |
| D | 10 | 118 | 198306 | 1264.62 | 641 | 626 | 156.3 |
| D | 13 | 249 | 158527 | 1010.14 | 641 | 626 | 156.3 |
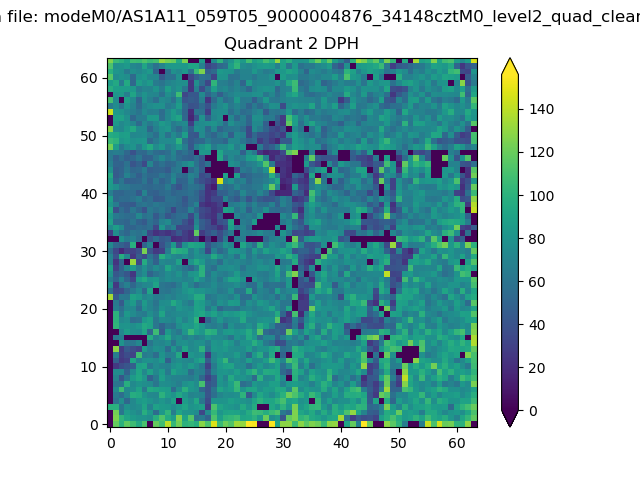
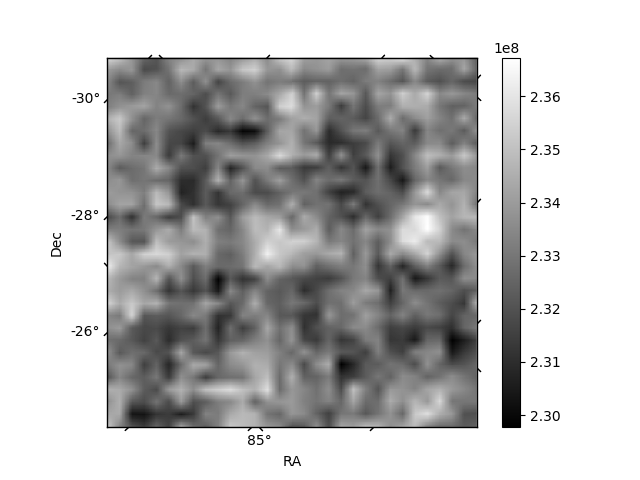
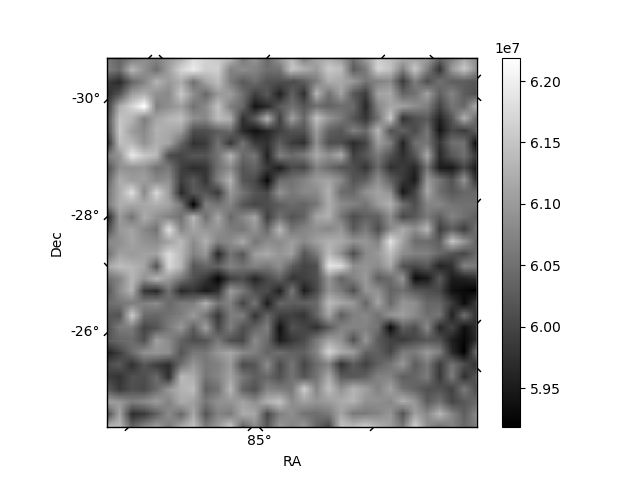
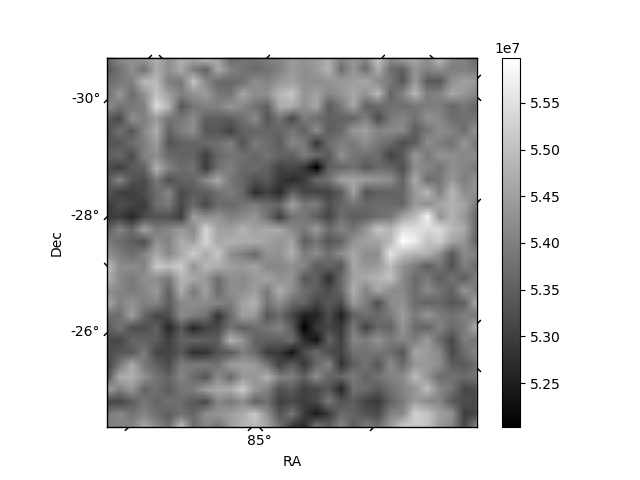
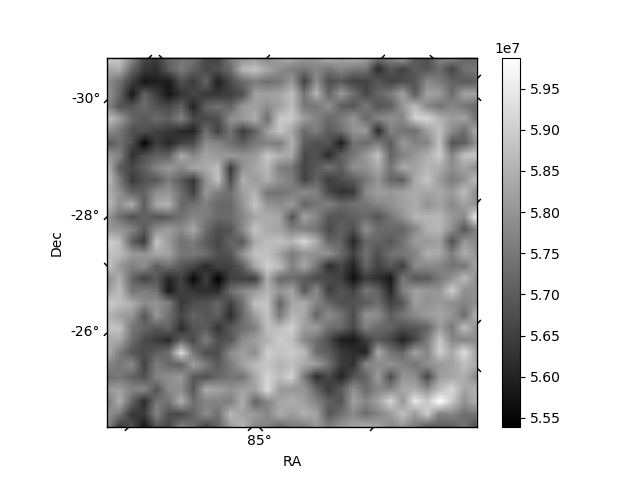
Histogram calculated using DETX and DETY for each event in the final _common_clean file
| Quadrant A | 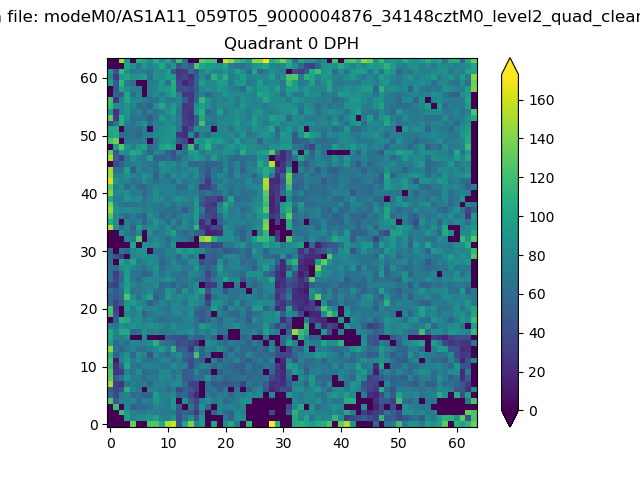 |
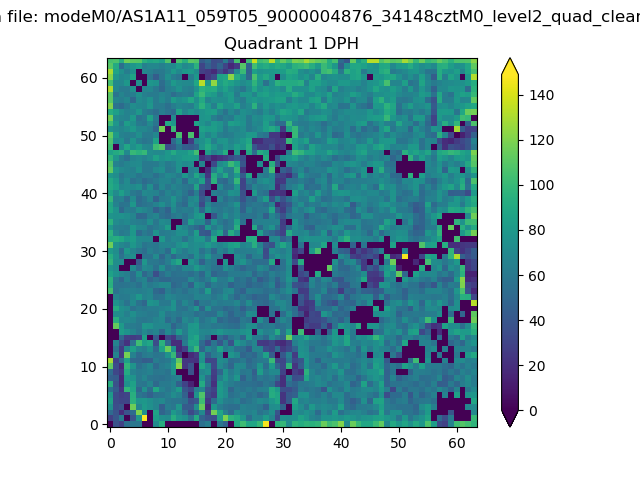 |
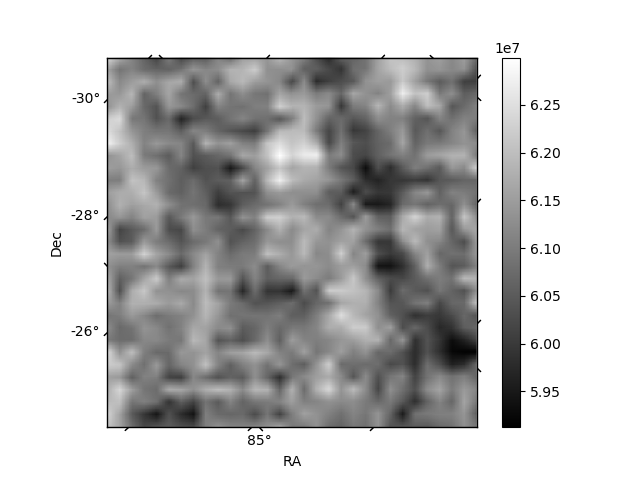
Quadrant B |
|---|---|---|---|
| Quadrant D | 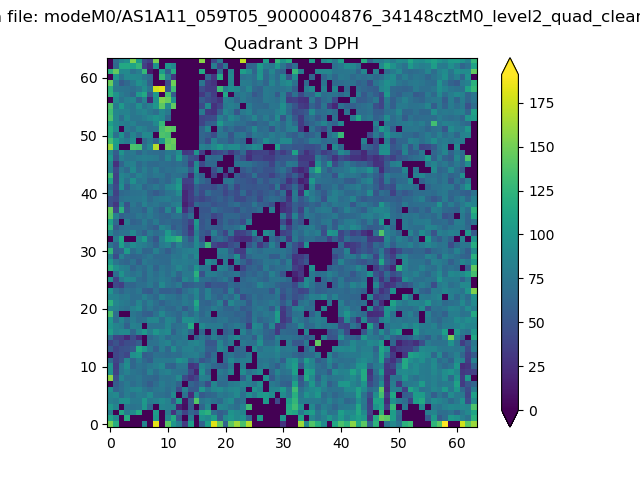 |
 |
Quadrant C |
| Plot type | Count rate plots | Images |
|---|---|---|
| Comparison with Poisson distribution Blue bars denote a histogram of data divided into 1 sec bins. Red curve is a Poisson curve with rate = median count rate of data. |
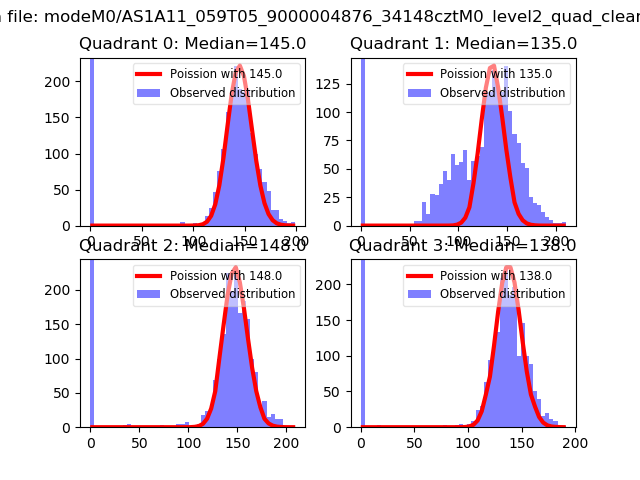 |
 |
| Quadrant-wise count rates Data is divided into 100 sec bins |
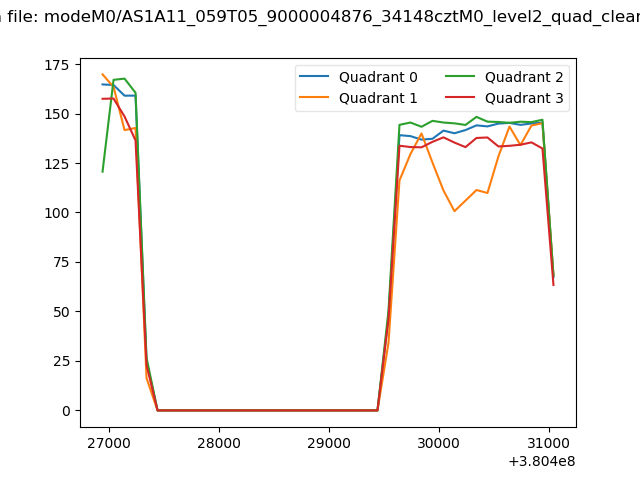 |
|
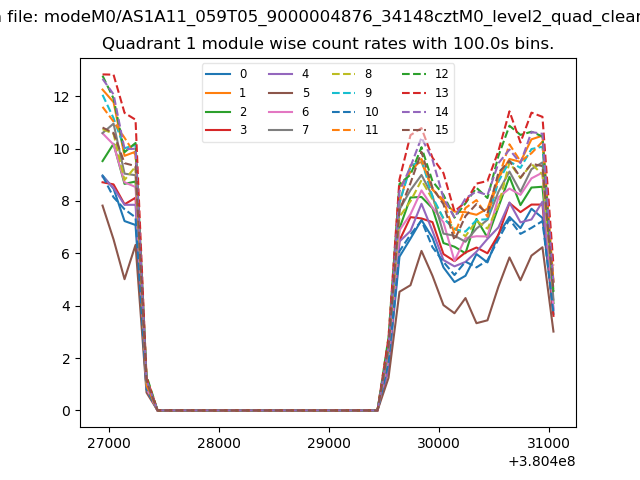
| Module-wise count rates for Quadrant A Data is divided into 100 sec bins |
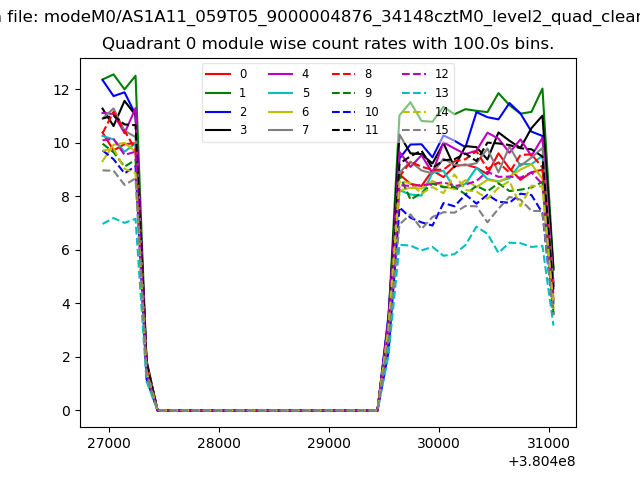 |
 |
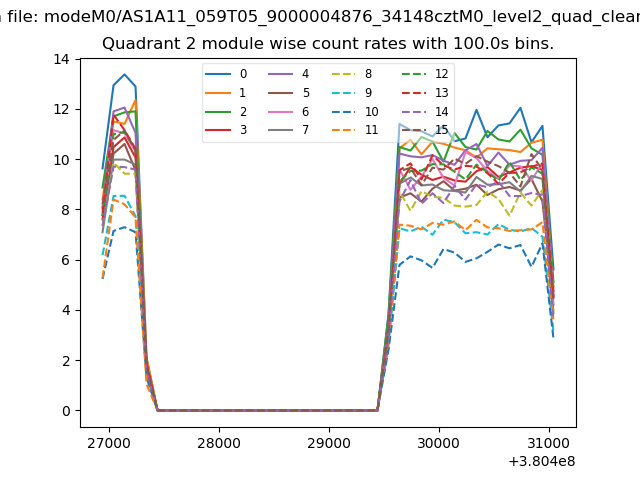
| Module-wise count rates for Quadrant B Data is divided into 100 sec bins |
 |
 |
| Module-wise count rates for Quadrant C Data is divided into 100 sec bins |
 |
 |
| Module-wise count rates for Quadrant D Data is divided into 100 sec bins |
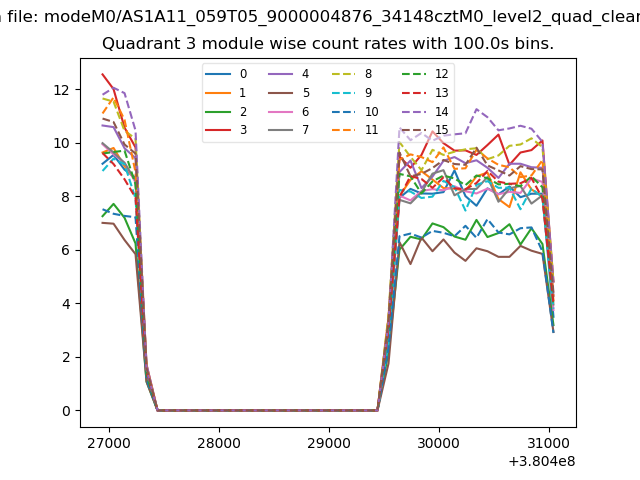 |
 |
| Parameter | Plot |
|---|---|
| CZT HV Monitor |  |
| D_VDD | 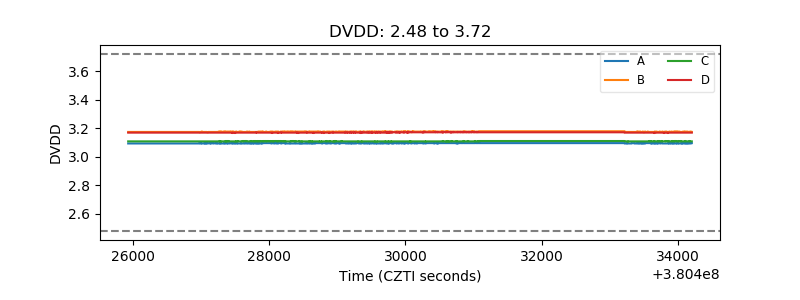 |
| Temperature 1 | 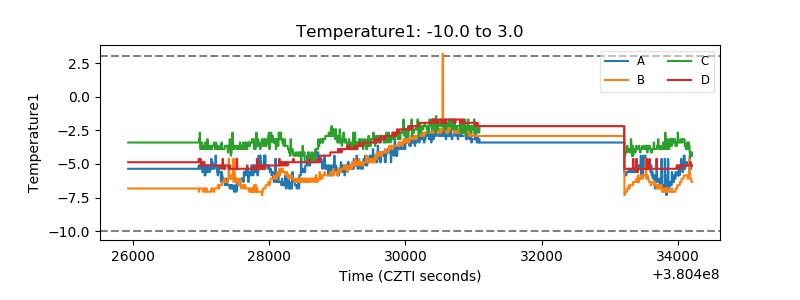 |
| Veto HV Monitor | 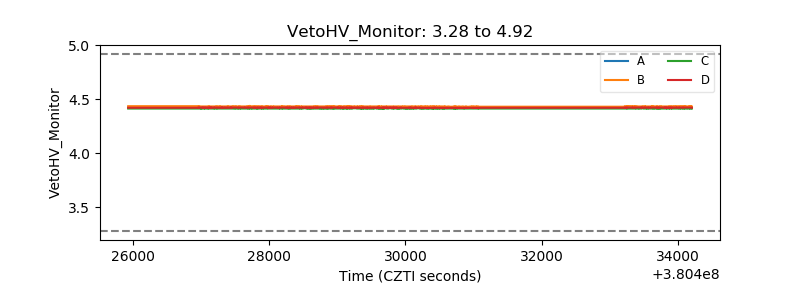 |
| Veto LLD |  |
| Alpha Counter | 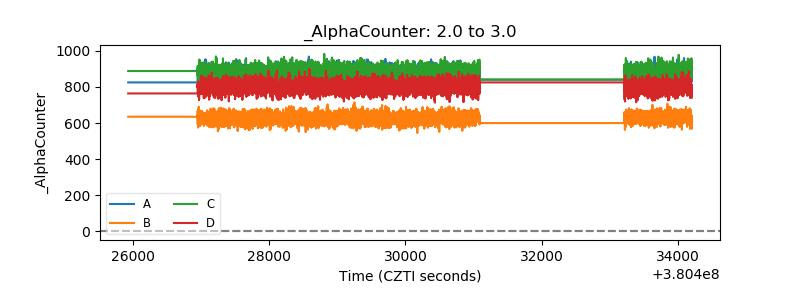 |
| _CPM_Rate | 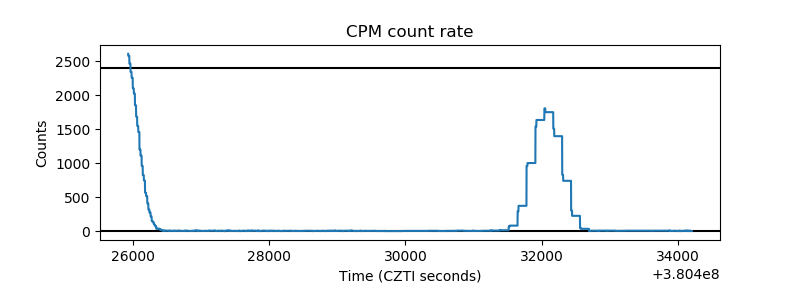 |
| CZT Counter | 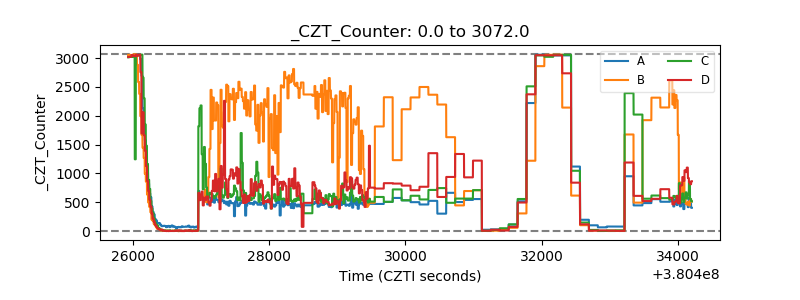 |
| +2.5 Volts monitor |  |
| +5 Volts monitor |  |
| _ROLL_ROT |  |
| _Roll_DEC | 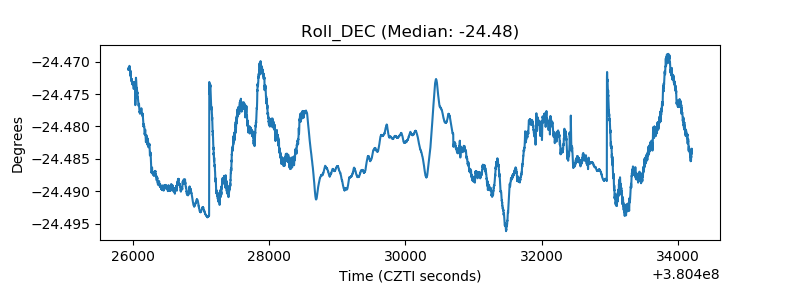 |
| _Roll_RA | 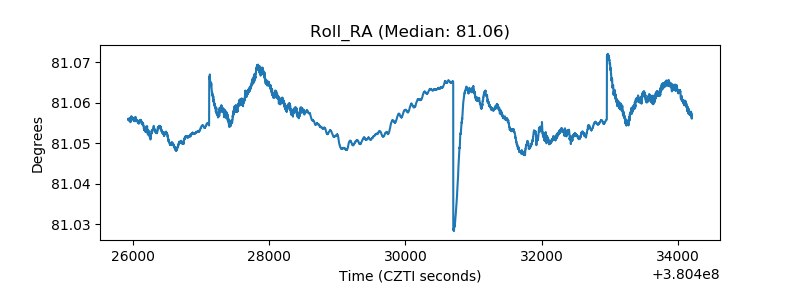 |
| Veto Counter | 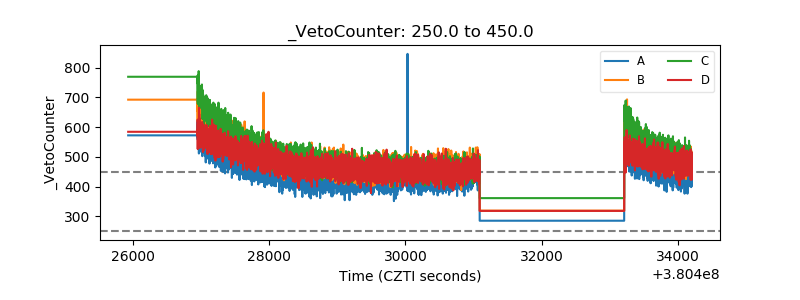 |