| Param | Original file | Final file |
|---|---|---|
| Filename | modeM0/AS1A11_059T05_9000004876_34150cztM0_level2.evt | modeM0/AS1A11_059T05_9000004876_34150cztM0_level2_quad_clean.evt |
| Size (bytes) | 491,264,640 | 56,566,080 |
| Size | 468.5 MB | 53.9 MB |
| Events in quadrant A | 2,446,790 | 344,367 |
| Events in quadrant B | 5,275,588 | 321,984 |
| Events in quadrant C | 3,378,794 | 348,319 |
| Events in quadrant D | 3,420,851 | 330,323 |
| Mode M9 | |||
|---|---|---|---|
| Quadrant | BADHDUFLAG | Total packets | Discarded packets |
| A | 0 | 38 | 0 |
| B | 0 | 38 | 0 |
| C | 0 | 38 | 0 |
| D | 0 | 39 | 0 |
| Mode M0 | |||
|---|---|---|---|
| Quadrant | BADHDUFLAG | Total packets | Discarded packets |
| A | 0 | 10558 | 3 |
| B | 0 | 18973 | 2 |
| C | 0 | 13068 | 2 |
| D | 0 | 13670 | 2 |
| Mode SS | |||
|---|---|---|---|
| Quadrant | BADHDUFLAG | Total packets | Discarded packets |
| A | 0 | 106 | 0 |
| B | 0 | 106 | 0 |
| C | 0 | 106 | 0 |
| D | 0 | 106 | 0 |
| Quadrant | Total seconds | Saturated seconds | Saturation percentage |
|---|---|---|---|
| A | 5246 | 6 | 0.114373% |
| B | 5246 | 1050 | 20.015250% |
| C | 5246 | 204 | 3.888677% |
| D | 5246 | 37 | 0.705299% |
Noise dominated data is calculated using 1-second bins in cleaned event files. If a bin has >2000 counts, and if more than 50% of those come from <1% of pixels, then it is considered to be noise-dominated and hence unusable.
| Quadrant | # 1 sec bins | Bins with >0 counts | Bins with >2000 counts | High rate bins dominated by noise | Noise dominated (total time) | Noise dominated (detector-on time) | Marked lightcurve |
|---|---|---|---|---|---|---|---|
| A | 7099 | 5247 | 0 | 0 | 0.00% | 0.00% | 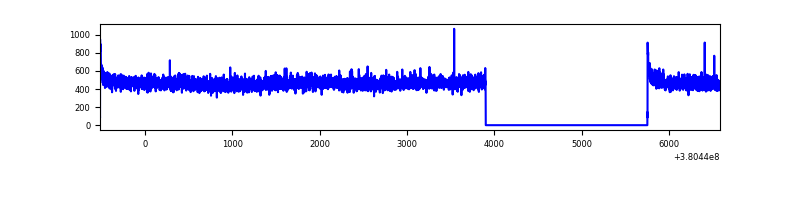 |
| B | 7099 | 5247 | 891 | 891 | 12.55% | 16.98% |  |
| C | 7099 | 5247 | 162 | 162 | 2.28% | 3.09% | 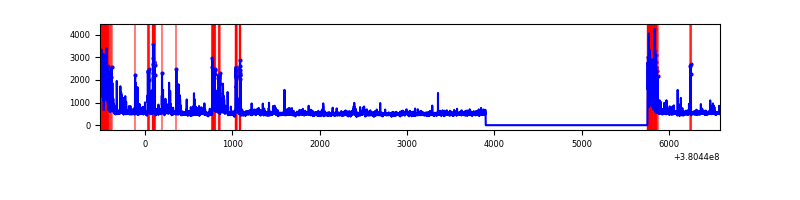 |
| D | 7099 | 5247 | 30 | 30 | 0.42% | 0.57% | 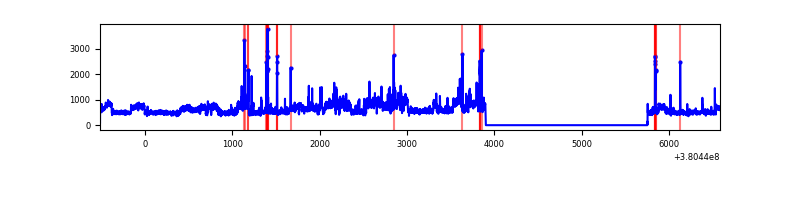 |
Top three noisy pixels from each quadrant. If the there are fewer than three noisy pixels in the level2.evt file, extra rows are filled as -1
| Pixel properties | Quadrant properties | ||||||
|---|---|---|---|---|---|---|---|
| Quadrant | DetID | PixID | Counts | Sigma | Mean | Median | Sigma |
| A | 10 | 83 | 21072 | 162.67 | 626 | 614 | 125.8 |
| A | 13 | 254 | 8857 | 65.54 | 626 | 614 | 125.8 |
| A | 13 | 6 | 7506 | 54.8 | 626 | 614 | 125.8 |
| B | 5 | 31 | 1035977 | 8893.21 | 600 | 586 | 116.4 |
| B | 5 | 15 | 987130 | 8473.66 | 600 | 586 | 116.4 |
| B | 5 | 14 | 629046 | 5397.99 | 600 | 586 | 116.4 |
| C | 0 | 10 | 471325 | 3366.81 | 605 | 611 | 139.8 |
| C | 14 | 254 | 242056 | 1726.95 | 605 | 611 | 139.8 |
| C | 15 | 214 | 222534 | 1587.32 | 605 | 611 | 139.8 |
| D | 8 | 195 | 692434 | 4600.07 | 612 | 595 | 150.4 |
| D | 10 | 118 | 174809 | 1158.36 | 612 | 595 | 150.4 |
| D | 2 | 250 | 51241 | 336.75 | 612 | 595 | 150.4 |
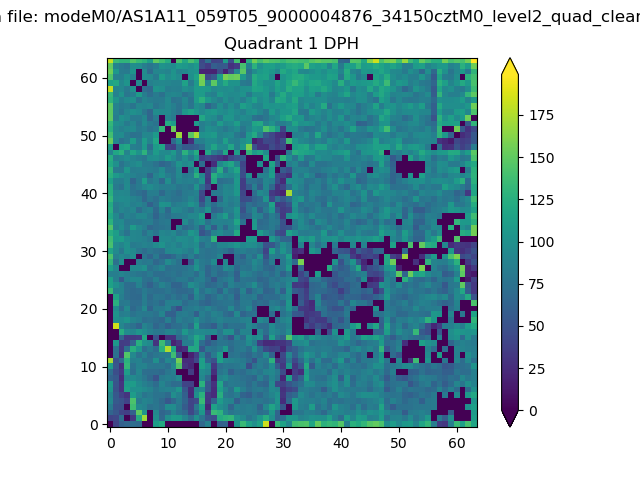
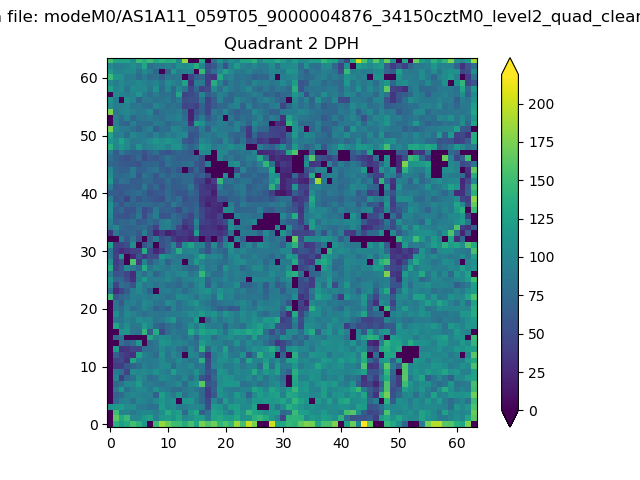
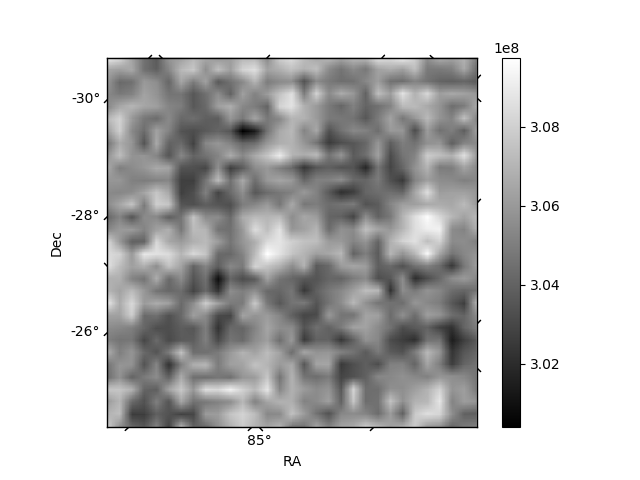
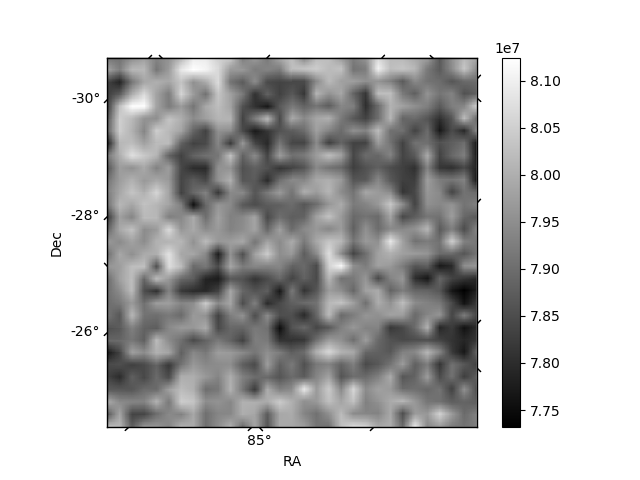
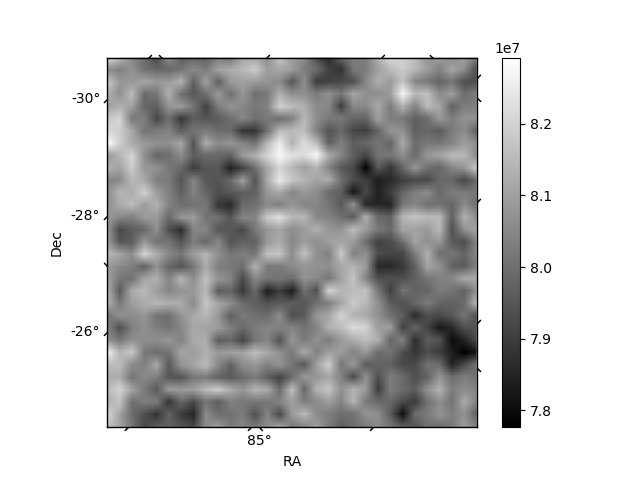
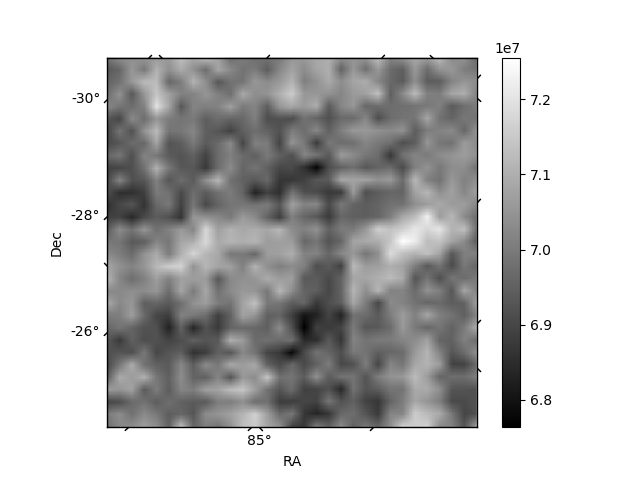
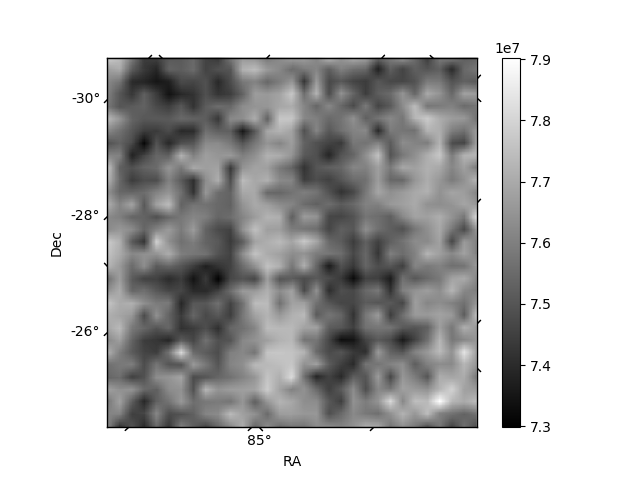
Histogram calculated using DETX and DETY for each event in the final _common_clean file
| Quadrant A | 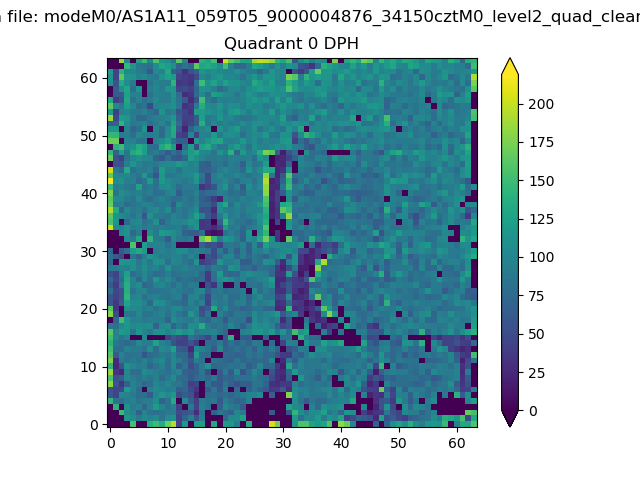 |
 |
Quadrant B |
|---|---|---|---|
| Quadrant D | 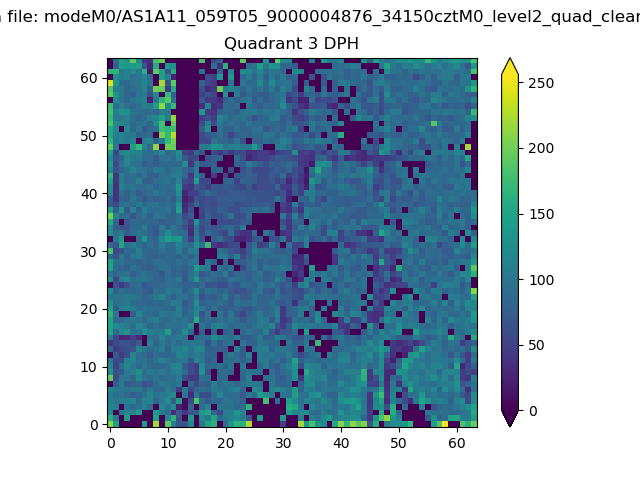 |
 |
Quadrant C |
| Plot type | Count rate plots | Images |
|---|---|---|
| Comparison with Poisson distribution Blue bars denote a histogram of data divided into 1 sec bins. Red curve is a Poisson curve with rate = median count rate of data. |
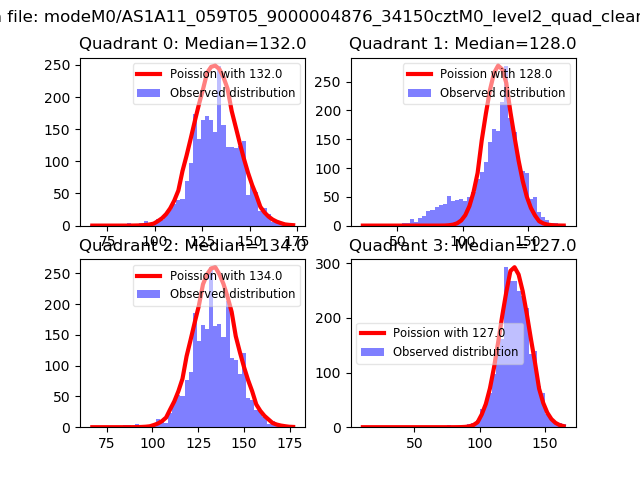 |
 |
| Quadrant-wise count rates Data is divided into 100 sec bins |
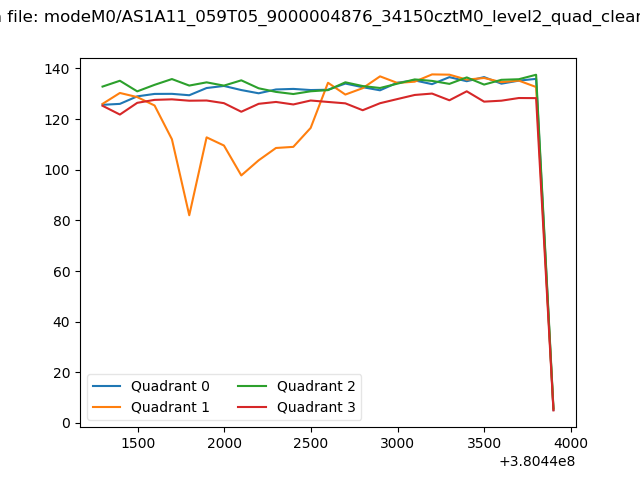 |
|
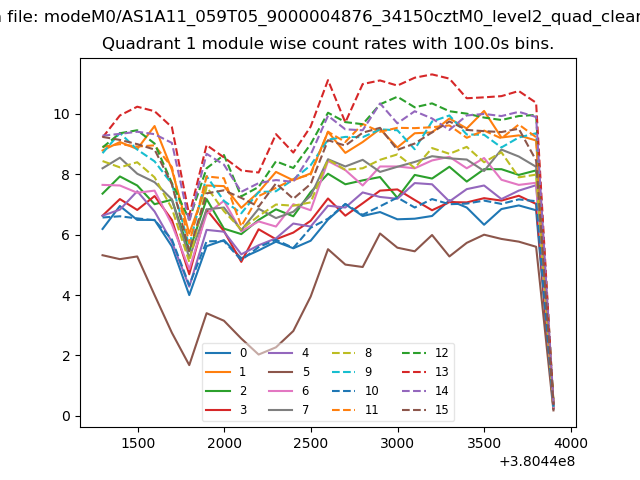
| Module-wise count rates for Quadrant A Data is divided into 100 sec bins |
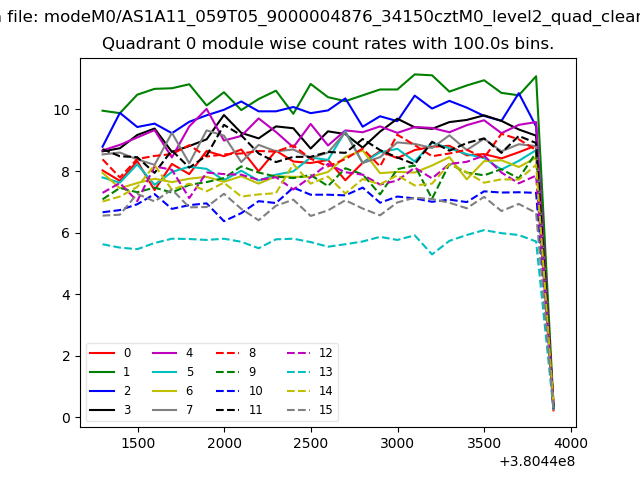 |
 |
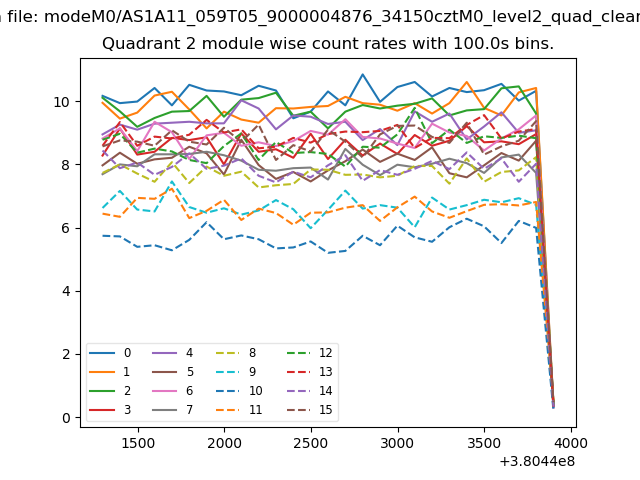
| Module-wise count rates for Quadrant B Data is divided into 100 sec bins |
 |
 |
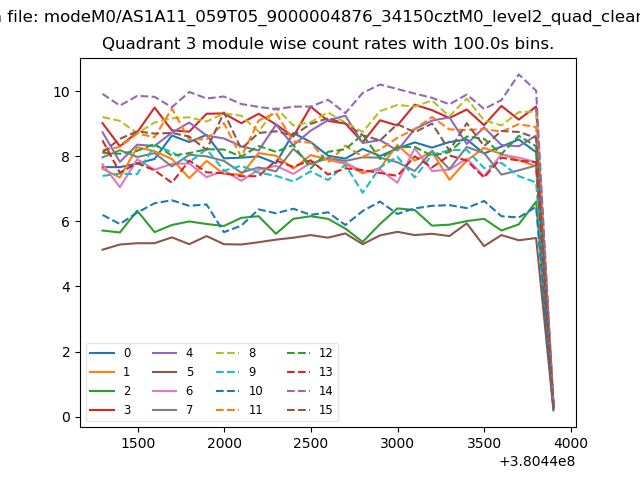
| Module-wise count rates for Quadrant C Data is divided into 100 sec bins |
 |
 |
| Module-wise count rates for Quadrant D Data is divided into 100 sec bins |
 |
 |
| Parameter | Plot |
|---|---|
| CZT HV Monitor | 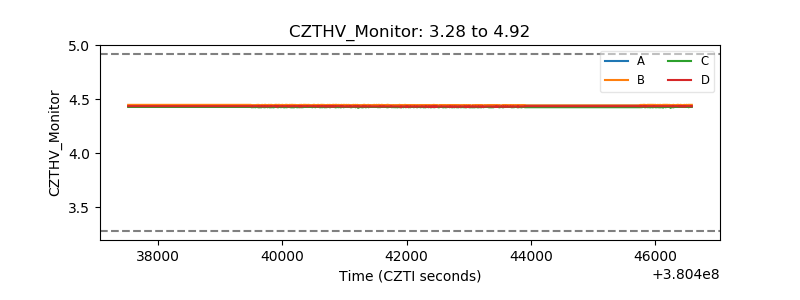 |
| D_VDD | 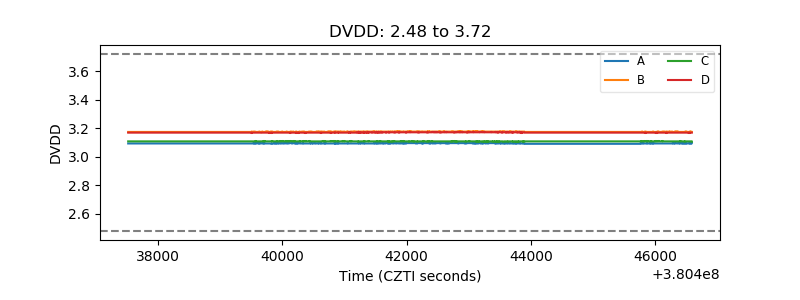 |
| Temperature 1 | 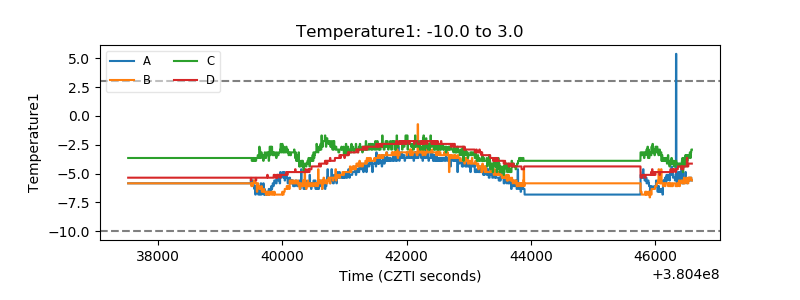 |
| Veto HV Monitor | 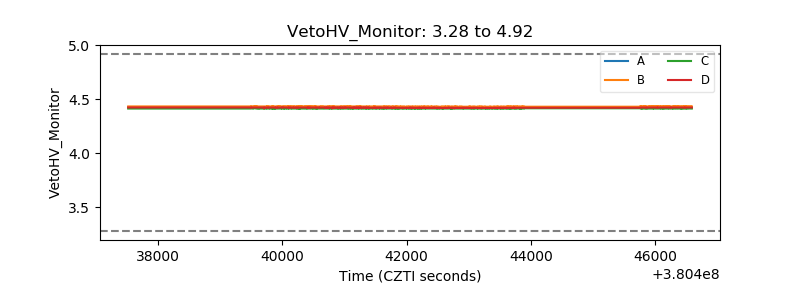 |
| Veto LLD | 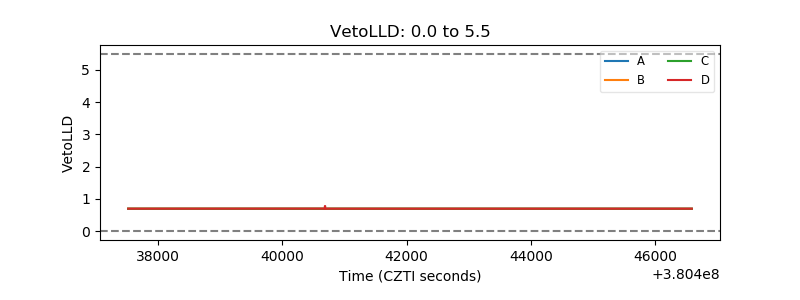 |
| Alpha Counter | 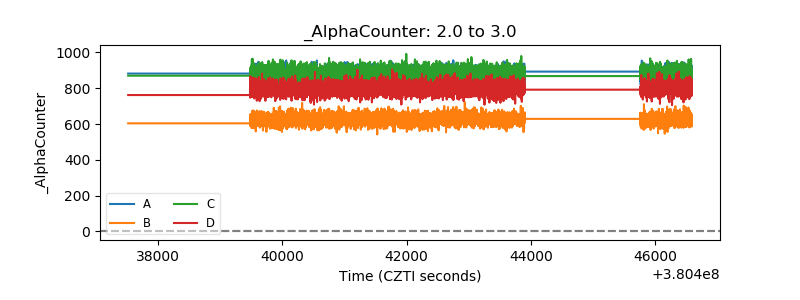 |
| _CPM_Rate | 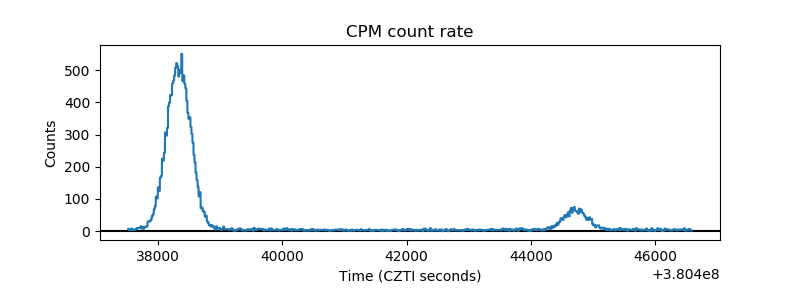 |
| CZT Counter | 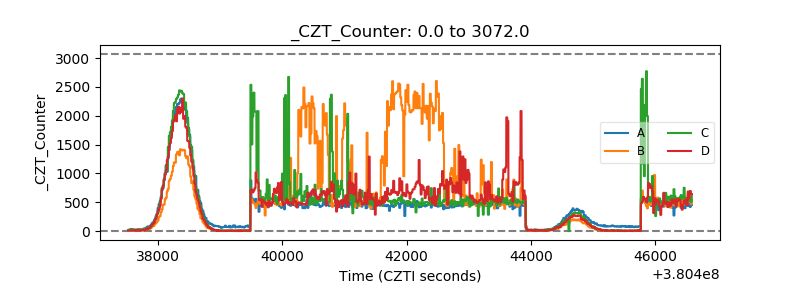 |
| +2.5 Volts monitor |  |
| +5 Volts monitor |  |
| _ROLL_ROT | 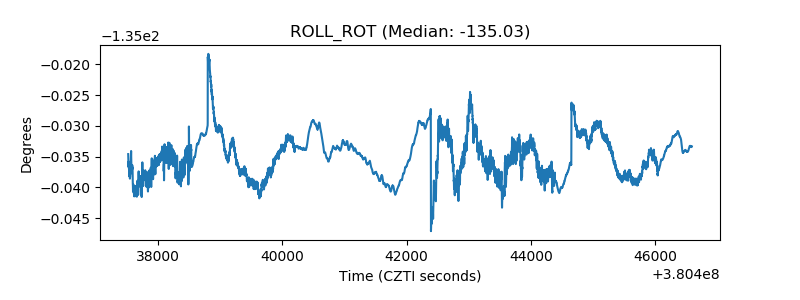 |
| _Roll_DEC | 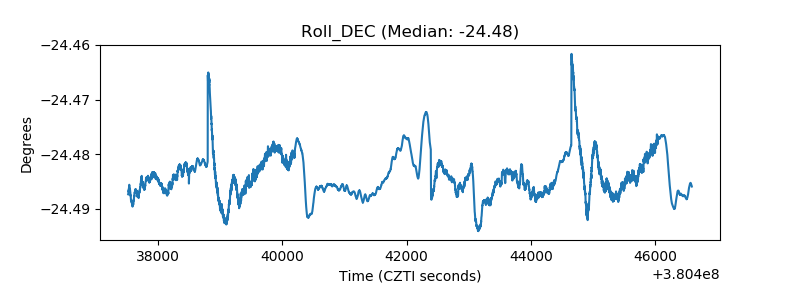 |
| _Roll_RA | 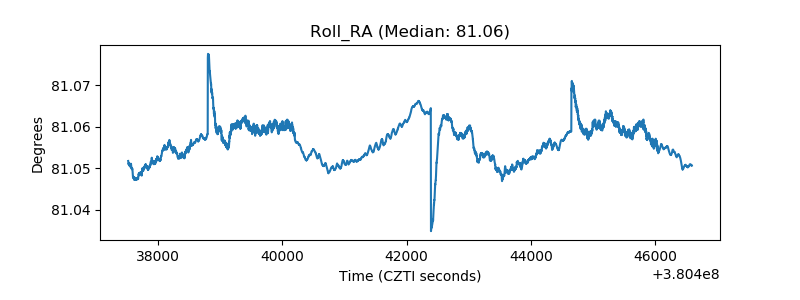 |
| Veto Counter | 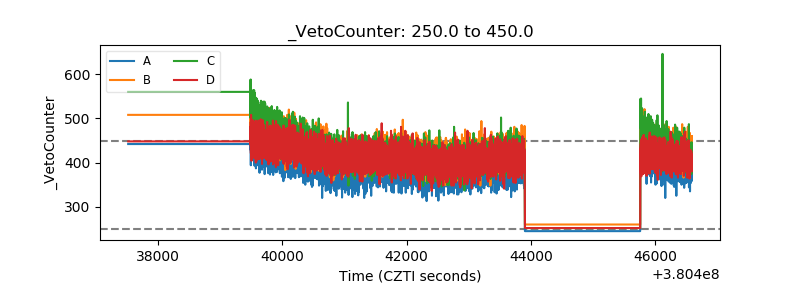 |