| Param | Original file | Final file |
|---|---|---|
| Filename | modeM0/AS1A11_059T05_9000004876_34151cztM0_level2.evt | modeM0/AS1A11_059T05_9000004876_34151cztM0_level2_quad_clean.evt |
| Size (bytes) | 277,087,680 | 45,731,520 |
| Size | 264.3 MB | 43.6 MB |
| Events in quadrant A | 1,652,220 | 284,616 |
| Events in quadrant B | 1,856,421 | 285,143 |
| Events in quadrant C | 2,062,416 | 288,581 |
| Events in quadrant D | 2,572,297 | 268,839 |
| Mode M9 | |||
|---|---|---|---|
| Quadrant | BADHDUFLAG | Total packets | Discarded packets |
| A | 0 | 16 | 0 |
| B | 0 | 16 | 0 |
| C | 0 | 16 | 0 |
| D | 0 | 17 | 0 |
| Mode M0 | |||
|---|---|---|---|
| Quadrant | BADHDUFLAG | Total packets | Discarded packets |
| A | 0 | 7304 | 1 |
| B | 0 | 7752 | 1 |
| C | 0 | 8253 | 1 |
| D | 0 | 9996 | 1 |
| Mode SS | |||
|---|---|---|---|
| Quadrant | BADHDUFLAG | Total packets | Discarded packets |
| A | 0 | 72 | 0 |
| B | 0 | 72 | 0 |
| C | 0 | 72 | 0 |
| D | 0 | 72 | 0 |
| Quadrant | Total seconds | Saturated seconds | Saturation percentage |
|---|---|---|---|
| A | 3636 | 4 | 0.110011% |
| B | 3636 | 35 | 0.962596% |
| C | 3636 | 73 | 2.007701% |
| D | 3636 | 111 | 3.052805% |
Noise dominated data is calculated using 1-second bins in cleaned event files. If a bin has >2000 counts, and if more than 50% of those come from <1% of pixels, then it is considered to be noise-dominated and hence unusable.
| Quadrant | # 1 sec bins | Bins with >0 counts | Bins with >2000 counts | High rate bins dominated by noise | Noise dominated (total time) | Noise dominated (detector-on time) | Marked lightcurve |
|---|---|---|---|---|---|---|---|
| A | 3636 | 3636 | 0 | 0 | 0.00% | 0.00% | 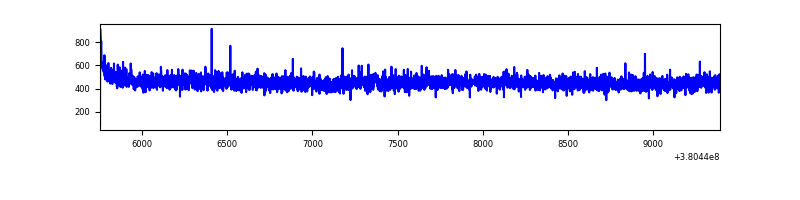 |
| B | 3636 | 3636 | 22 | 22 | 0.61% | 0.61% | 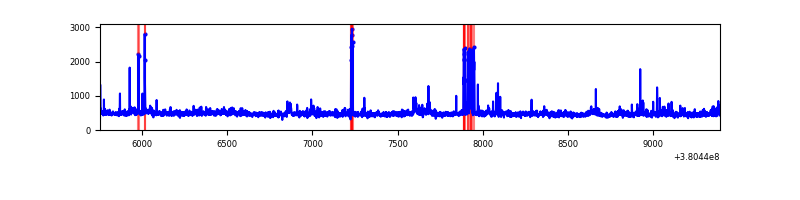 |
| C | 3636 | 3636 | 54 | 54 | 1.49% | 1.49% | 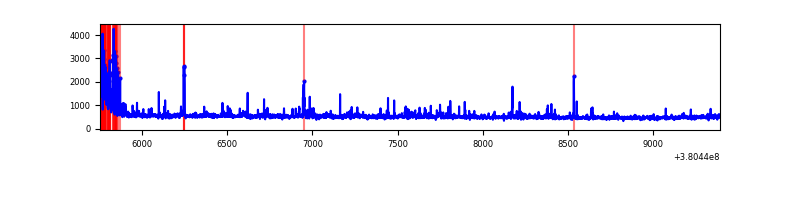 |
| D | 3636 | 3636 | 113 | 113 | 3.11% | 3.11% | 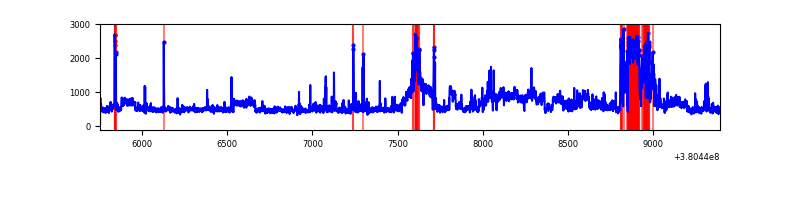 |
Top three noisy pixels from each quadrant. If the there are fewer than three noisy pixels in the level2.evt file, extra rows are filled as -1
| Pixel properties | Quadrant properties | ||||||
|---|---|---|---|---|---|---|---|
| Quadrant | DetID | PixID | Counts | Sigma | Mean | Median | Sigma |
| A | 10 | 83 | 11046 | 123.46 | 423 | 415 | 86.1 |
| A | 13 | 254 | 6529 | 71.0 | 423 | 415 | 86.1 |
| A | 3 | 137 | 4310 | 45.23 | 423 | 415 | 86.1 |
| B | 5 | 255 | 71130 | 858.19 | 419 | 408 | 82.4 |
| B | 5 | 172 | 65833 | 793.91 | 419 | 408 | 82.4 |
| B | 0 | 245 | 26541 | 317.11 | 419 | 408 | 82.4 |
| C | 0 | 10 | 279834 | 2910.61 | 407 | 411 | 96.0 |
| C | 15 | 214 | 152209 | 1581.2 | 407 | 411 | 96.0 |
| C | 9 | 187 | 22877 | 234.02 | 407 | 411 | 96.0 |
| D | 8 | 195 | 464576 | 4578.52 | 410 | 398 | 101.4 |
| D | 10 | 118 | 322299 | 3175.14 | 410 | 398 | 101.4 |
| D | 2 | 120 | 72565 | 711.84 | 410 | 398 | 101.4 |
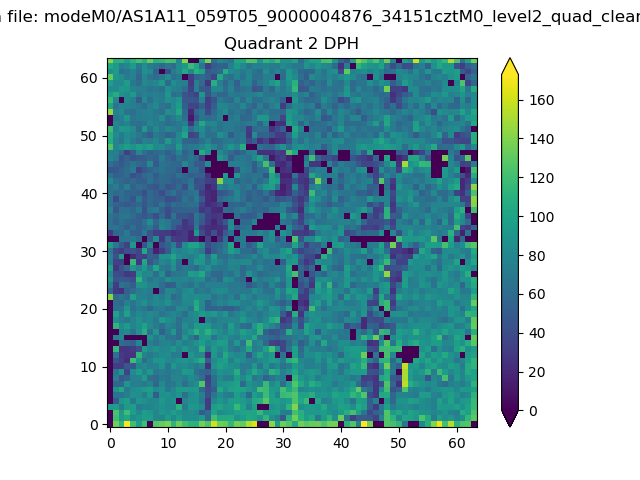
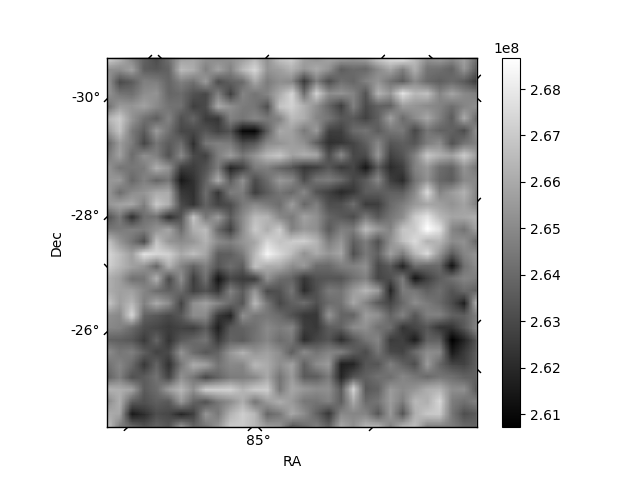
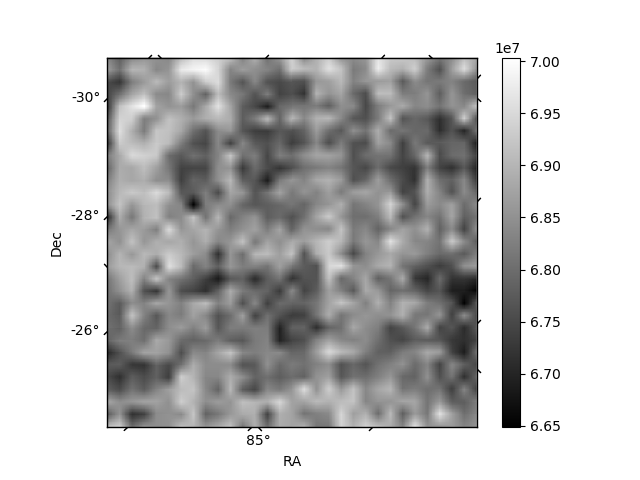
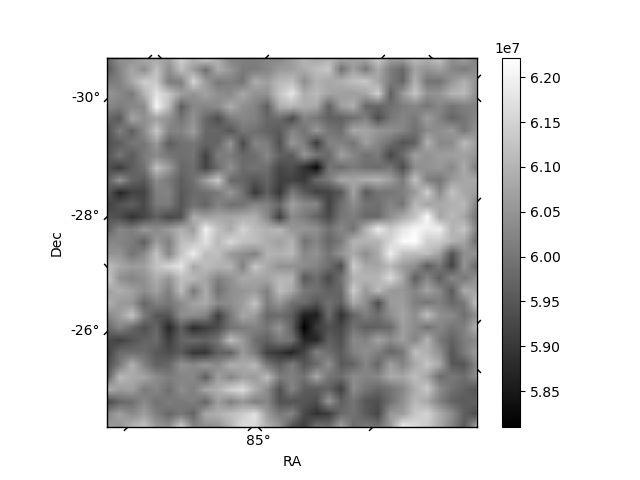
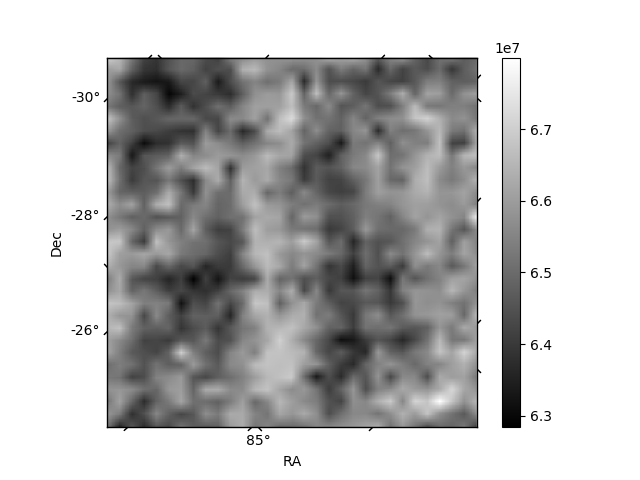
Histogram calculated using DETX and DETY for each event in the final _common_clean file
| Quadrant A | 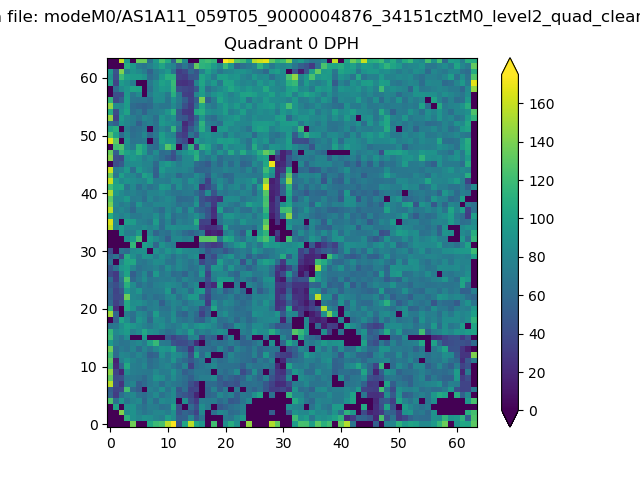 |
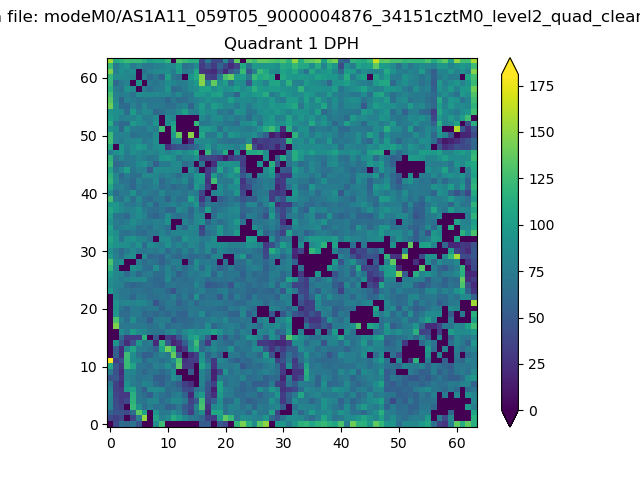 |
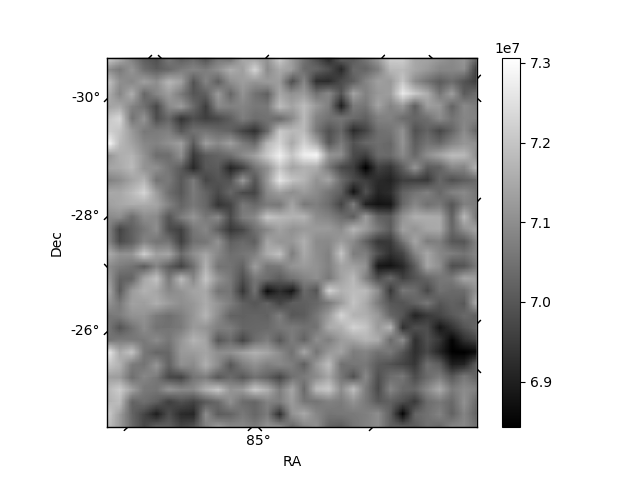
Quadrant B |
|---|---|---|---|
| Quadrant D | 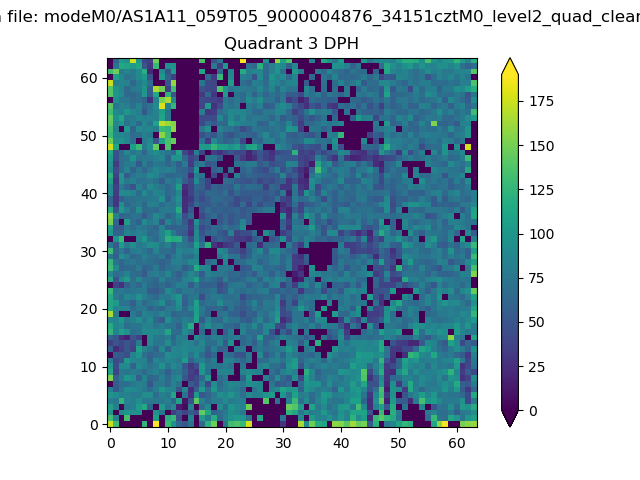 |
 |
Quadrant C |
| Plot type | Count rate plots | Images |
|---|---|---|
| Comparison with Poisson distribution Blue bars denote a histogram of data divided into 1 sec bins. Red curve is a Poisson curve with rate = median count rate of data. |
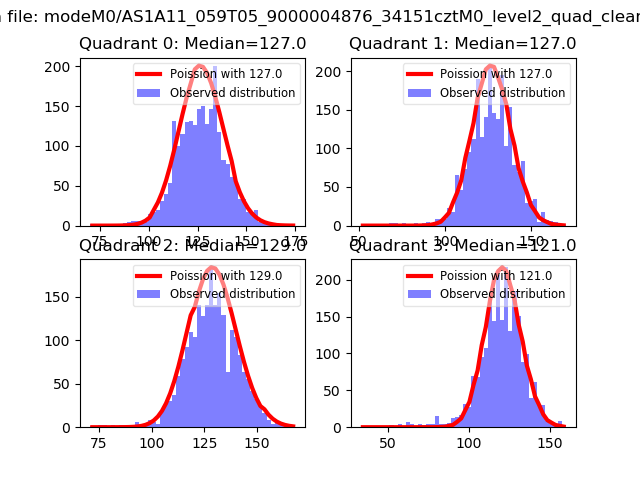 |
 |
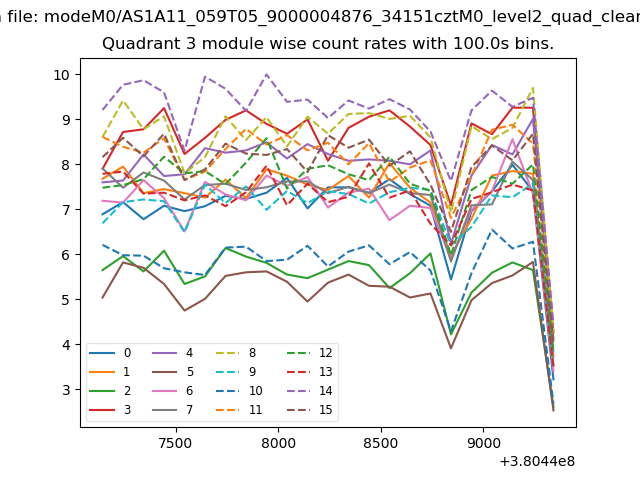
| Quadrant-wise count rates Data is divided into 100 sec bins |
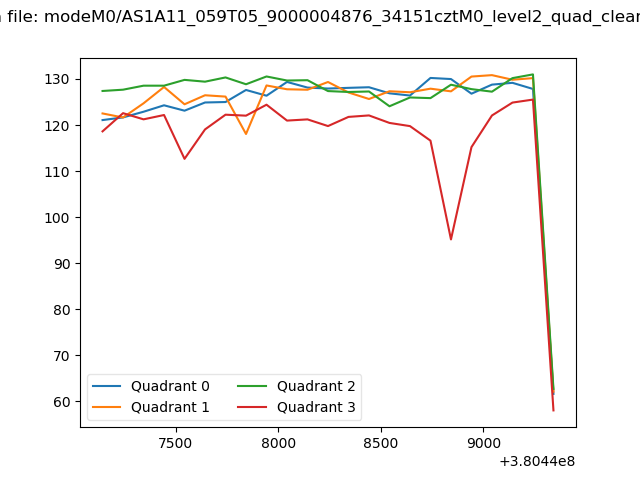 |
|
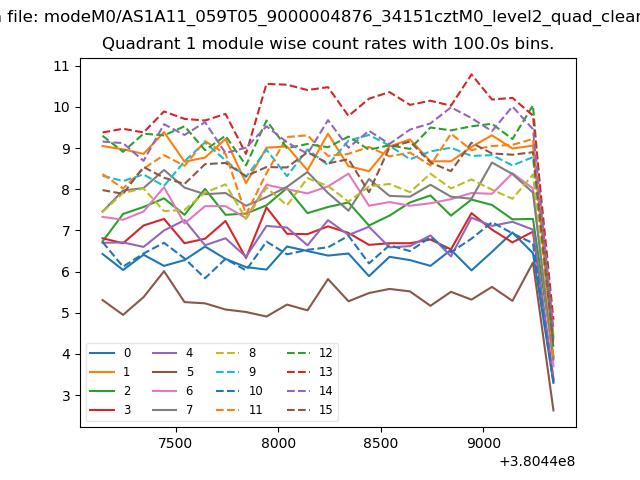
| Module-wise count rates for Quadrant A Data is divided into 100 sec bins |
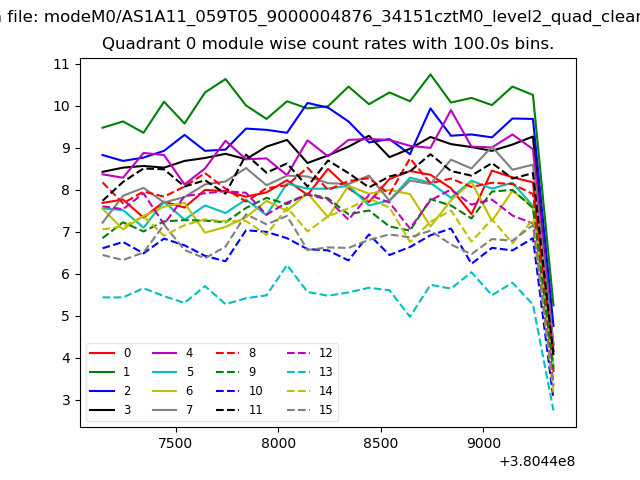 |
 |
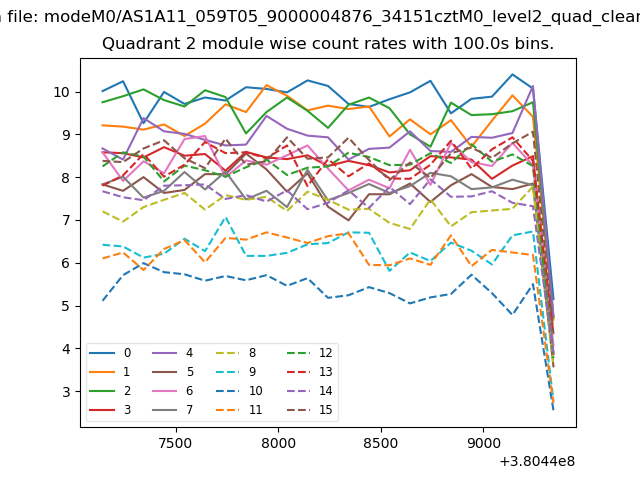
| Module-wise count rates for Quadrant B Data is divided into 100 sec bins |
 |
 |
| Module-wise count rates for Quadrant C Data is divided into 100 sec bins |
 |
 |
| Module-wise count rates for Quadrant D Data is divided into 100 sec bins |
 |
 |
| Parameter | Plot |
|---|---|
| CZT HV Monitor | 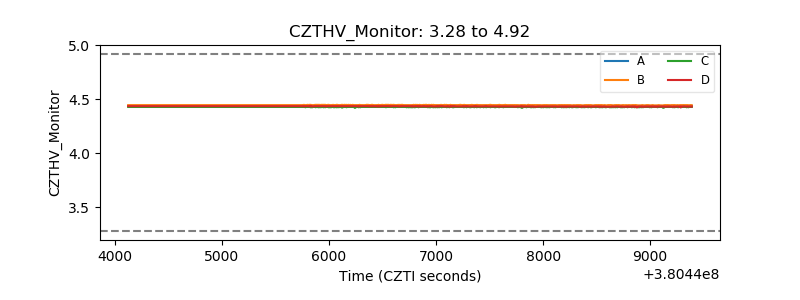 |
| D_VDD | 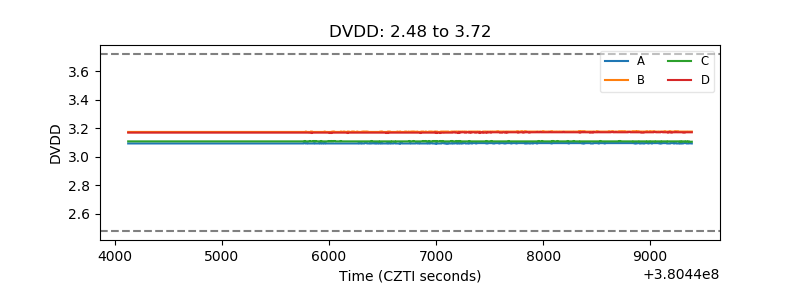 |
| Temperature 1 |  |
| Veto HV Monitor | 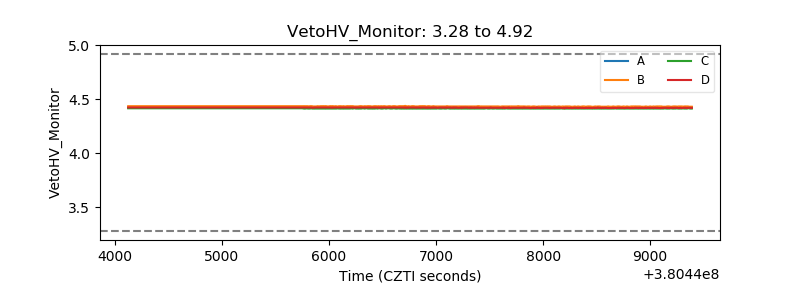 |
| Veto LLD | 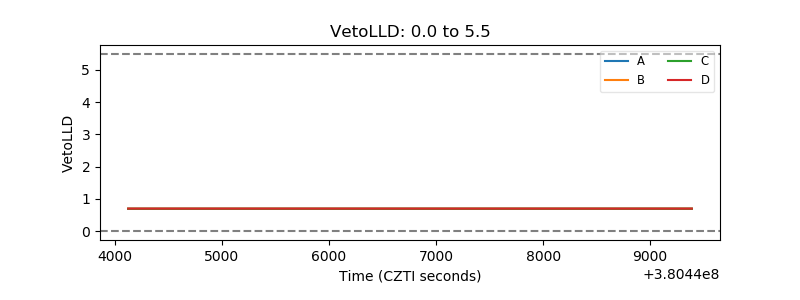 |
| Alpha Counter | 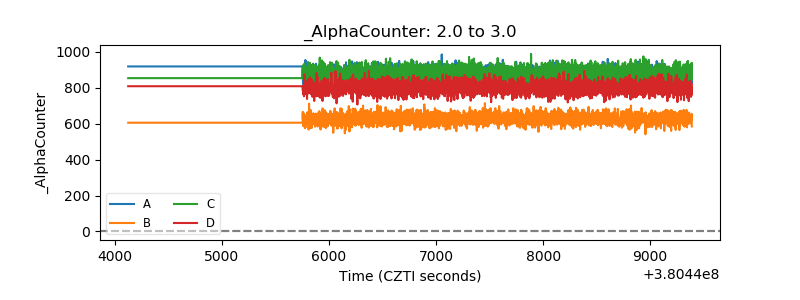 |
| _CPM_Rate | 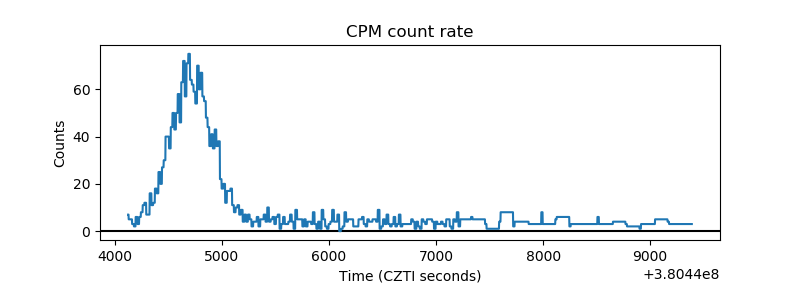 |
| CZT Counter | 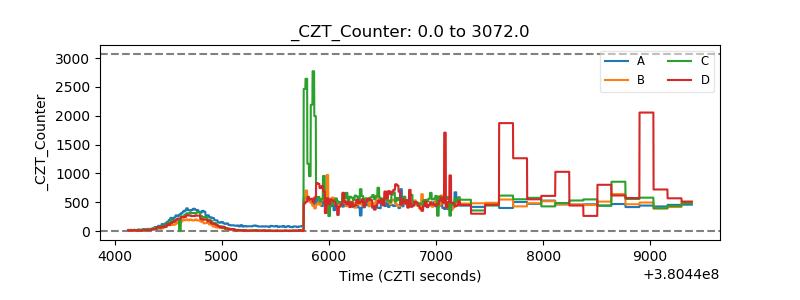 |
| +2.5 Volts monitor |  |
| +5 Volts monitor |  |
| _ROLL_ROT |  |
| _Roll_DEC |  |
| _Roll_RA | 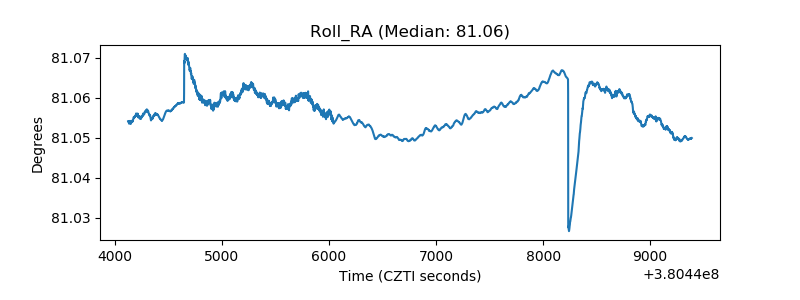 |
| Veto Counter | 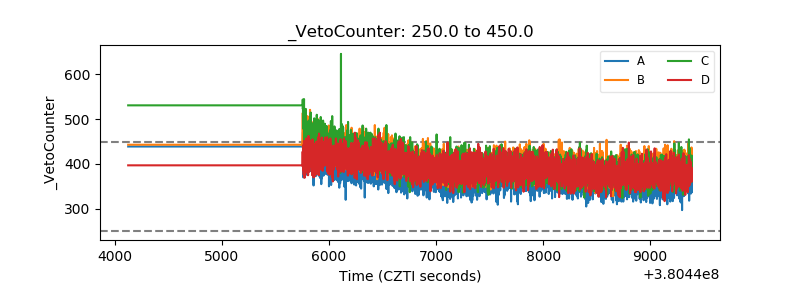 |