| Param | Original file | Final file |
|---|---|---|
| Filename | modeM0/AS1A11_054T07_9000004878cztM0_level2.fits | modeM0/AS1A11_054T07_9000004878cztM0_level2_quad_clean.evt |
| Size (bytes) | 425,975,040 | 455,768,640 |
| Size | 406.2 MB | 434.7 MB |
| Events in quadrant A | 2,624,632 | 2,807,851 |
| Events in quadrant B | 2,472,580 | 2,785,547 |
| Events in quadrant C | 2,539,652 | 2,684,360 |
| Events in quadrant D | 2,183,172 | 2,445,496 |
| Mode SS | |||
|---|---|---|---|
| Quadrant | BADHDUFLAG | Total packets | Discarded packets |
| A | 0 | 914 | 0 |
| B | 0 | 914 | 0 |
| C | 0 | 914 | 0 |
| D | 0 | 914 | 0 |
| Mode M0 | |||
|---|---|---|---|
| Quadrant | BADHDUFLAG | Total packets | Discarded packets |
| A | 0 | 90777 | 0 |
| B | 0 | 118172 | 0 |
| C | 0 | 103325 | 0 |
| D | 0 | 125898 | 0 |
| Mode M9 | |||
|---|---|---|---|
| Quadrant | BADHDUFLAG | Total packets | Discarded packets |
| A | 0 | 157 | 0 |
| B | 0 | 157 | 0 |
| C | 0 | 157 | 0 |
| D | 0 | 157 | 0 |
| Quadrant | Total seconds | Saturated seconds | Saturation percentage |
|---|---|---|---|
| A | 44875 | 36 | 0.080223% |
| B | 44875 | 2079 | 4.632869% |
| C | 44875 | 824 | 1.836212% |
| D | 44875 | 1003 | 2.235097% |
Noise dominated data is calculated using 1-second bins in cleaned event files. If a bin has >2000 counts, and if more than 50% of those come from <1% of pixels, then it is considered to be noise-dominated and hence unusable.
| Quadrant | # 1 sec bins | Bins with >0 counts | Bins with >2000 counts | High rate bins dominated by noise | Noise dominated (total time) | Noise dominated (detector-on time) | Marked lightcurve |
|---|---|---|---|---|---|---|---|
| A | 59472 | 44874 | 0 | 0 | 0.00% | 0.00% |  |
| B | 59472 | 44850 | 0 | 0 | 0.00% | 0.00% |  |
| C | 59472 | 44870 | 0 | 0 | 0.00% | 0.00% |  |
| D | 59472 | 44807 | 0 | 0 | 0.00% | 0.00% |  |
Top three noisy pixels from each quadrant. If the there are fewer than three noisy pixels in the level2.evt file, extra rows are filled as -1
| Pixel properties | Quadrant properties | ||||||
|---|---|---|---|---|---|---|---|
| Quadrant | DetID | PixID | Counts | Sigma | Mean | Median | Sigma |
| A | 9 | 19 | 2158 | 8.78 | 684 | 642 | 172.7 |
| A | 7 | 110 | 2098 | 8.43 | 684 | 642 | 172.7 |
| A | 0 | 29 | 2054 | 8.17 | 684 | 642 | 172.7 |
| B | 2 | 9 | 2197 | 12.3 | 654 | 625 | 127.8 |
| B | 3 | 80 | 1850 | 9.58 | 654 | 625 | 127.8 |
| B | 5 | 128 | 1681 | 8.26 | 654 | 625 | 127.8 |
| C | 1 | 81 | 2121 | 8.62 | 671 | 630 | 172.9 |
| C | 1 | 80 | 2059 | 8.26 | 671 | 630 | 172.9 |
| C | 3 | 203 | 1967 | 7.73 | 671 | 630 | 172.9 |
| D | 10 | 189 | 1631 | 6.34 | 624 | 569 | 167.5 |
| D | 7 | 3 | 1612 | 6.23 | 624 | 569 | 167.5 |
| D | 10 | 113 | 1596 | 6.13 | 624 | 569 | 167.5 |
Histogram calculated using DETX and DETY for each event in the final _common_clean file
| Quadrant A | 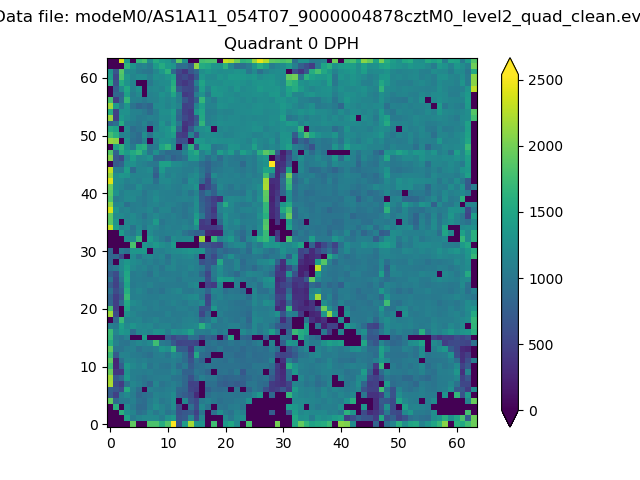 |
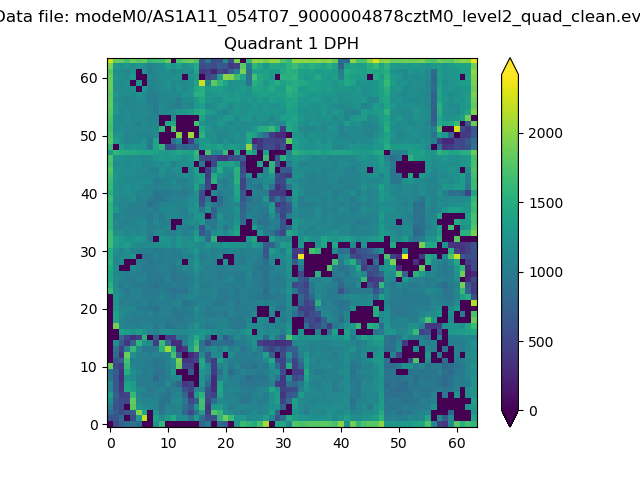 |
Quadrant B |
|---|---|---|---|
| Quadrant D |  |
 |
Quadrant C |
| Plot type | Count rate plots | Images |
|---|---|---|
| Comparison with Poisson distribution Blue bars denote a histogram of data divided into 1 sec bins. Red curve is a Poisson curve with rate = median count rate of data. |
 |
 |
| Quadrant-wise count rates Data is divided into 100 sec bins |
 |
|
| Module-wise count rates for Quadrant A Data is divided into 100 sec bins |
 |
 |
| Module-wise count rates for Quadrant B Data is divided into 100 sec bins |
 |
 |
| Module-wise count rates for Quadrant C Data is divided into 100 sec bins |
 |
 |
| Module-wise count rates for Quadrant D Data is divided into 100 sec bins |
 |
 |
| Parameter | Plot |
|---|---|
| CZT HV Monitor |  |
| D_VDD |  |
| Temperature 1 |  |
| Veto HV Monitor |  |
| Veto LLD |  |
| Alpha Counter |  |
| _CPM_Rate |  |
| CZT Counter |  |
| +2.5 Volts monitor |  |
| +5 Volts monitor |  |
| _ROLL_ROT |  |
| _Roll_DEC |  |
| _Roll_RA |  |
| Veto Counter |  |