| Param | Original file | Final file |
|---|---|---|
| Filename | modeM0/AS1A11_054T07_9000004878_34151cztM0_level2.evt | modeM0/AS1A11_054T07_9000004878_34151cztM0_level2_quad_clean.evt |
| Size (bytes) | 69,811,200 | 16,358,400 |
| Size | 66.6 MB | 15.6 MB |
| Events in quadrant A | 395,271 | 108,062 |
| Events in quadrant B | 470,600 | 111,843 |
| Events in quadrant C | 580,515 | 105,474 |
| Events in quadrant D | 605,294 | 101,132 |
| Mode SS | |||
|---|---|---|---|
| Quadrant | BADHDUFLAG | Total packets | Discarded packets |
| A | 0 | 16 | 0 |
| B | 0 | 16 | 0 |
| C | 0 | 16 | 0 |
| D | 0 | 16 | 0 |
| Mode M0 | |||
|---|---|---|---|
| Quadrant | BADHDUFLAG | Total packets | Discarded packets |
| A | 0 | 1767 | 2 |
| B | 0 | 1969 | 1 |
| C | 0 | 2251 | 1 |
| D | 0 | 2410 | 1 |
| Mode M9 | |||
|---|---|---|---|
| Quadrant | BADHDUFLAG | Total packets | Discarded packets |
| A | 0 | 11 | 0 |
| B | 0 | 11 | 0 |
| C | 0 | 11 | 0 |
| D | 0 | 11 | 0 |
| Quadrant | Total seconds | Saturated seconds | Saturation percentage |
|---|---|---|---|
| A | 878 | 1 | 0.113895% |
| B | 878 | 13 | 1.480638% |
| C | 878 | 59 | 6.719818% |
| D | 878 | 34 | 3.872437% |
Noise dominated data is calculated using 1-second bins in cleaned event files. If a bin has >2000 counts, and if more than 50% of those come from <1% of pixels, then it is considered to be noise-dominated and hence unusable.
| Quadrant | # 1 sec bins | Bins with >0 counts | Bins with >2000 counts | High rate bins dominated by noise | Noise dominated (total time) | Noise dominated (detector-on time) | Marked lightcurve |
|---|---|---|---|---|---|---|---|
| A | 878 | 878 | 0 | 0 | 0.00% | 0.00% | 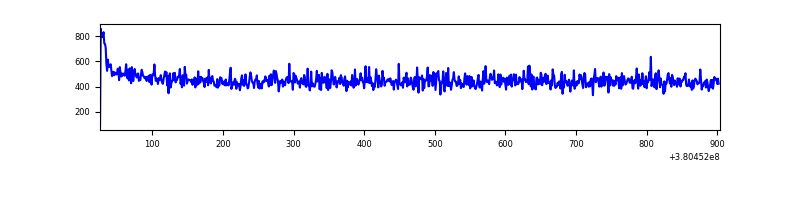 |
| B | 878 | 878 | 13 | 13 | 1.48% | 1.48% | 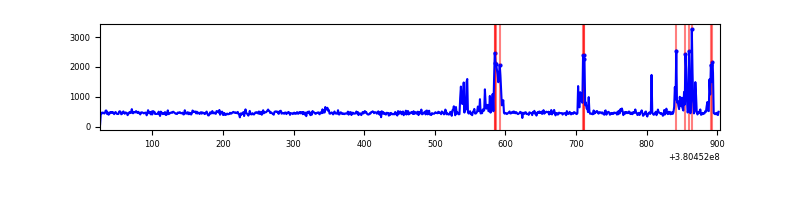 |
| C | 878 | 878 | 51 | 51 | 5.81% | 5.81% | 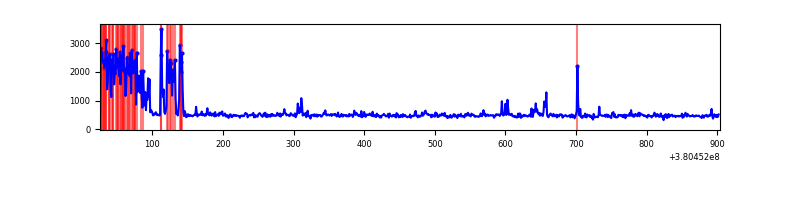 |
| D | 878 | 878 | 29 | 29 | 3.30% | 3.30% | 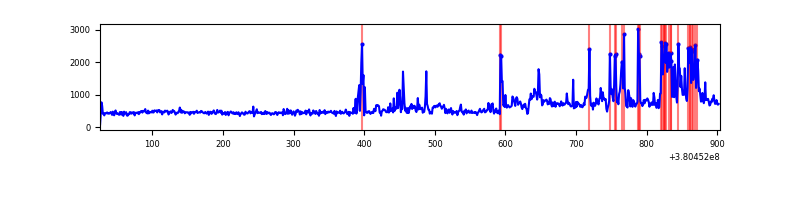 |
Top three noisy pixels from each quadrant. If the there are fewer than three noisy pixels in the level2.evt file, extra rows are filled as -1
| Pixel properties | Quadrant properties | ||||||
|---|---|---|---|---|---|---|---|
| Quadrant | DetID | PixID | Counts | Sigma | Mean | Median | Sigma |
| A | 10 | 83 | 9060 | 412.03 | 99 | 98 | 21.8 |
| A | 13 | 254 | 1316 | 56.0 | 99 | 98 | 21.8 |
| A | 3 | 137 | 987 | 40.87 | 99 | 98 | 21.8 |
| B | 5 | 255 | 36774 | 1726.15 | 98 | 96 | 21.2 |
| B | 5 | 172 | 35080 | 1646.43 | 98 | 96 | 21.2 |
| B | 0 | 229 | 4532 | 208.77 | 98 | 96 | 21.2 |
| C | 0 | 10 | 166887 | 7256.57 | 92 | 93 | 23.0 |
| C | 15 | 214 | 42423 | 1841.62 | 92 | 93 | 23.0 |
| C | 6 | 96 | 5104 | 218.01 | 92 | 93 | 23.0 |
| D | 8 | 195 | 91013 | 3721.23 | 93 | 90 | 24.4 |
| D | 2 | 250 | 38863 | 1586.87 | 93 | 90 | 24.4 |
| D | 10 | 118 | 33068 | 1349.7 | 93 | 90 | 24.4 |
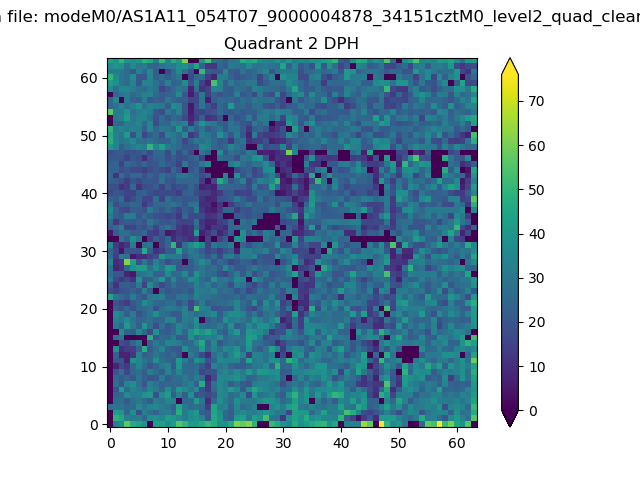
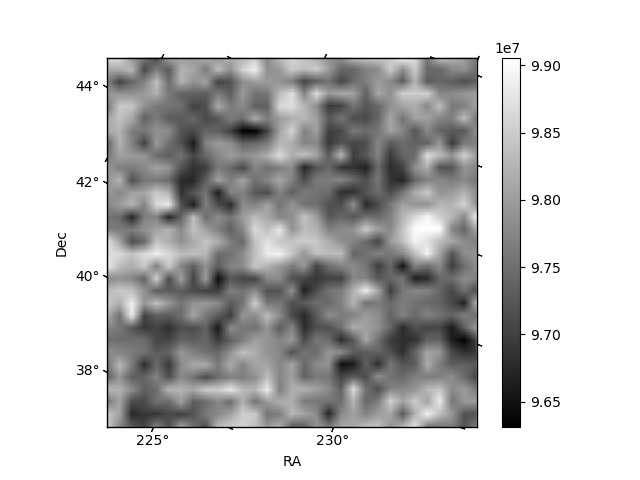
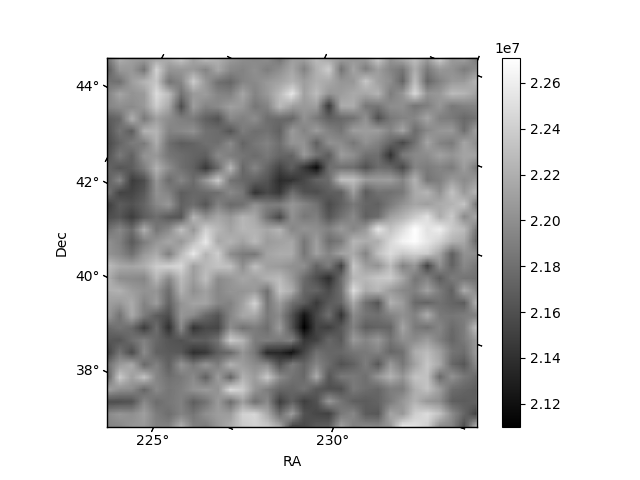
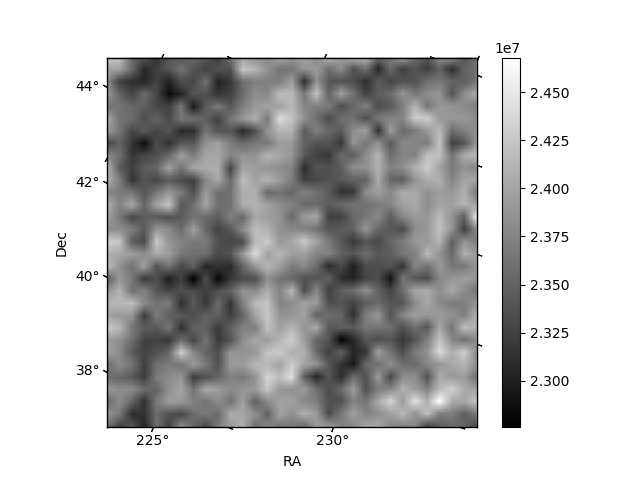
Histogram calculated using DETX and DETY for each event in the final _common_clean file
| Quadrant A | 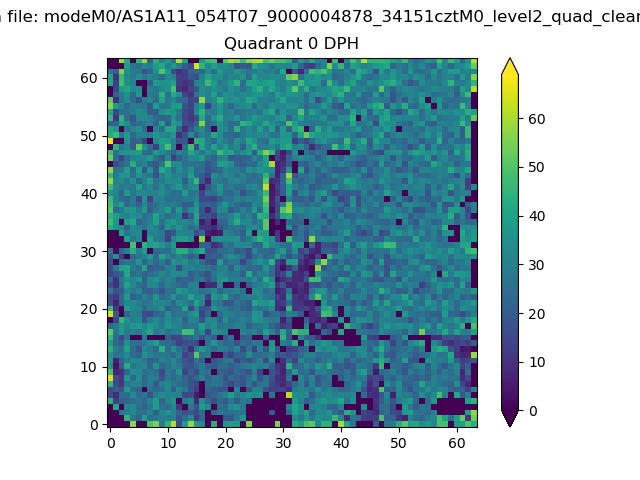 |
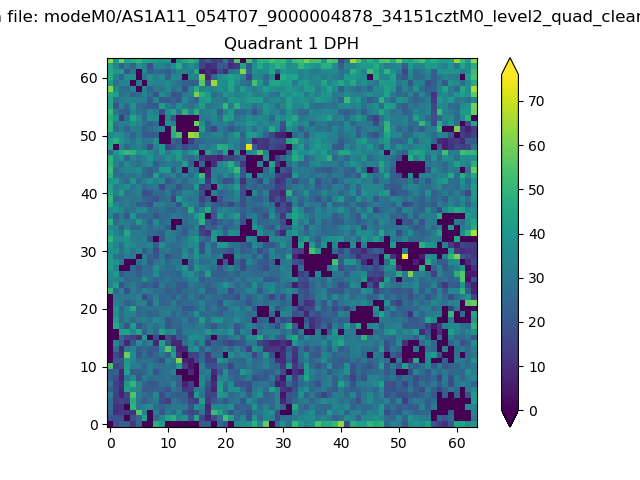 |
Quadrant B |
|---|---|---|---|
| Quadrant D | 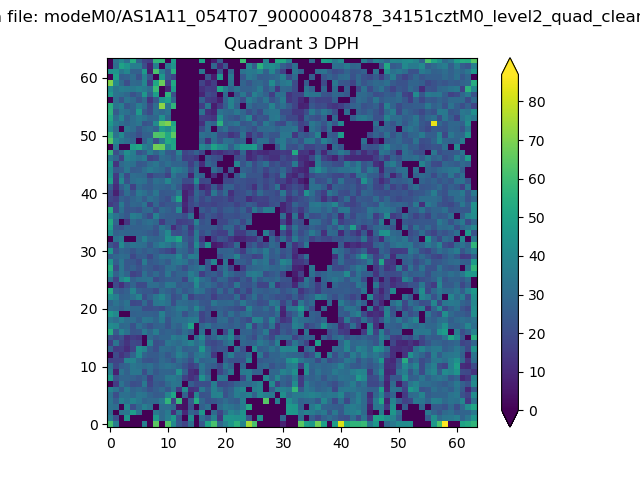 |
 |
Quadrant C |
| Plot type | Count rate plots | Images |
|---|---|---|
| Comparison with Poisson distribution Blue bars denote a histogram of data divided into 1 sec bins. Red curve is a Poisson curve with rate = median count rate of data. |
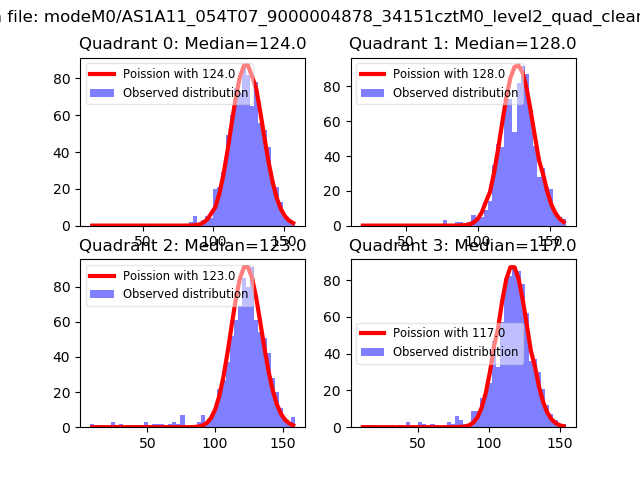 |
 |
| Quadrant-wise count rates Data is divided into 100 sec bins |
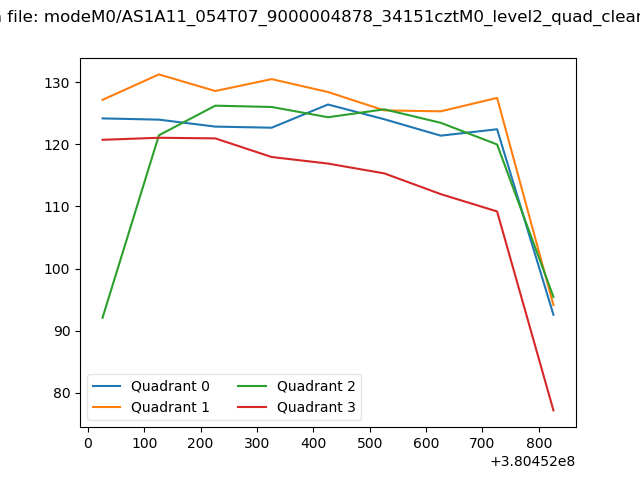 |
|
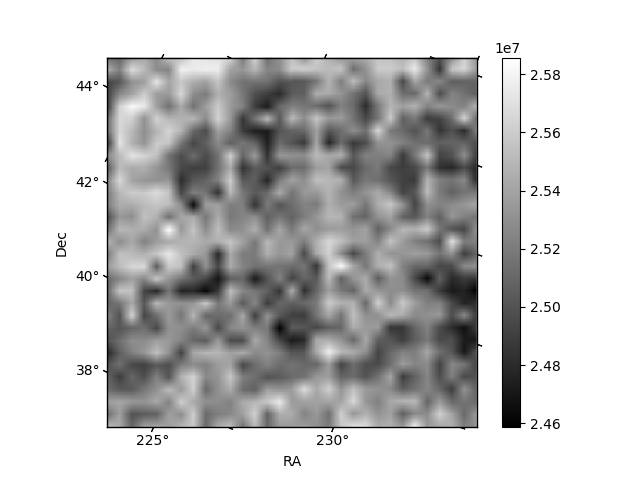
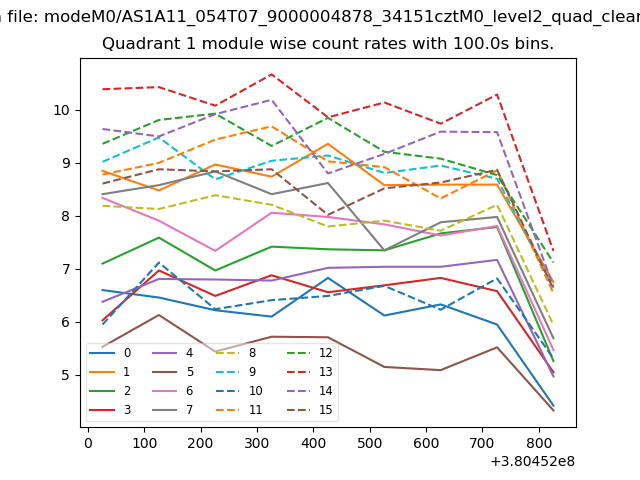
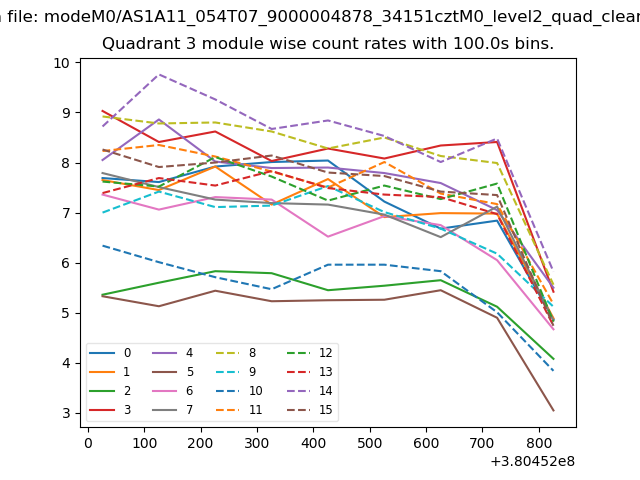
| Module-wise count rates for Quadrant A Data is divided into 100 sec bins |
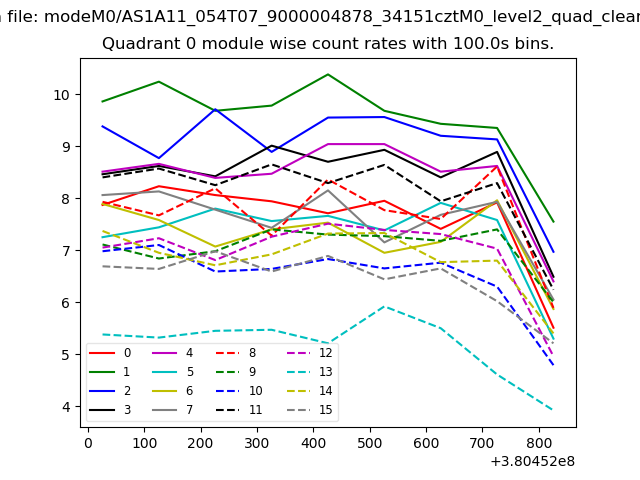 |
 |
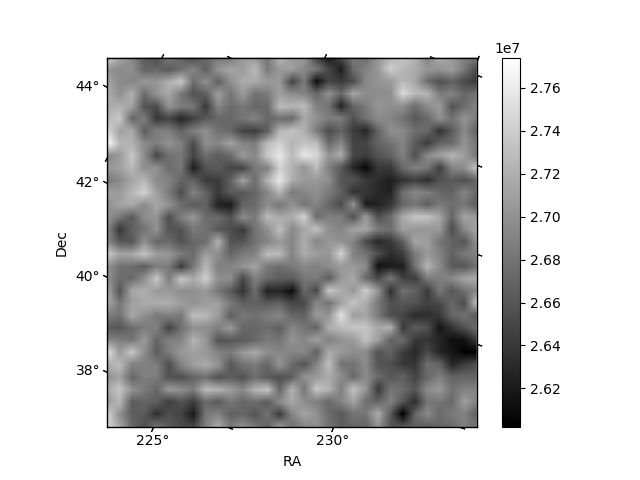
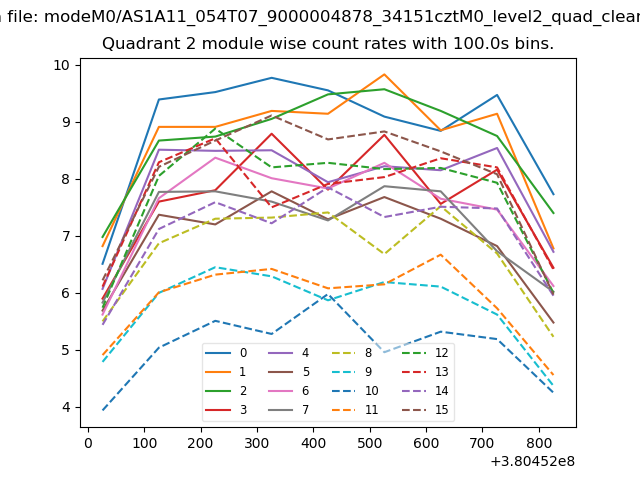
| Module-wise count rates for Quadrant B Data is divided into 100 sec bins |
 |
 |
| Module-wise count rates for Quadrant C Data is divided into 100 sec bins |
 |
 |
| Module-wise count rates for Quadrant D Data is divided into 100 sec bins |
 |
 |
| Parameter | Plot |
|---|---|
| CZT HV Monitor | 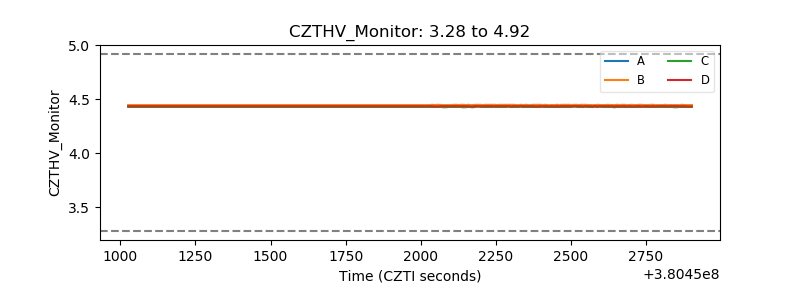 |
| D_VDD | 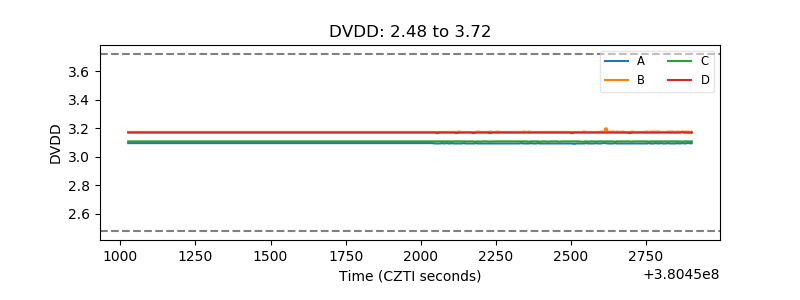 |
| Temperature 1 | 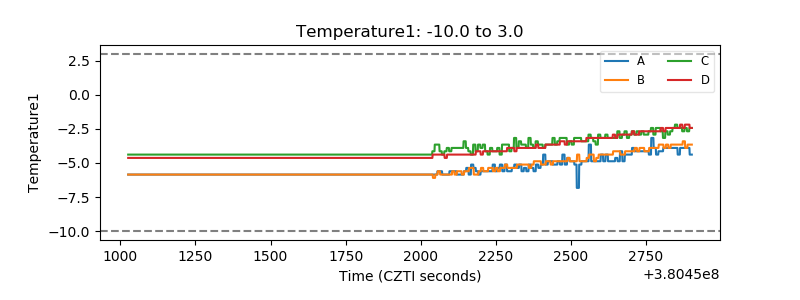 |
| Veto HV Monitor | 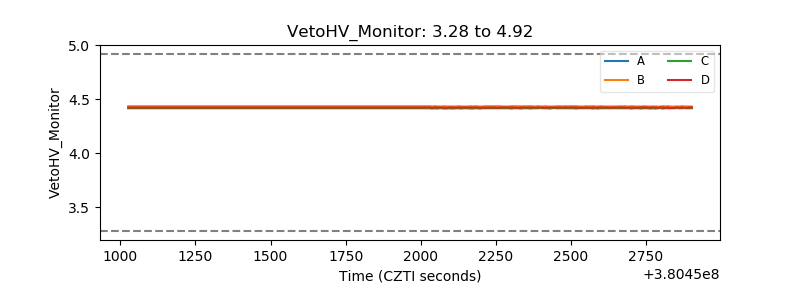 |
| Veto LLD | 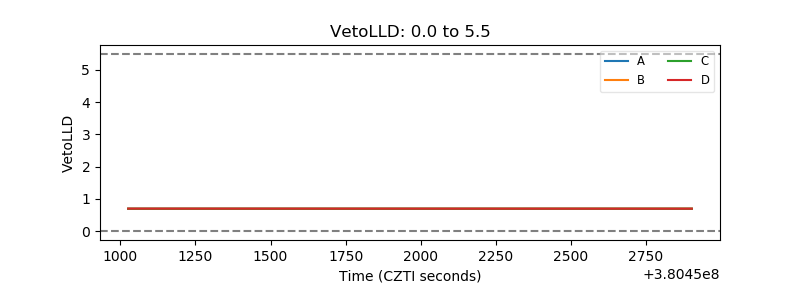 |
| Alpha Counter | 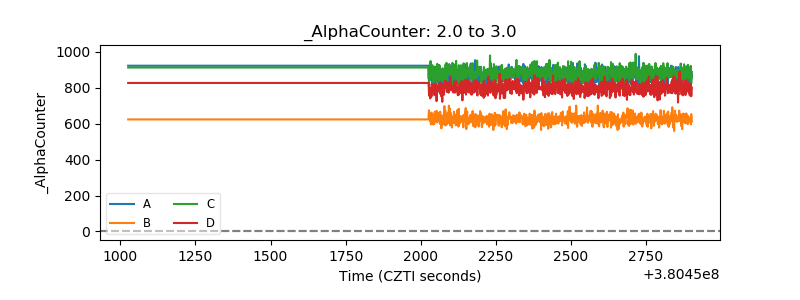 |
| _CPM_Rate | 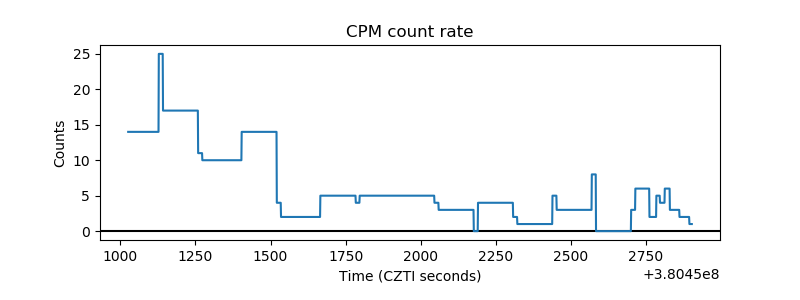 |
| CZT Counter | 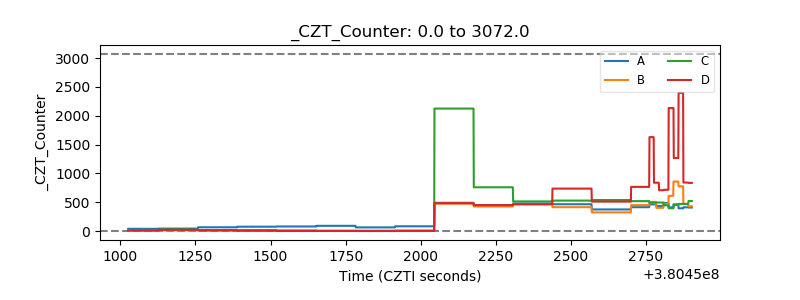 |
| +2.5 Volts monitor | 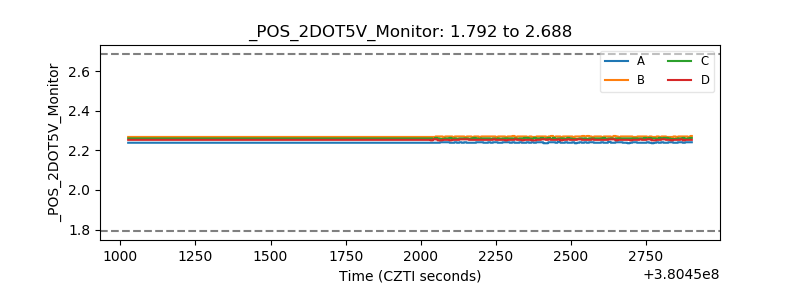 |
| +5 Volts monitor |  |
| _ROLL_ROT | 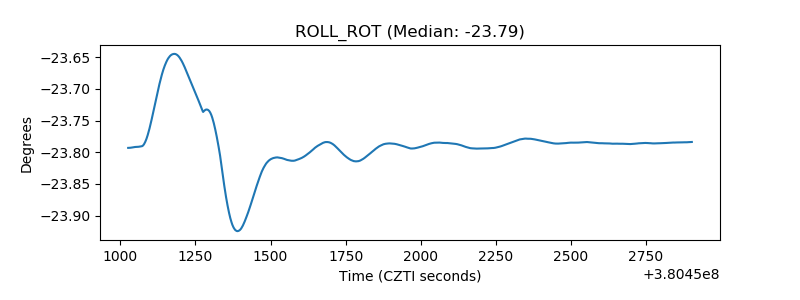 |
| _Roll_DEC | 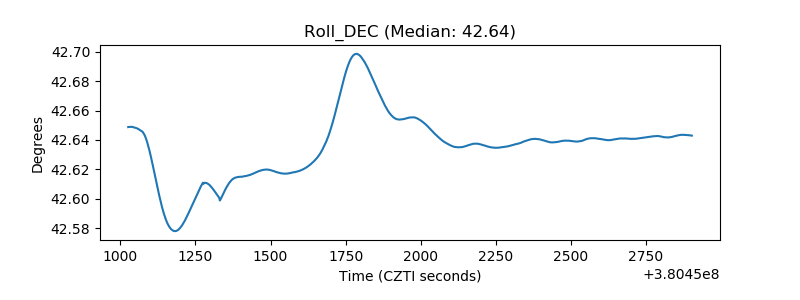 |
| _Roll_RA | 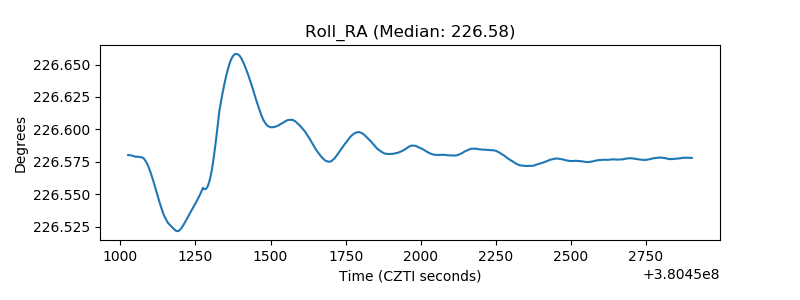 |
| Veto Counter | 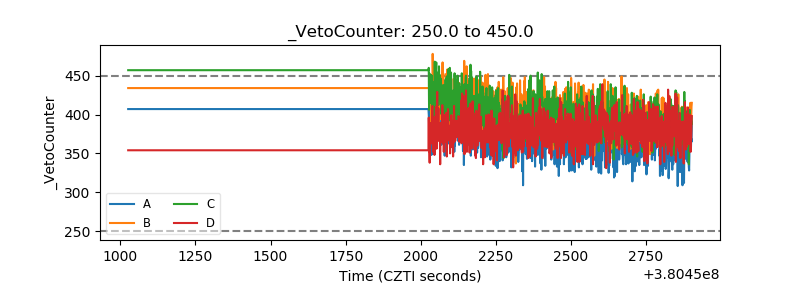 |