| Param | Original file | Final file |
|---|---|---|
| Filename | modeM0/AS1A11_054T07_9000004878_34152cztM0_level2.evt | modeM0/AS1A11_054T07_9000004878_34152cztM0_level2_quad_clean.evt |
| Size (bytes) | 476,095,680 | 71,300,160 |
| Size | 454.0 MB | 68.0 MB |
| Events in quadrant A | 2,681,915 | 444,997 |
| Events in quadrant B | 4,206,951 | 450,003 |
| Events in quadrant C | 3,203,504 | 440,783 |
| Events in quadrant D | 3,930,809 | 415,804 |
| Mode SS | |||
|---|---|---|---|
| Quadrant | BADHDUFLAG | Total packets | Discarded packets |
| A | 0 | 118 | 0 |
| B | 0 | 118 | 0 |
| C | 0 | 118 | 0 |
| D | 0 | 118 | 0 |
| Mode M0 | |||
|---|---|---|---|
| Quadrant | BADHDUFLAG | Total packets | Discarded packets |
| A | 0 | 11707 | 3 |
| B | 0 | 16199 | 2 |
| C | 0 | 12805 | 2 |
| D | 0 | 15542 | 2 |
| Mode M9 | |||
|---|---|---|---|
| Quadrant | BADHDUFLAG | Total packets | Discarded packets |
| A | 0 | 13 | 0 |
| B | 0 | 13 | 0 |
| C | 0 | 13 | 0 |
| D | 0 | 13 | 0 |
| Quadrant | Total seconds | Saturated seconds | Saturation percentage |
|---|---|---|---|
| A | 5829 | 2 | 0.034311% |
| B | 5829 | 404 | 6.930863% |
| C | 5829 | 66 | 1.132270% |
| D | 5829 | 98 | 1.681249% |
Noise dominated data is calculated using 1-second bins in cleaned event files. If a bin has >2000 counts, and if more than 50% of those come from <1% of pixels, then it is considered to be noise-dominated and hence unusable.
| Quadrant | # 1 sec bins | Bins with >0 counts | Bins with >2000 counts | High rate bins dominated by noise | Noise dominated (total time) | Noise dominated (detector-on time) | Marked lightcurve |
|---|---|---|---|---|---|---|---|
| A | 7172 | 5830 | 0 | 0 | 0.00% | 0.00% | 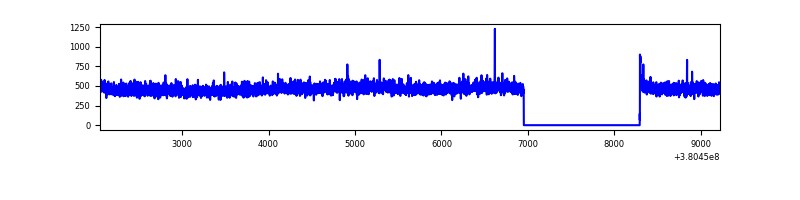 |
| B | 7172 | 5830 | 315 | 315 | 4.39% | 5.40% | 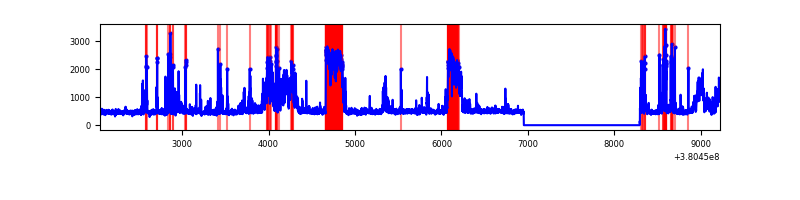 |
| C | 7172 | 5830 | 62 | 62 | 0.86% | 1.06% | 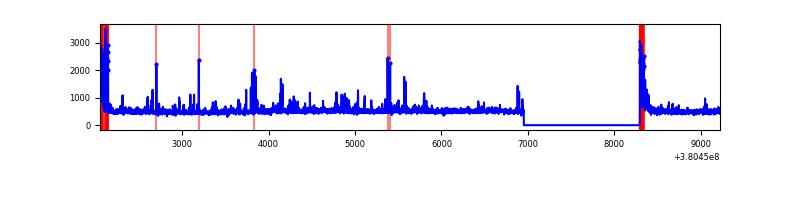 |
| D | 7172 | 5830 | 83 | 83 | 1.16% | 1.42% | 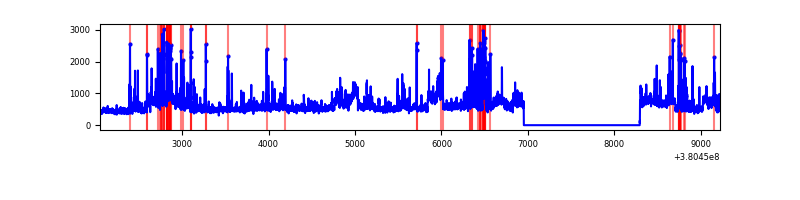 |
Top three noisy pixels from each quadrant. If the there are fewer than three noisy pixels in the level2.evt file, extra rows are filled as -1
| Pixel properties | Quadrant properties | ||||||
|---|---|---|---|---|---|---|---|
| Quadrant | DetID | PixID | Counts | Sigma | Mean | Median | Sigma |
| A | 13 | 6 | 28177 | 200.9 | 681 | 667 | 136.9 |
| A | 10 | 83 | 17411 | 122.28 | 681 | 667 | 136.9 |
| A | 13 | 254 | 9983 | 68.03 | 681 | 667 | 136.9 |
| B | 5 | 31 | 469037 | 3651.0 | 665 | 647 | 128.3 |
| B | 5 | 15 | 400456 | 3116.43 | 665 | 647 | 128.3 |
| B | 5 | 255 | 225156 | 1750.0 | 665 | 647 | 128.3 |
| C | 0 | 10 | 312992 | 2025.92 | 660 | 665 | 154.2 |
| C | 15 | 214 | 249837 | 1616.27 | 660 | 665 | 154.2 |
| C | 6 | 96 | 31667 | 201.1 | 660 | 665 | 154.2 |
| D | 8 | 195 | 704340 | 4341.64 | 659 | 639 | 162.1 |
| D | 10 | 118 | 253658 | 1561.06 | 659 | 639 | 162.1 |
| D | 13 | 249 | 117805 | 722.88 | 659 | 639 | 162.1 |
Histogram calculated using DETX and DETY for each event in the final _common_clean file
| Quadrant A | 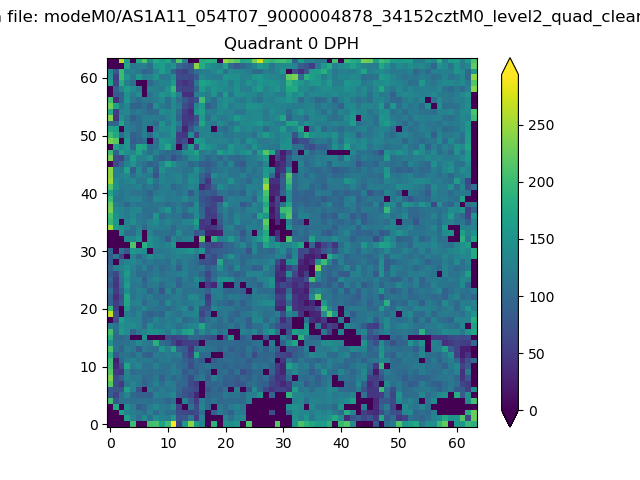 |
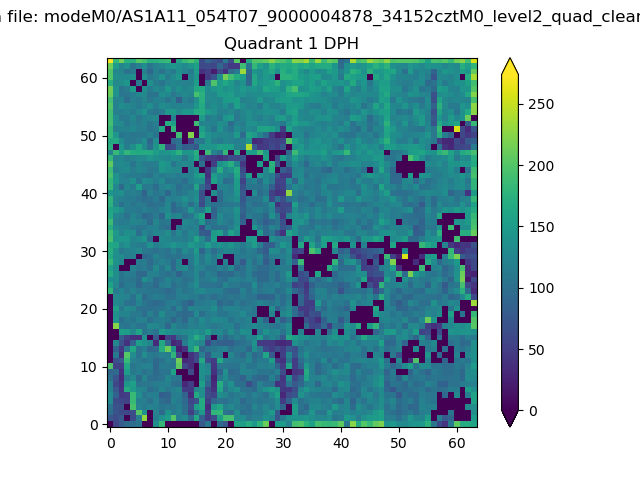 |
Quadrant B |
|---|---|---|---|
| Quadrant D | 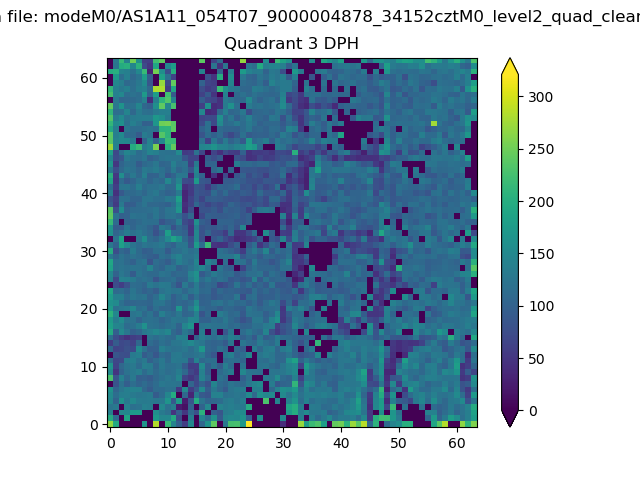 |
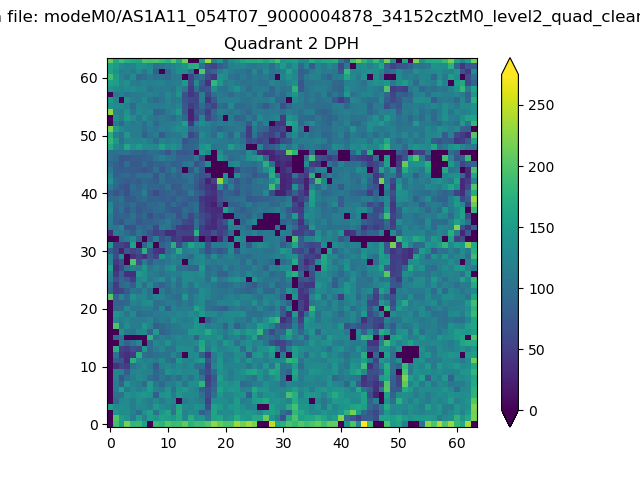 |
Quadrant C |
| Plot type | Count rate plots | Images |
|---|---|---|
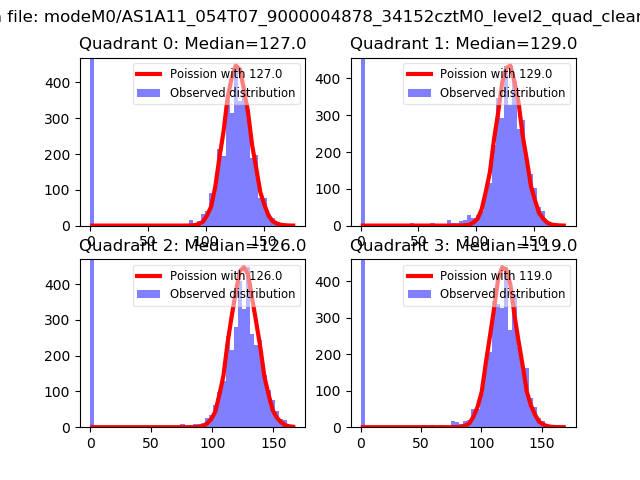
| Comparison with Poisson distribution Blue bars denote a histogram of data divided into 1 sec bins. Red curve is a Poisson curve with rate = median count rate of data. |
 |
 |
| Quadrant-wise count rates Data is divided into 100 sec bins |
 |
|
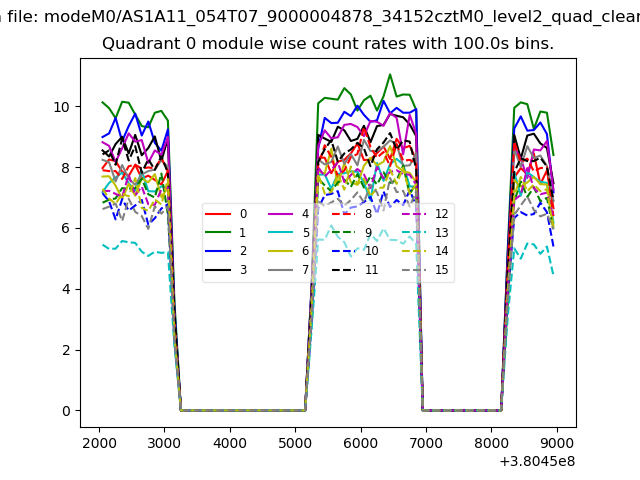
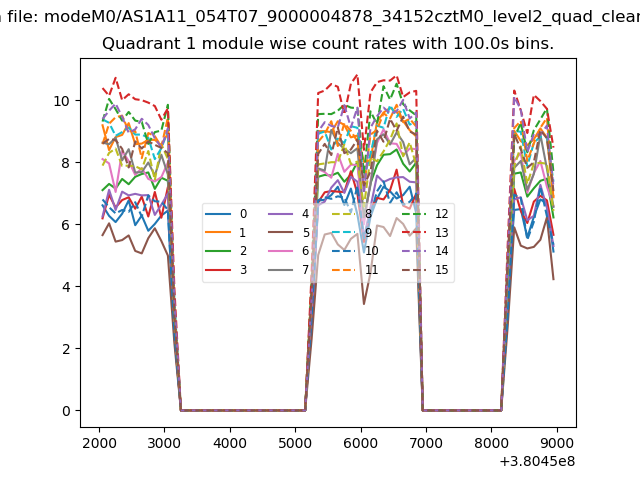
| Module-wise count rates for Quadrant A Data is divided into 100 sec bins |
 |
 |
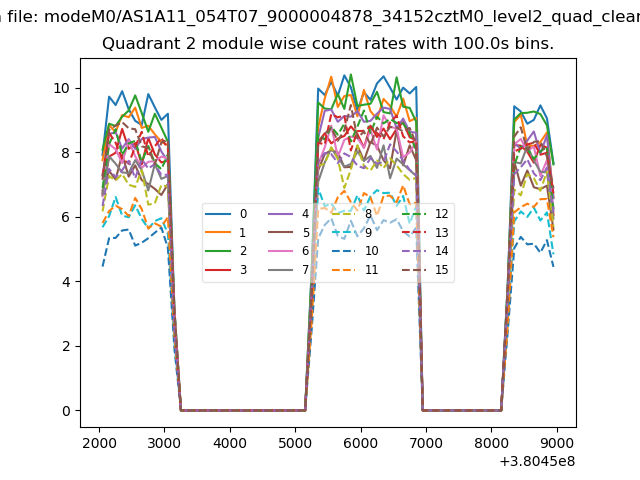
| Module-wise count rates for Quadrant B Data is divided into 100 sec bins |
 |
 |
| Module-wise count rates for Quadrant C Data is divided into 100 sec bins |
 |
 |
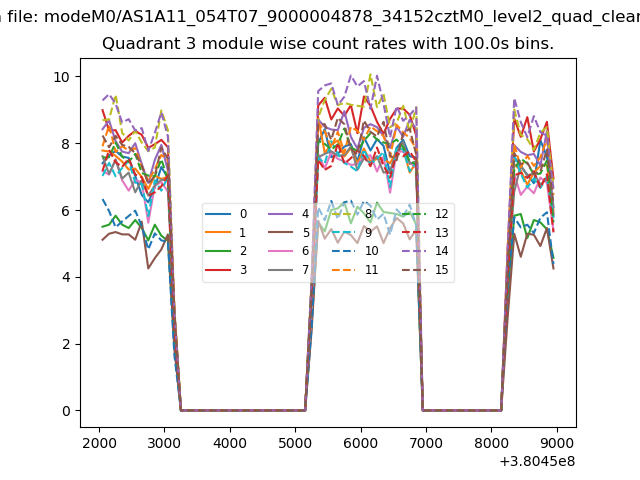
| Module-wise count rates for Quadrant D Data is divided into 100 sec bins |
 |
 |
| Parameter | Plot |
|---|---|
| CZT HV Monitor | 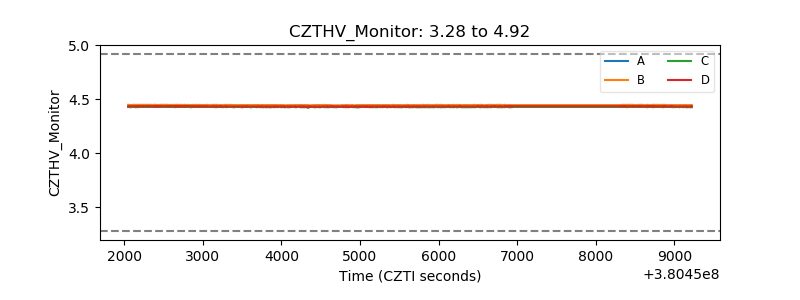 |
| D_VDD | 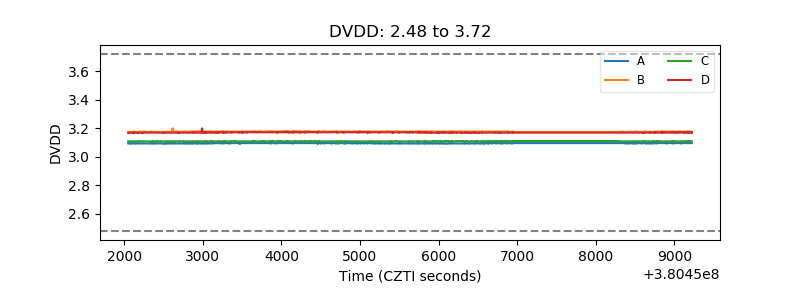 |
| Temperature 1 | 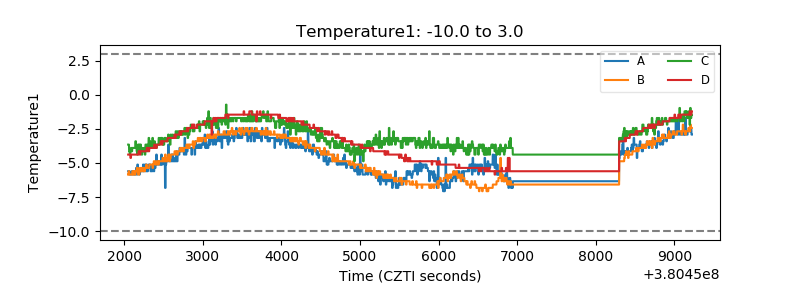 |
| Veto HV Monitor | 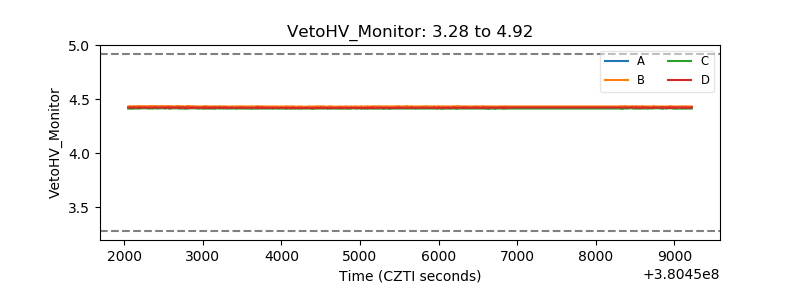 |
| Veto LLD | 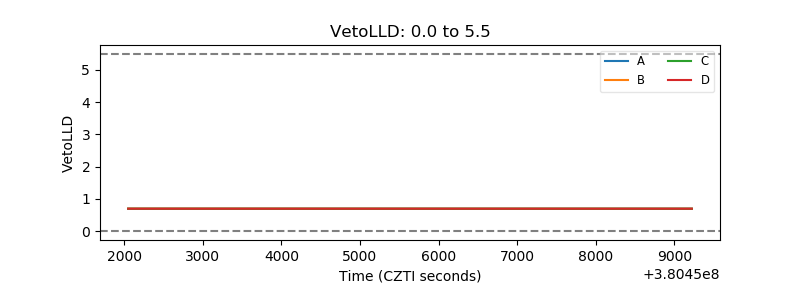 |
| Alpha Counter | 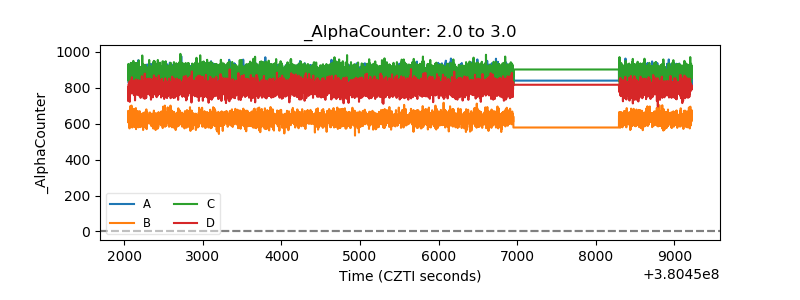 |
| _CPM_Rate | 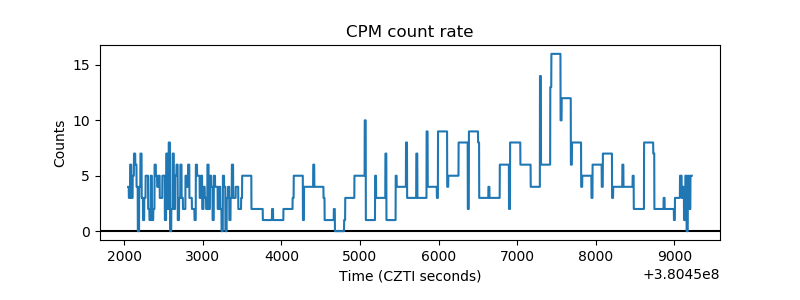 |
| CZT Counter | 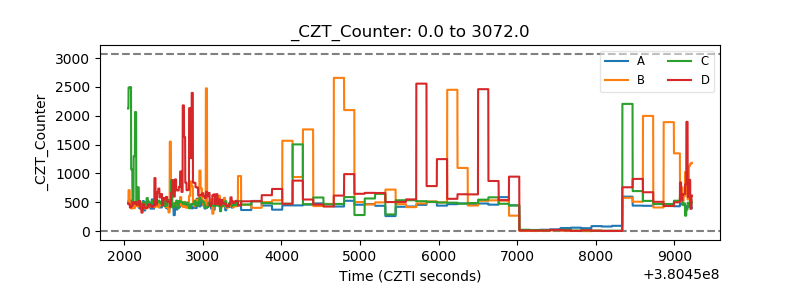 |
| +2.5 Volts monitor |  |
| +5 Volts monitor |  |
| _ROLL_ROT | 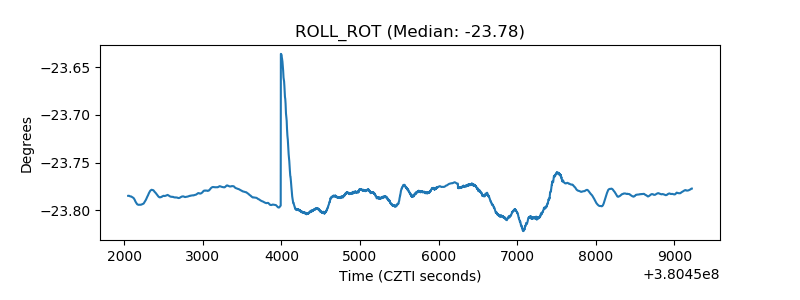 |
| _Roll_DEC | 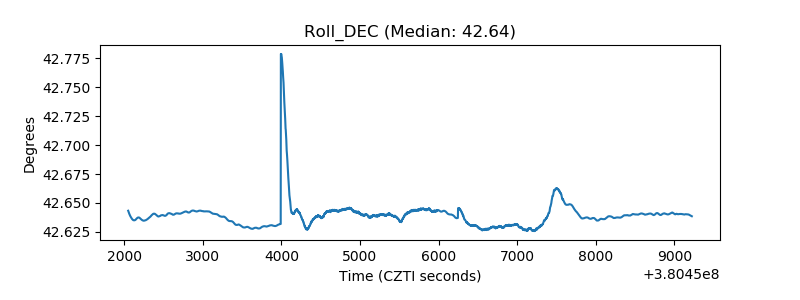 |
| _Roll_RA | 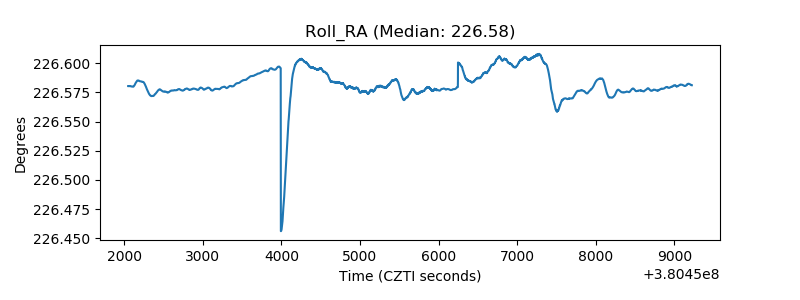 |
| Veto Counter | 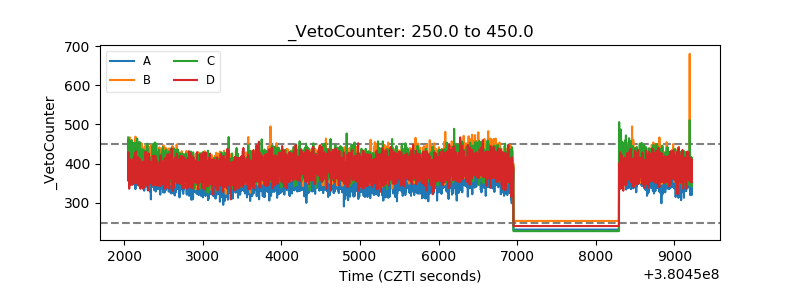 |