| Param | Original file | Final file |
|---|---|---|
| Filename | modeM0/AS1A11_054T07_9000004878_34153cztM0_level2.evt | modeM0/AS1A11_054T07_9000004878_34153cztM0_level2_quad_clean.evt |
| Size (bytes) | 567,371,520 | 64,866,240 |
| Size | 541.1 MB | 61.9 MB |
| Events in quadrant A | 2,770,392 | 396,135 |
| Events in quadrant B | 6,529,967 | 384,300 |
| Events in quadrant C | 3,327,138 | 389,730 |
| Events in quadrant D | 4,146,713 | 371,994 |
| Mode SS | |||
|---|---|---|---|
| Quadrant | BADHDUFLAG | Total packets | Discarded packets |
| A | 0 | 124 | 0 |
| B | 0 | 124 | 0 |
| C | 0 | 124 | 0 |
| D | 0 | 124 | 0 |
| Mode M0 | |||
|---|---|---|---|
| Quadrant | BADHDUFLAG | Total packets | Discarded packets |
| A | 0 | 12117 | 3 |
| B | 0 | 23412 | 2 |
| C | 0 | 13287 | 2 |
| D | 0 | 16495 | 2 |
| Mode M9 | |||
|---|---|---|---|
| Quadrant | BADHDUFLAG | Total packets | Discarded packets |
| A | 0 | 13 | 0 |
| B | 0 | 13 | 0 |
| C | 0 | 13 | 0 |
| D | 0 | 13 | 0 |
| Quadrant | Total seconds | Saturated seconds | Saturation percentage |
|---|---|---|---|
| A | 6032 | 7 | 0.116048% |
| B | 6032 | 998 | 16.545093% |
| C | 6032 | 84 | 1.392573% |
| D | 6032 | 56 | 0.928382% |
Noise dominated data is calculated using 1-second bins in cleaned event files. If a bin has >2000 counts, and if more than 50% of those come from <1% of pixels, then it is considered to be noise-dominated and hence unusable.
| Quadrant | # 1 sec bins | Bins with >0 counts | Bins with >2000 counts | High rate bins dominated by noise | Noise dominated (total time) | Noise dominated (detector-on time) | Marked lightcurve |
|---|---|---|---|---|---|---|---|
| A | 7344 | 6033 | 1 | 1 | 0.01% | 0.02% | 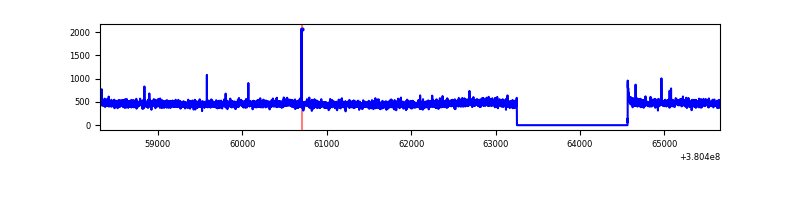 |
| B | 7344 | 6033 | 736 | 736 | 10.02% | 12.20% | 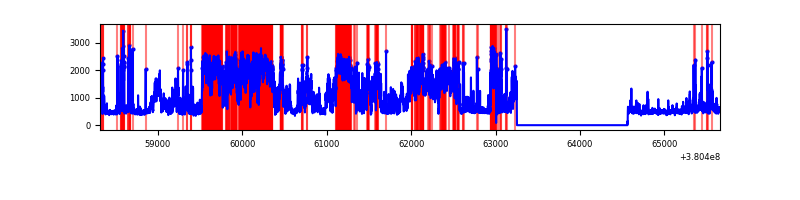 |
| C | 7344 | 6033 | 65 | 65 | 0.89% | 1.08% | 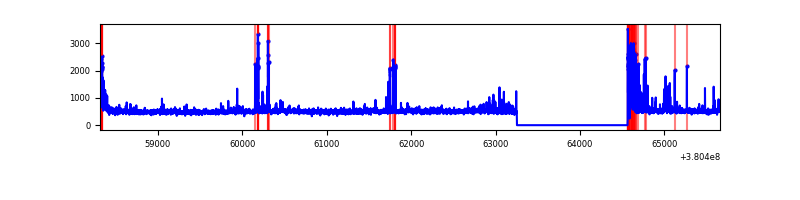 |
| D | 7344 | 6033 | 31 | 31 | 0.42% | 0.51% | 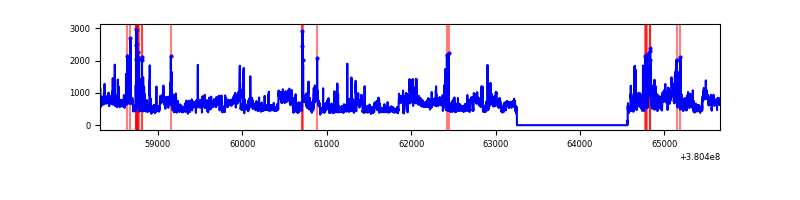 |
Top three noisy pixels from each quadrant. If the there are fewer than three noisy pixels in the level2.evt file, extra rows are filled as -1
| Pixel properties | Quadrant properties | ||||||
|---|---|---|---|---|---|---|---|
| Quadrant | DetID | PixID | Counts | Sigma | Mean | Median | Sigma |
| A | 10 | 83 | 17712 | 117.8 | 710 | 695 | 144.5 |
| A | 13 | 254 | 10490 | 67.81 | 710 | 695 | 144.5 |
| A | 3 | 137 | 7298 | 45.71 | 710 | 695 | 144.5 |
| B | 5 | 31 | 1591375 | 12179.83 | 678 | 661 | 130.6 |
| B | 5 | 15 | 1157705 | 8859.29 | 678 | 661 | 130.6 |
| B | 5 | 14 | 406217 | 3105.27 | 678 | 661 | 130.6 |
| C | 0 | 10 | 300339 | 1865.85 | 684 | 689 | 160.6 |
| C | 15 | 214 | 256144 | 1590.66 | 684 | 689 | 160.6 |
| C | 15 | 159 | 45454 | 278.74 | 684 | 689 | 160.6 |
| D | 8 | 195 | 983410 | 5807.79 | 686 | 665 | 169.2 |
| D | 10 | 118 | 202298 | 1191.6 | 686 | 665 | 169.2 |
| D | 13 | 249 | 107390 | 630.72 | 686 | 665 | 169.2 |
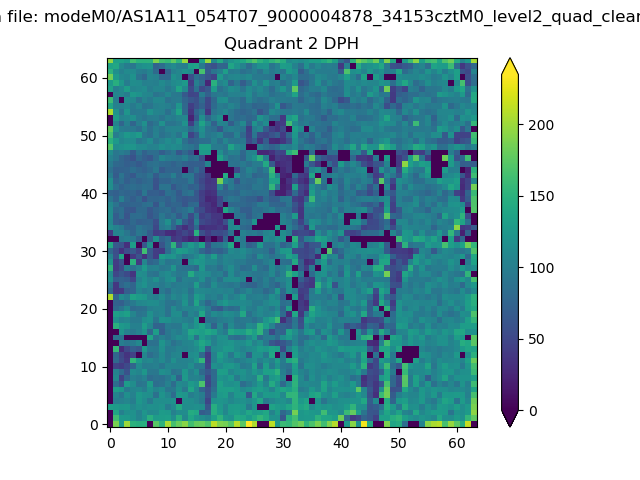
Histogram calculated using DETX and DETY for each event in the final _common_clean file
| Quadrant A | 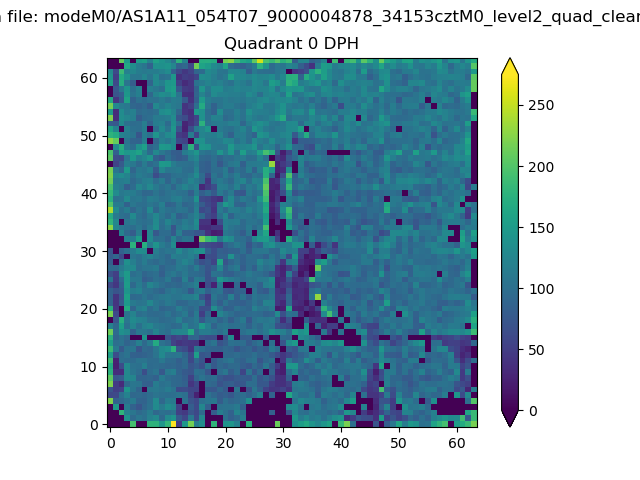 |
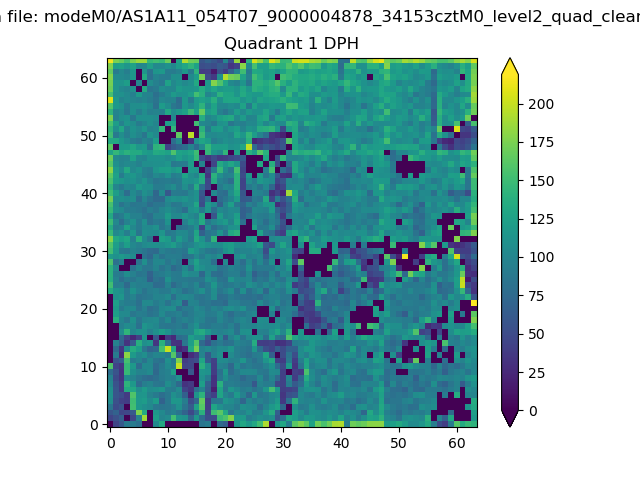 |
Quadrant B |
|---|---|---|---|
| Quadrant D | 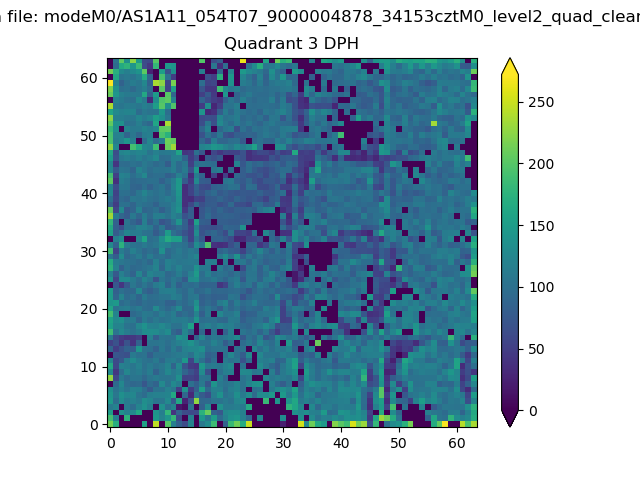 |
 |
Quadrant C |
| Plot type | Count rate plots | Images |
|---|---|---|
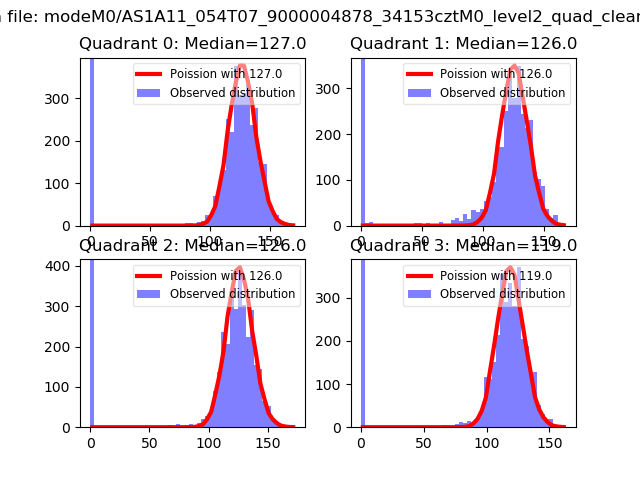
| Comparison with Poisson distribution Blue bars denote a histogram of data divided into 1 sec bins. Red curve is a Poisson curve with rate = median count rate of data. |
 |
 |
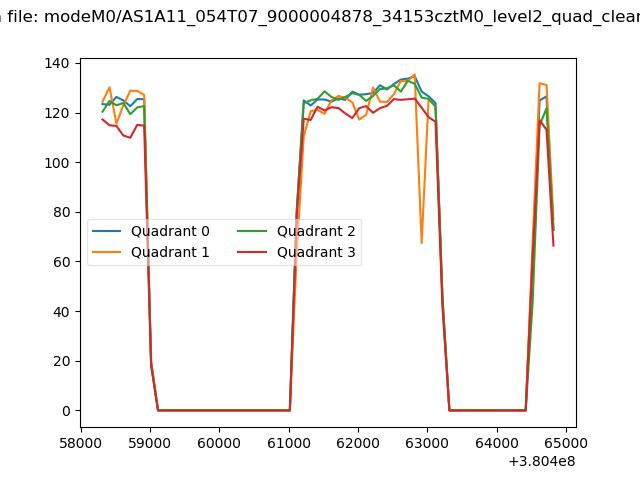
| Quadrant-wise count rates Data is divided into 100 sec bins |
 |
|
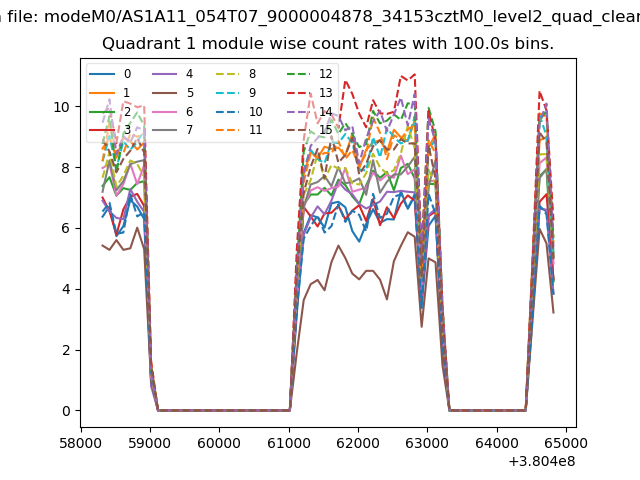
| Module-wise count rates for Quadrant A Data is divided into 100 sec bins |
 |
 |
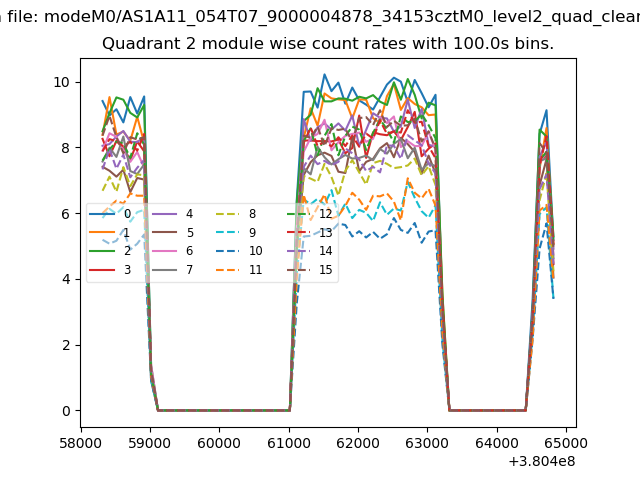
| Module-wise count rates for Quadrant B Data is divided into 100 sec bins |
 |
 |
| Module-wise count rates for Quadrant C Data is divided into 100 sec bins |
 |
 |
| Module-wise count rates for Quadrant D Data is divided into 100 sec bins |
 |
 |
| Parameter | Plot |
|---|---|
| CZT HV Monitor | 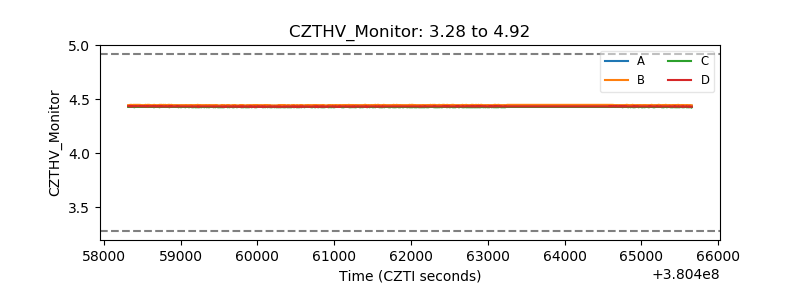 |
| D_VDD | 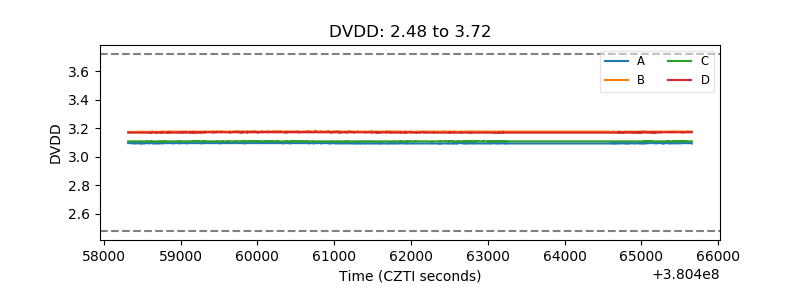 |
| Temperature 1 | 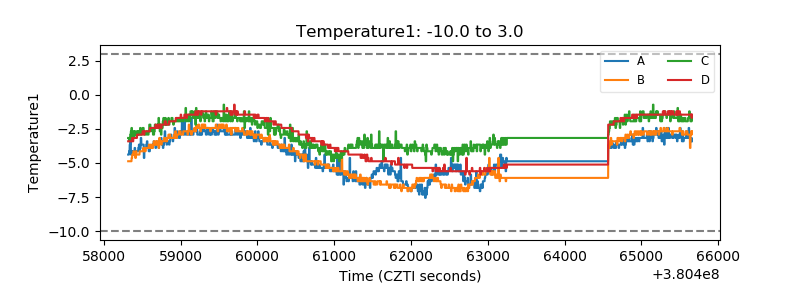 |
| Veto HV Monitor |  |
| Veto LLD | 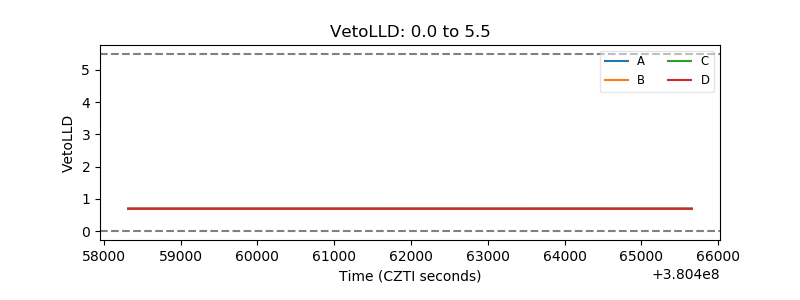 |
| Alpha Counter | 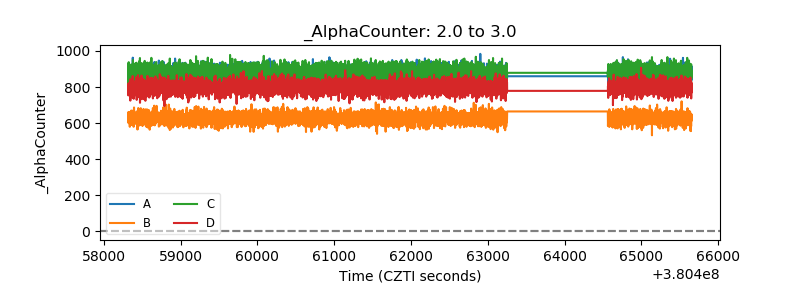 |
| _CPM_Rate | 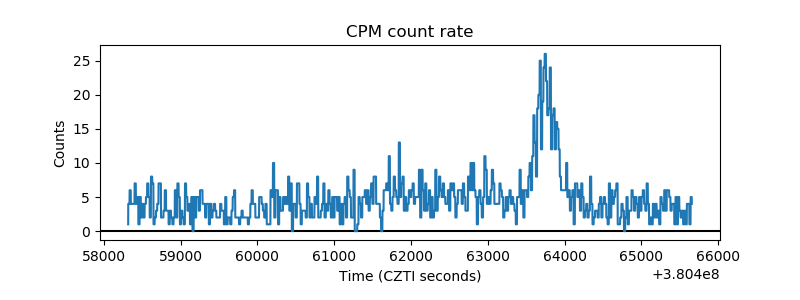 |
| CZT Counter | 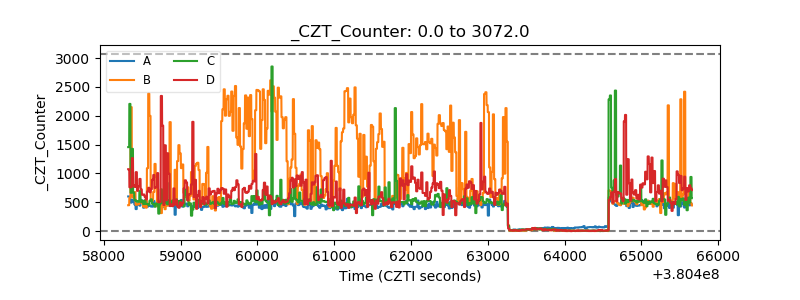 |
| +2.5 Volts monitor | 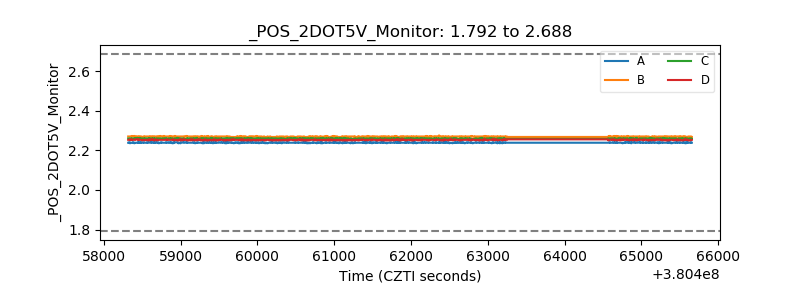 |
| +5 Volts monitor |  |
| _ROLL_ROT | 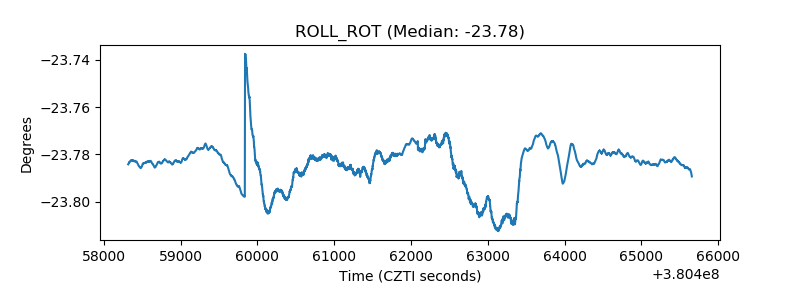 |
| _Roll_DEC | 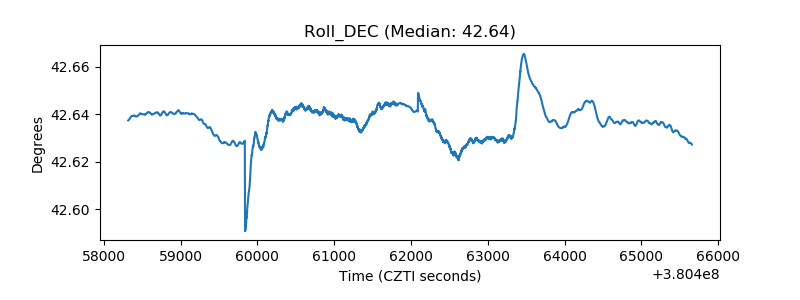 |
| _Roll_RA |  |
| Veto Counter | 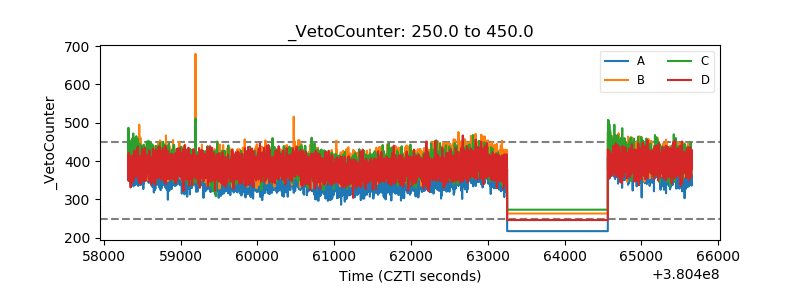 |