| Param | Original file | Final file |
|---|---|---|
| Filename | modeM0/AS1A11_054T07_9000004878_34156cztM0_level2.evt | modeM0/AS1A11_054T07_9000004878_34156cztM0_level2_quad_clean.evt |
| Size (bytes) | 500,708,160 | 74,007,360 |
| Size | 477.5 MB | 70.6 MB |
| Events in quadrant A | 2,881,846 | 456,009 |
| Events in quadrant B | 3,407,913 | 464,445 |
| Events in quadrant C | 3,700,773 | 451,409 |
| Events in quadrant D | 4,753,461 | 437,014 |
| Mode SS | |||
|---|---|---|---|
| Quadrant | BADHDUFLAG | Total packets | Discarded packets |
| A | 0 | 128 | 0 |
| B | 0 | 128 | 0 |
| C | 0 | 128 | 0 |
| D | 0 | 128 | 0 |
| Mode M0 | |||
|---|---|---|---|
| Quadrant | BADHDUFLAG | Total packets | Discarded packets |
| A | 0 | 12567 | 3 |
| B | 0 | 14132 | 2 |
| C | 0 | 14876 | 2 |
| D | 0 | 18358 | 2 |
| Mode M9 | |||
|---|---|---|---|
| Quadrant | BADHDUFLAG | Total packets | Discarded packets |
| A | 0 | 30 | 0 |
| B | 0 | 30 | 0 |
| C | 0 | 30 | 0 |
| D | 0 | 30 | 0 |
| Quadrant | Total seconds | Saturated seconds | Saturation percentage |
|---|---|---|---|
| A | 6188 | 8 | 0.129282% |
| B | 6188 | 92 | 1.486749% |
| C | 6188 | 122 | 1.971558% |
| D | 6188 | 499 | 8.063995% |
Noise dominated data is calculated using 1-second bins in cleaned event files. If a bin has >2000 counts, and if more than 50% of those come from <1% of pixels, then it is considered to be noise-dominated and hence unusable.
| Quadrant | # 1 sec bins | Bins with >0 counts | Bins with >2000 counts | High rate bins dominated by noise | Noise dominated (total time) | Noise dominated (detector-on time) | Marked lightcurve |
|---|---|---|---|---|---|---|---|
| A | 9230 | 6190 | 0 | 0 | 0.00% | 0.00% | 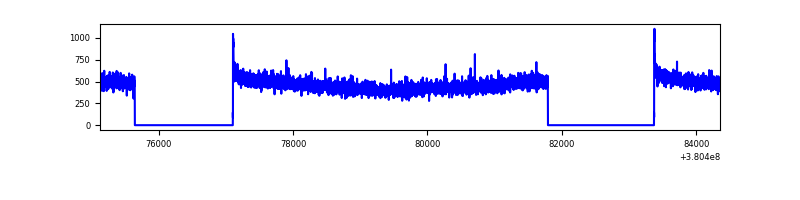 |
| B | 9230 | 6190 | 56 | 56 | 0.61% | 0.90% | 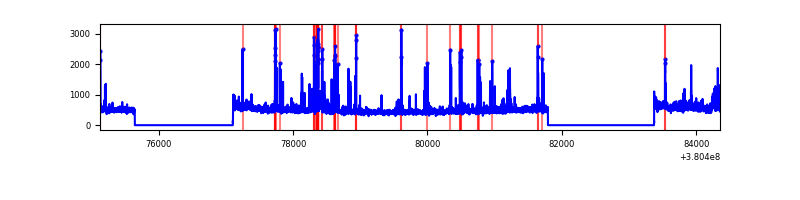 |
| C | 9230 | 6190 | 84 | 84 | 0.91% | 1.36% | 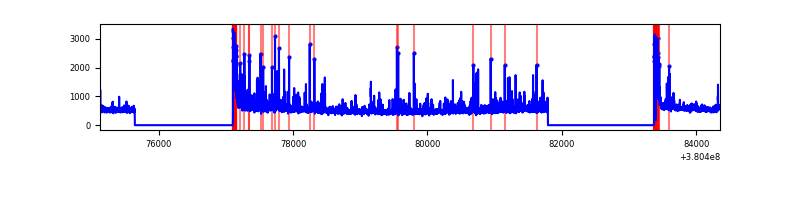 |
| D | 9230 | 6190 | 391 | 391 | 4.24% | 6.32% | 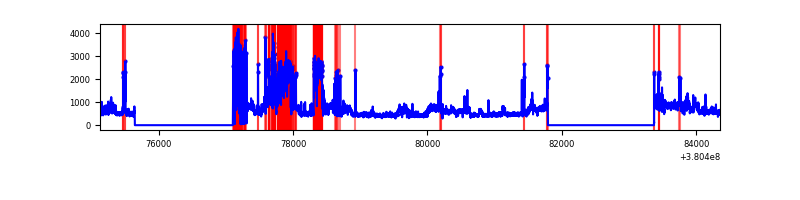 |
Top three noisy pixels from each quadrant. If the there are fewer than three noisy pixels in the level2.evt file, extra rows are filled as -1
| Pixel properties | Quadrant properties | ||||||
|---|---|---|---|---|---|---|---|
| Quadrant | DetID | PixID | Counts | Sigma | Mean | Median | Sigma |
| A | 10 | 83 | 22535 | 145.31 | 737 | 723 | 150.1 |
| A | 13 | 254 | 10749 | 66.79 | 737 | 723 | 150.1 |
| A | 13 | 6 | 10451 | 64.81 | 737 | 723 | 150.1 |
| B | 5 | 255 | 244296 | 1718.76 | 733 | 714 | 141.7 |
| B | 5 | 172 | 83391 | 583.39 | 733 | 714 | 141.7 |
| B | 0 | 219 | 51245 | 356.56 | 733 | 714 | 141.7 |
| C | 0 | 10 | 598844 | 3593.61 | 710 | 714 | 166.4 |
| C | 15 | 214 | 263264 | 1577.42 | 710 | 714 | 166.4 |
| C | 14 | 67 | 32029 | 188.14 | 710 | 714 | 166.4 |
| D | 8 | 195 | 795523 | 4730.82 | 687 | 668 | 168.0 |
| D | 8 | 230 | 563440 | 3349.51 | 687 | 668 | 168.0 |
| D | 5 | 223 | 365831 | 2173.38 | 687 | 668 | 168.0 |
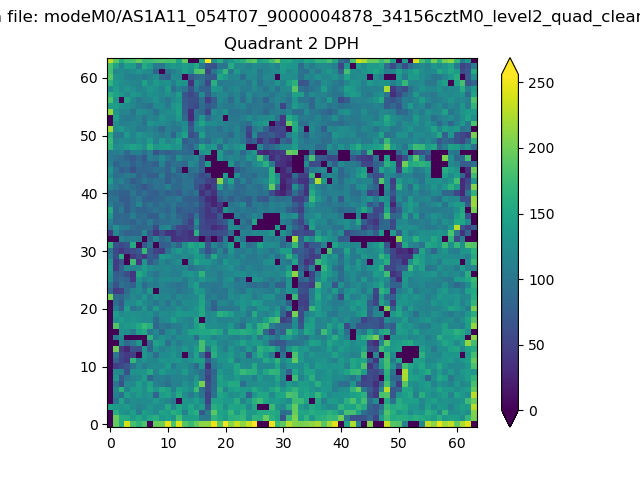
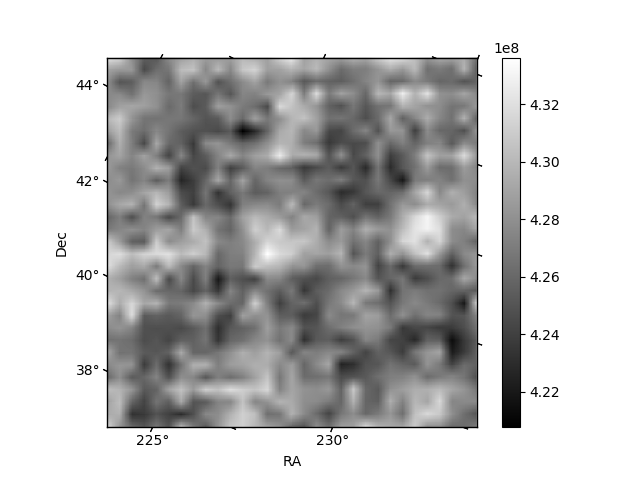
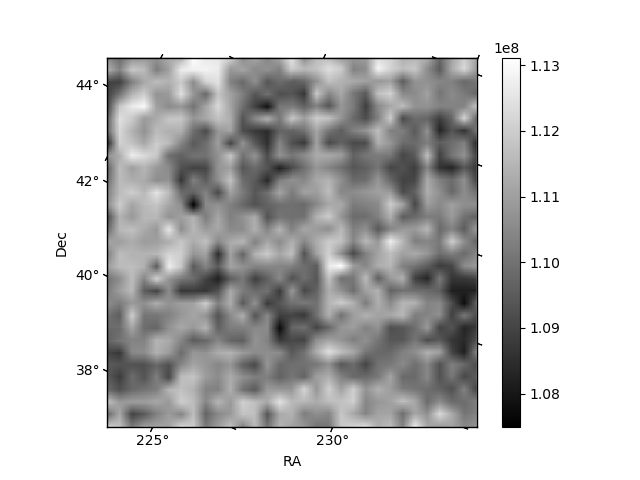
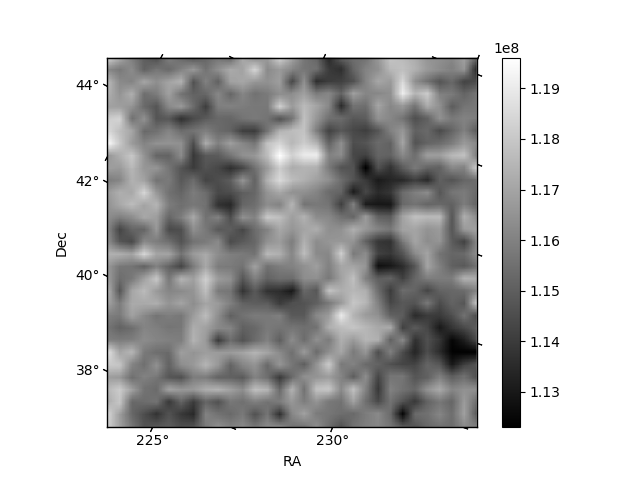
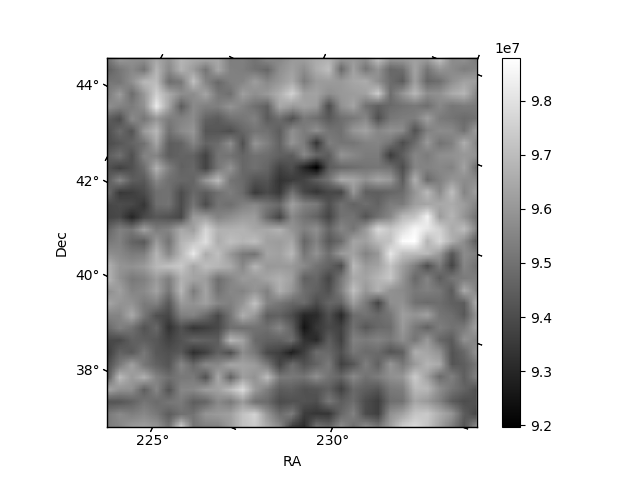
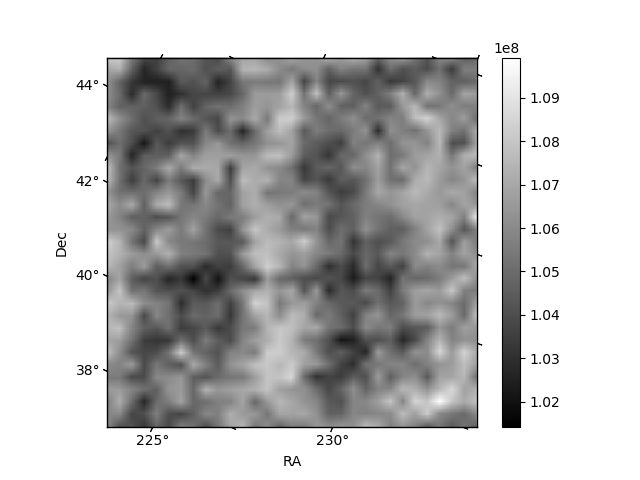
Histogram calculated using DETX and DETY for each event in the final _common_clean file
| Quadrant A | 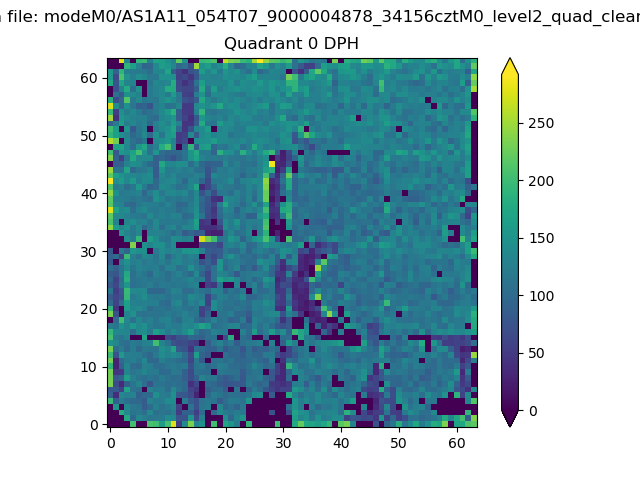 |
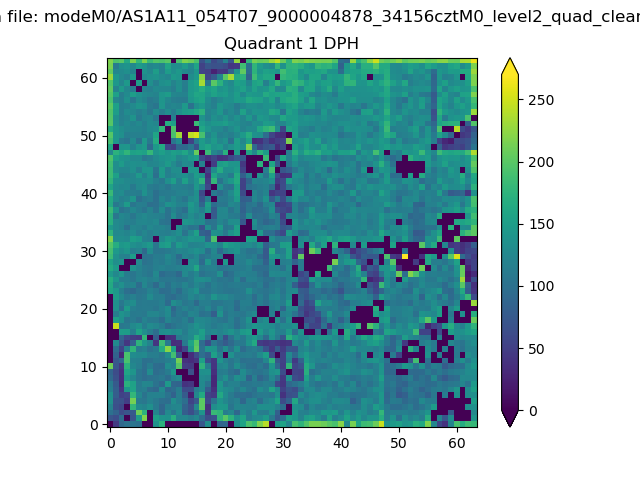 |
Quadrant B |
|---|---|---|---|
| Quadrant D | 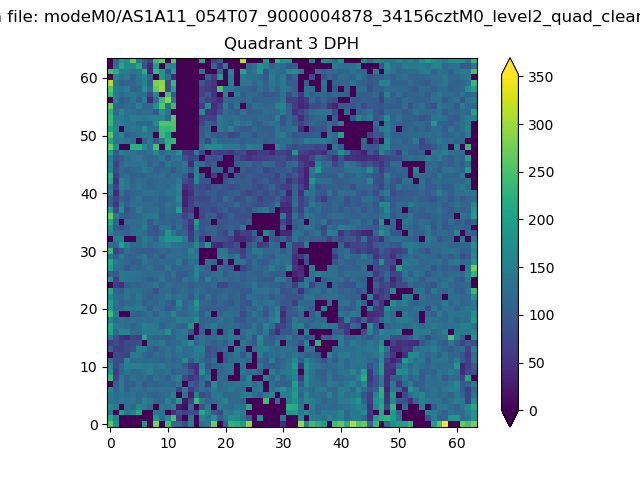 |
 |
Quadrant C |
| Plot type | Count rate plots | Images |
|---|---|---|
| Comparison with Poisson distribution Blue bars denote a histogram of data divided into 1 sec bins. Red curve is a Poisson curve with rate = median count rate of data. |
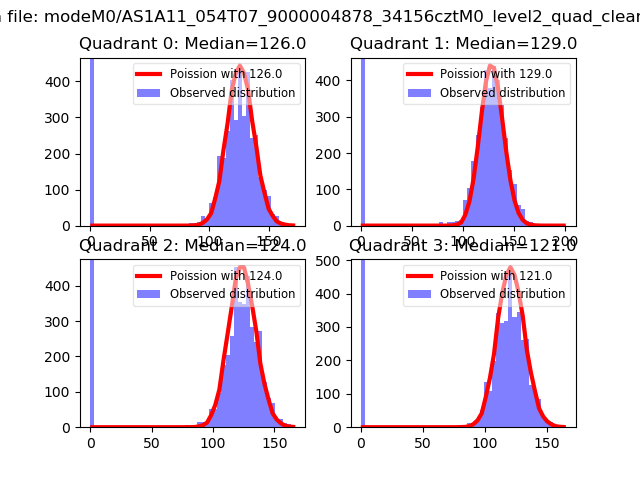 |
 |
| Quadrant-wise count rates Data is divided into 100 sec bins |
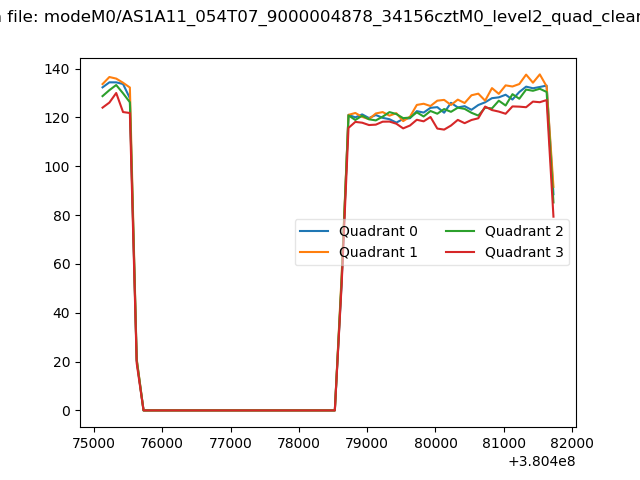 |
|
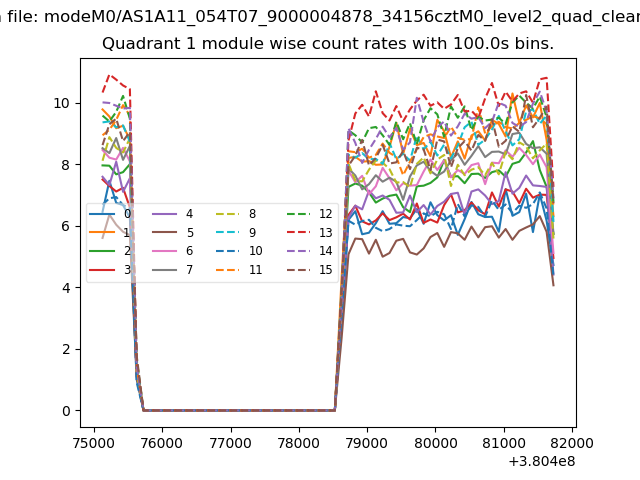
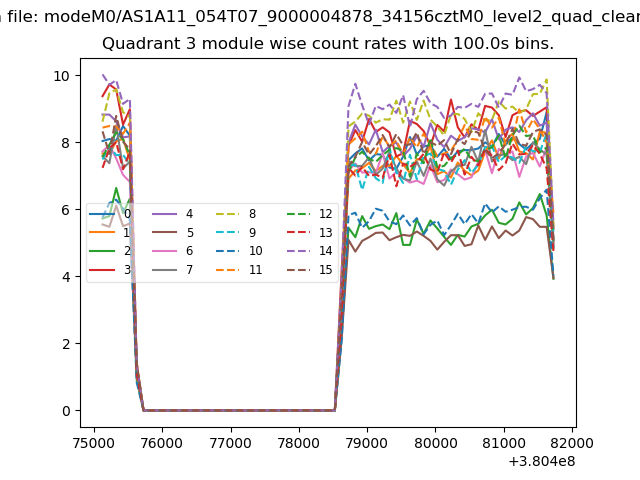
| Module-wise count rates for Quadrant A Data is divided into 100 sec bins |
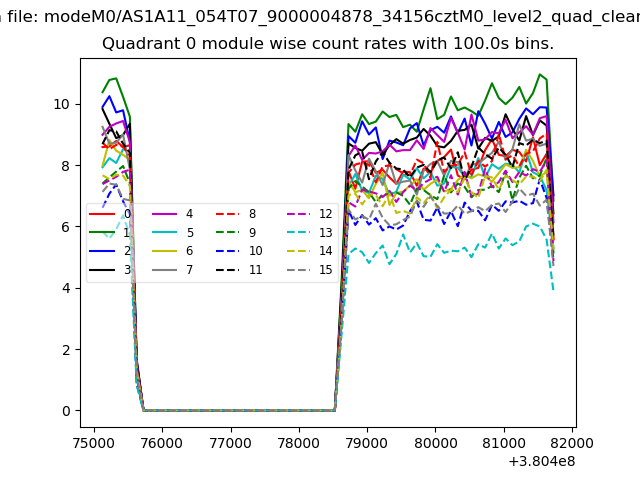 |
 |
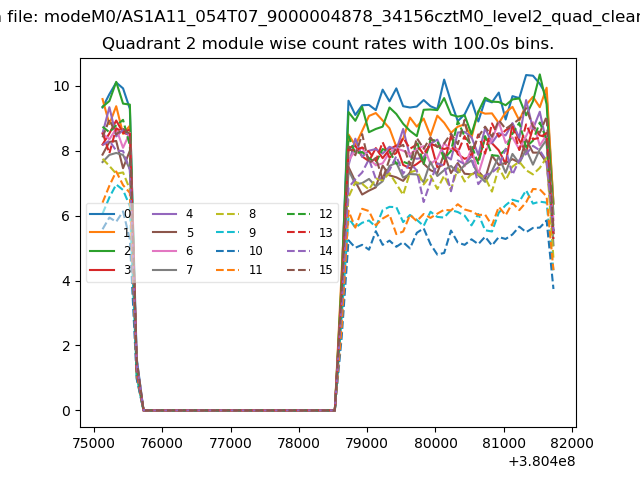
| Module-wise count rates for Quadrant B Data is divided into 100 sec bins |
 |
 |
| Module-wise count rates for Quadrant C Data is divided into 100 sec bins |
 |
 |
| Module-wise count rates for Quadrant D Data is divided into 100 sec bins |
 |
 |
| Parameter | Plot |
|---|---|
| CZT HV Monitor | 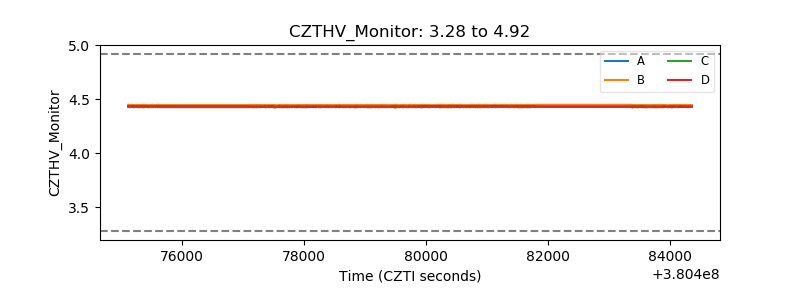 |
| D_VDD | 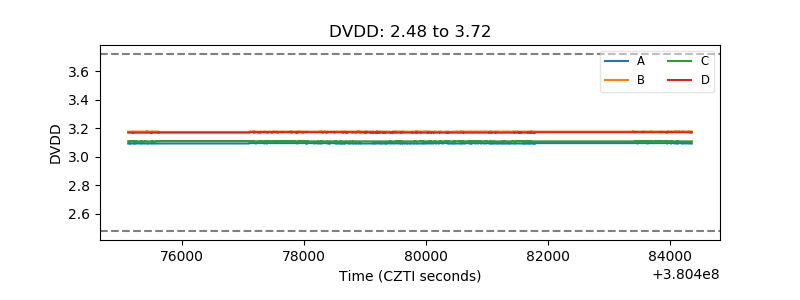 |
| Temperature 1 | 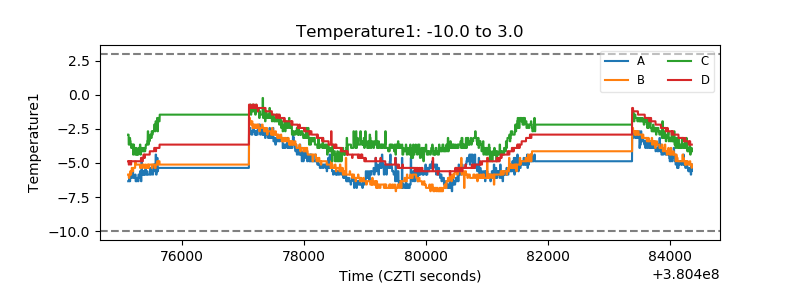 |
| Veto HV Monitor | 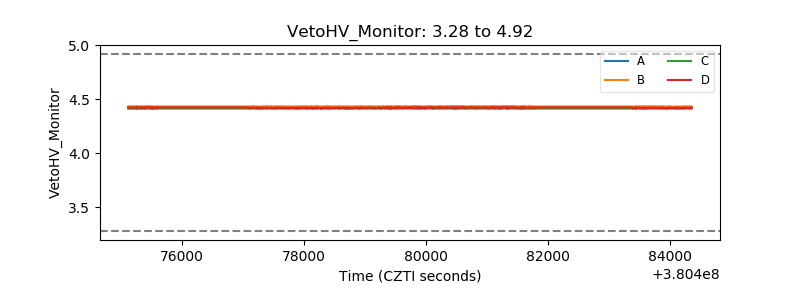 |
| Veto LLD | 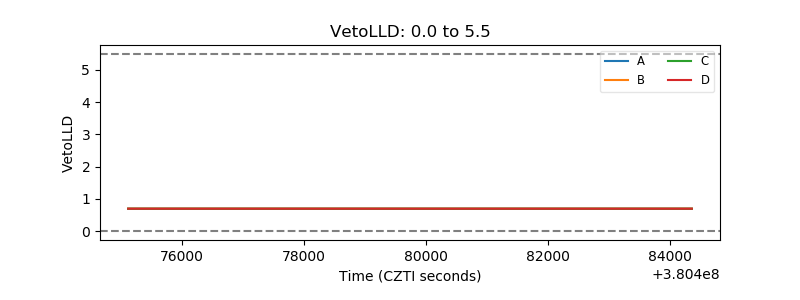 |
| Alpha Counter | 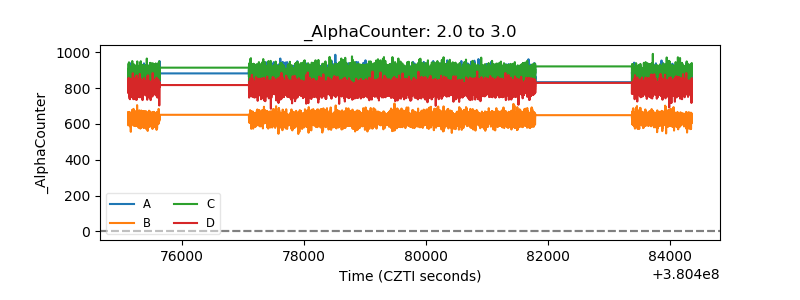 |
| _CPM_Rate | 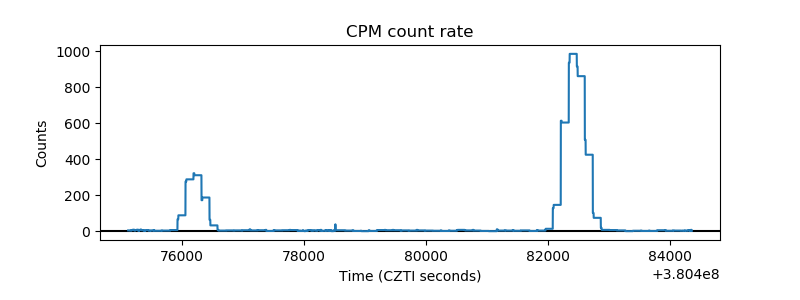 |
| CZT Counter | 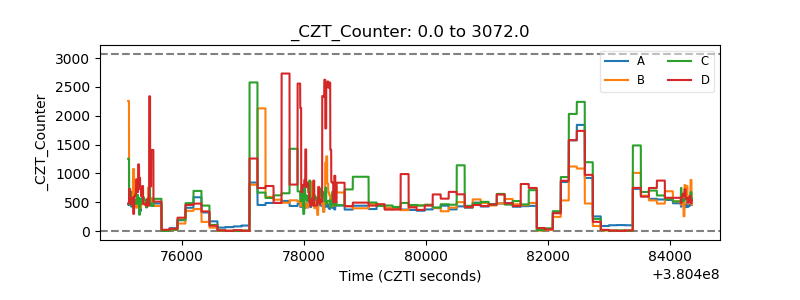 |
| +2.5 Volts monitor | 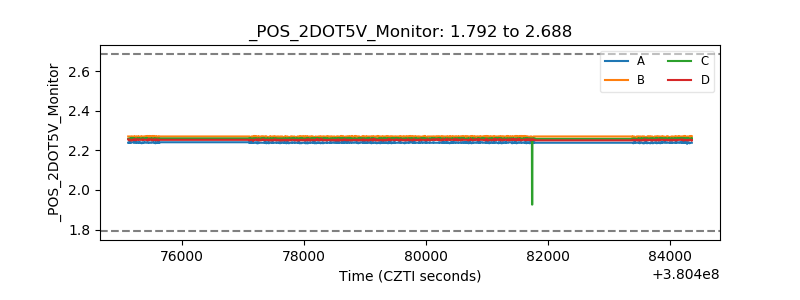 |
| +5 Volts monitor | 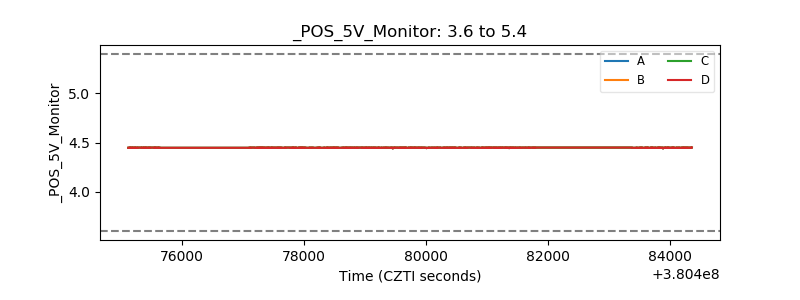 |
| _ROLL_ROT | 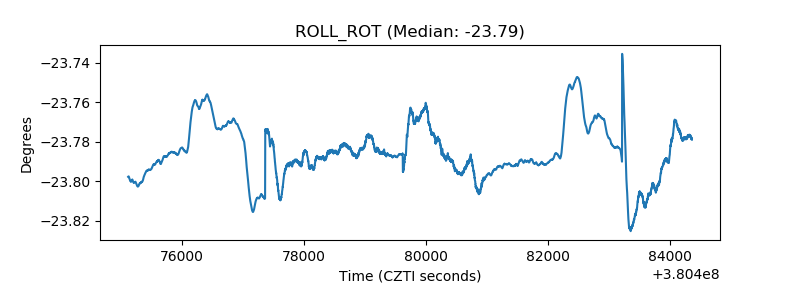 |
| _Roll_DEC | 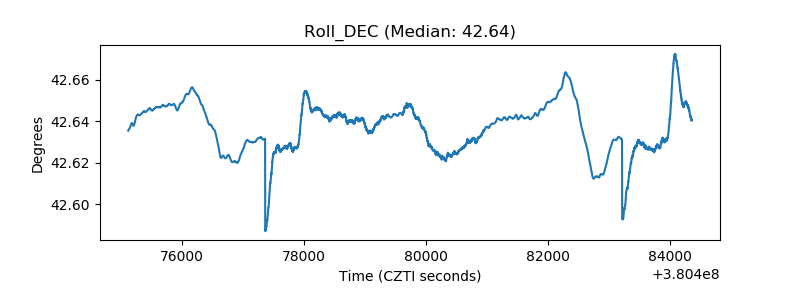 |
| _Roll_RA | 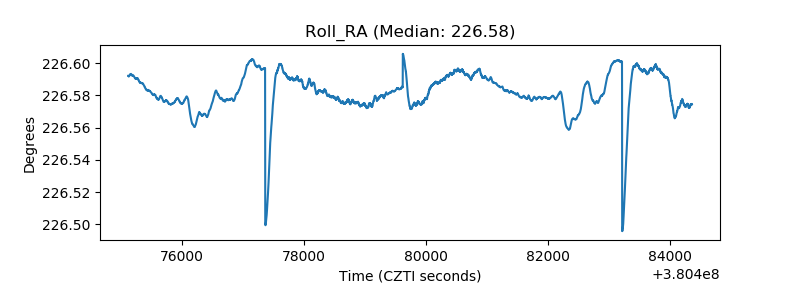 |
| Veto Counter | 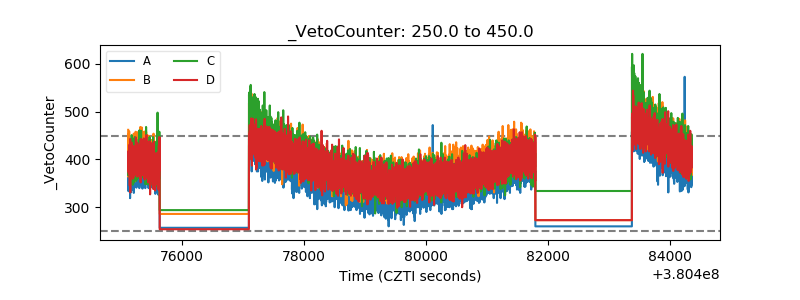 |