| Param | Original file | Final file |
|---|---|---|
| Filename | modeM0/AS1A11_054T07_9000004878_34157cztM0_level2.evt | modeM0/AS1A11_054T07_9000004878_34157cztM0_level2_quad_clean.evt |
| Size (bytes) | 439,810,560 | 70,822,080 |
| Size | 419.4 MB | 67.5 MB |
| Events in quadrant A | 2,526,688 | 444,565 |
| Events in quadrant B | 3,580,641 | 449,965 |
| Events in quadrant C | 3,205,288 | 446,051 |
| Events in quadrant D | 3,639,624 | 425,264 |
| Mode SS | |||
|---|---|---|---|
| Quadrant | BADHDUFLAG | Total packets | Discarded packets |
| A | 0 | 110 | 0 |
| B | 0 | 110 | 0 |
| C | 0 | 110 | 0 |
| D | 0 | 110 | 0 |
| Mode M0 | |||
|---|---|---|---|
| Quadrant | BADHDUFLAG | Total packets | Discarded packets |
| A | 0 | 11095 | 3 |
| B | 0 | 14246 | 2 |
| C | 0 | 12916 | 2 |
| D | 0 | 14467 | 2 |
| Mode M9 | |||
|---|---|---|---|
| Quadrant | BADHDUFLAG | Total packets | Discarded packets |
| A | 0 | 25 | 0 |
| B | 0 | 25 | 0 |
| C | 0 | 25 | 0 |
| D | 0 | 26 | 0 |
| Quadrant | Total seconds | Saturated seconds | Saturation percentage |
|---|---|---|---|
| A | 5410 | 7 | 0.129390% |
| B | 5410 | 235 | 4.343808% |
| C | 5410 | 130 | 2.402957% |
| D | 5410 | 100 | 1.848429% |
Noise dominated data is calculated using 1-second bins in cleaned event files. If a bin has >2000 counts, and if more than 50% of those come from <1% of pixels, then it is considered to be noise-dominated and hence unusable.
| Quadrant | # 1 sec bins | Bins with >0 counts | Bins with >2000 counts | High rate bins dominated by noise | Noise dominated (total time) | Noise dominated (detector-on time) | Marked lightcurve |
|---|---|---|---|---|---|---|---|
| A | 7112 | 5411 | 0 | 0 | 0.00% | 0.00% | 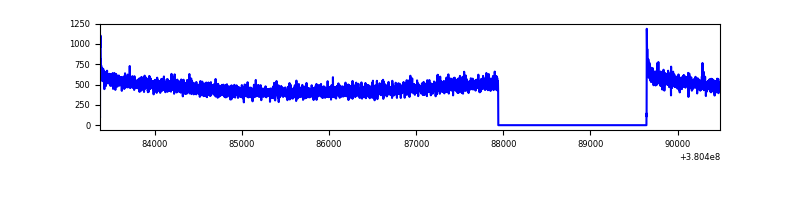 |
| B | 7112 | 5411 | 148 | 148 | 2.08% | 2.74% | 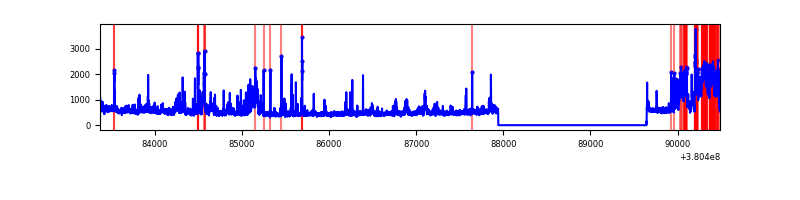 |
| C | 7112 | 5411 | 67 | 67 | 0.94% | 1.24% | 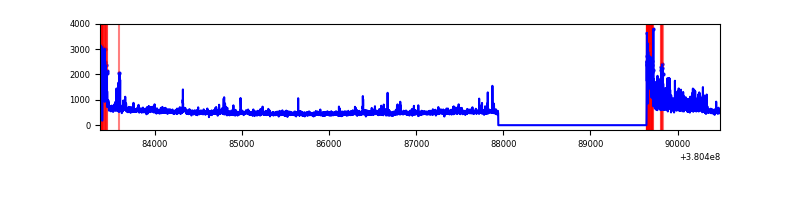 |
| D | 7112 | 5411 | 70 | 70 | 0.98% | 1.29% | 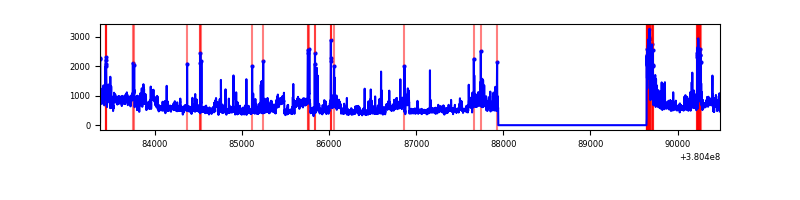 |
Top three noisy pixels from each quadrant. If the there are fewer than three noisy pixels in the level2.evt file, extra rows are filled as -1
| Pixel properties | Quadrant properties | ||||||
|---|---|---|---|---|---|---|---|
| Quadrant | DetID | PixID | Counts | Sigma | Mean | Median | Sigma |
| A | 10 | 83 | 22107 | 165.22 | 644 | 631 | 130.0 |
| A | 13 | 6 | 9770 | 70.31 | 644 | 631 | 130.0 |
| A | 13 | 254 | 9598 | 68.99 | 644 | 631 | 130.0 |
| B | 5 | 31 | 448655 | 3618.94 | 638 | 622 | 123.8 |
| B | 5 | 15 | 215599 | 1736.46 | 638 | 622 | 123.8 |
| B | 5 | 255 | 189255 | 1523.66 | 638 | 622 | 123.8 |
| C | 0 | 10 | 467934 | 3223.49 | 623 | 630 | 145.0 |
| C | 15 | 214 | 231391 | 1591.8 | 623 | 630 | 145.0 |
| C | 9 | 187 | 38872 | 263.8 | 623 | 630 | 145.0 |
| D | 8 | 195 | 666666 | 4327.36 | 625 | 607 | 153.9 |
| D | 2 | 249 | 91886 | 593.04 | 625 | 607 | 153.9 |
| D | 13 | 249 | 89594 | 578.14 | 625 | 607 | 153.9 |
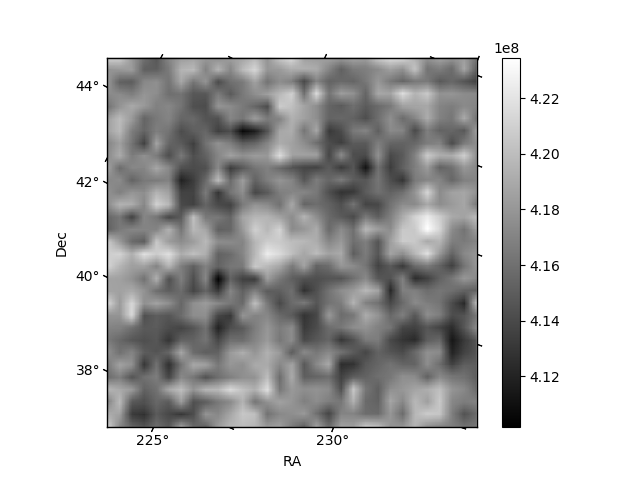
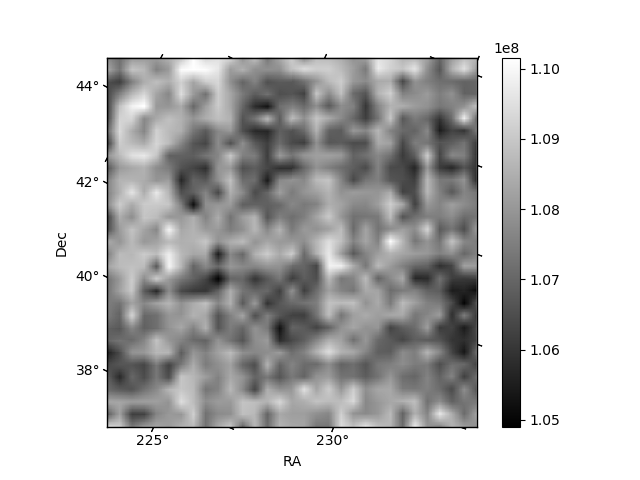
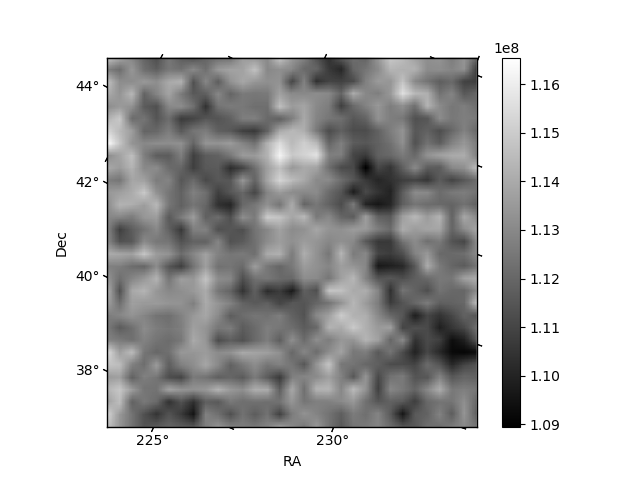
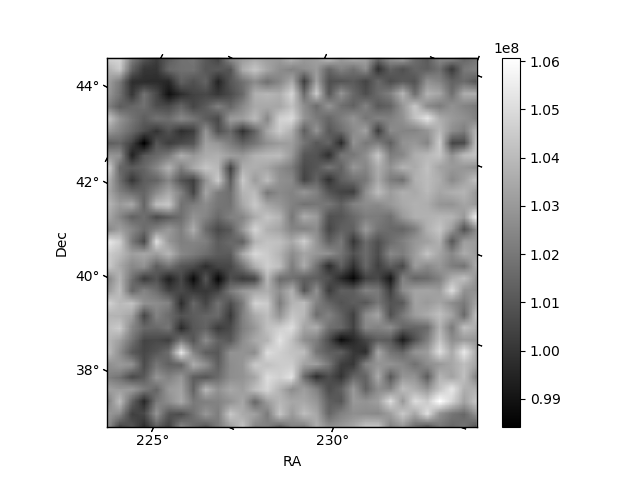
Histogram calculated using DETX and DETY for each event in the final _common_clean file
| Quadrant A | 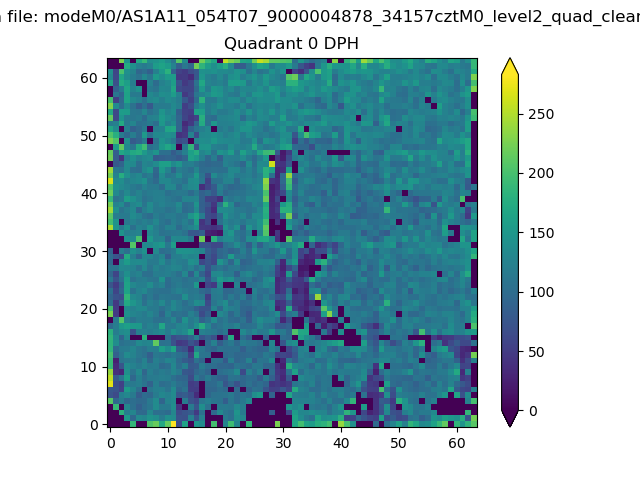 |
 |
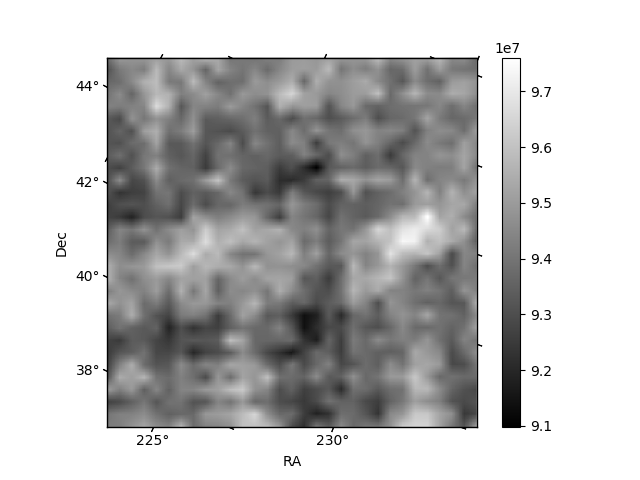
Quadrant B |
|---|---|---|---|
| Quadrant D | 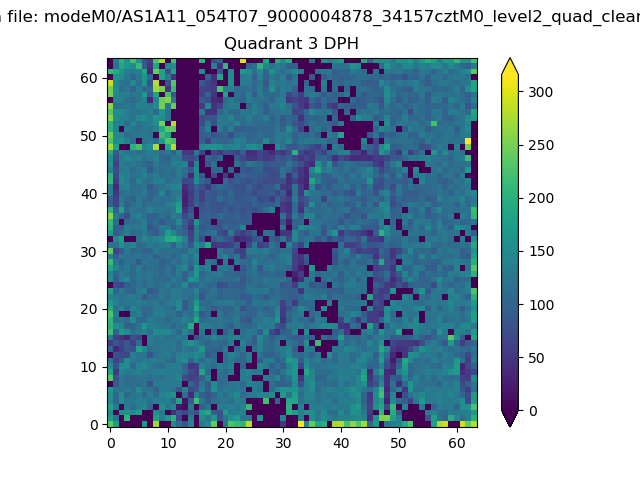 |
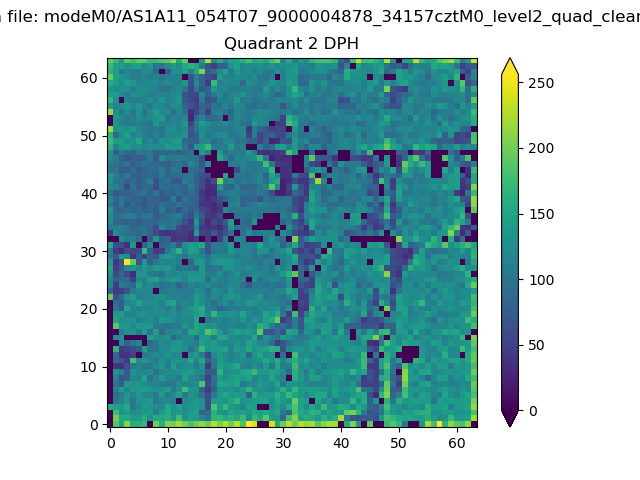 |
Quadrant C |
| Plot type | Count rate plots | Images |
|---|---|---|
| Comparison with Poisson distribution Blue bars denote a histogram of data divided into 1 sec bins. Red curve is a Poisson curve with rate = median count rate of data. |
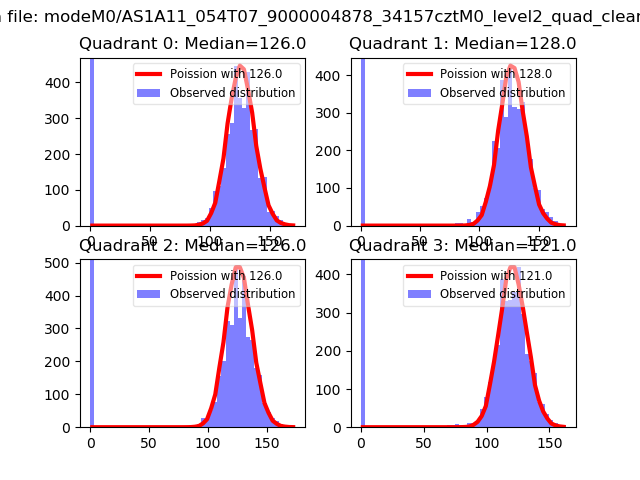 |
 |
| Quadrant-wise count rates Data is divided into 100 sec bins |
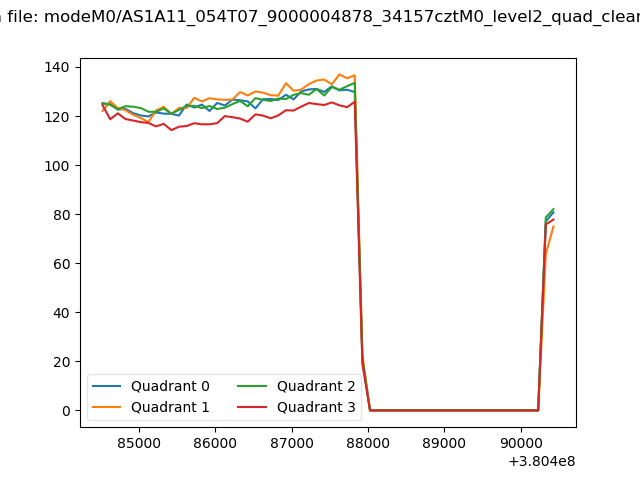 |
|
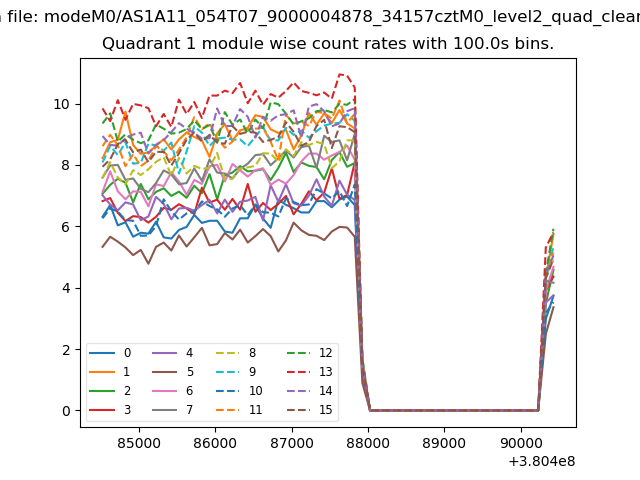
| Module-wise count rates for Quadrant A Data is divided into 100 sec bins |
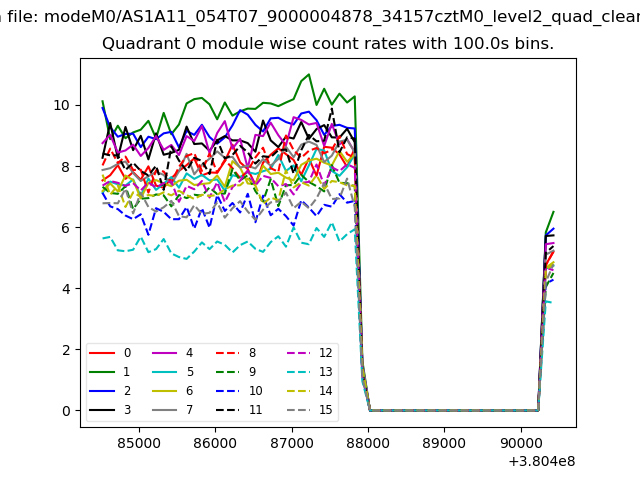 |
 |
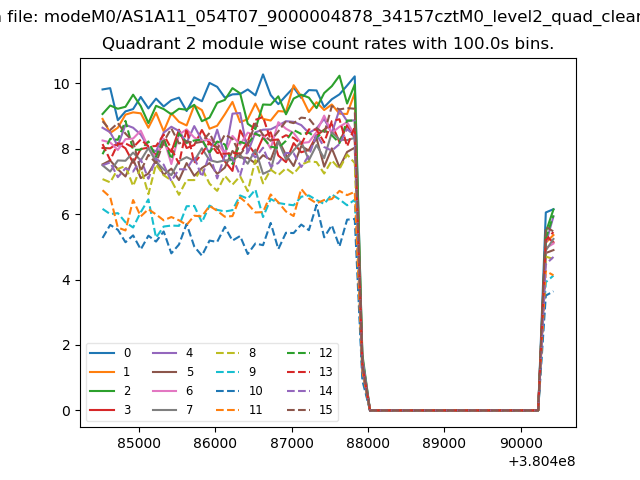
| Module-wise count rates for Quadrant B Data is divided into 100 sec bins |
 |
 |
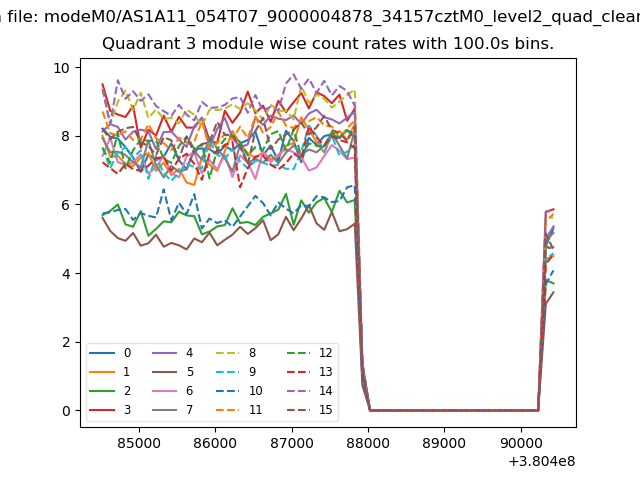
| Module-wise count rates for Quadrant C Data is divided into 100 sec bins |
 |
 |
| Module-wise count rates for Quadrant D Data is divided into 100 sec bins |
 |
 |
| Parameter | Plot |
|---|---|
| CZT HV Monitor | 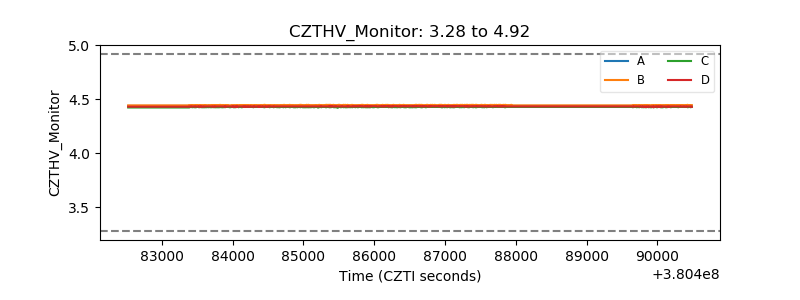 |
| D_VDD | 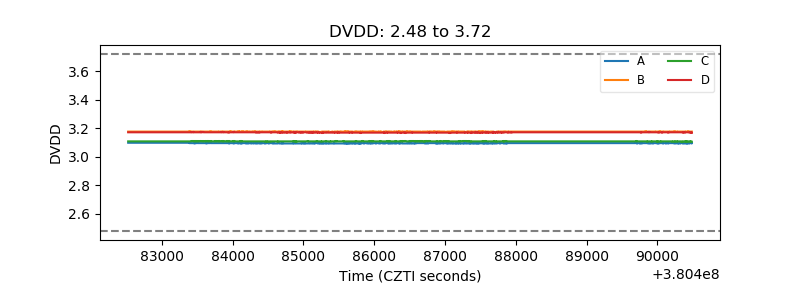 |
| Temperature 1 | 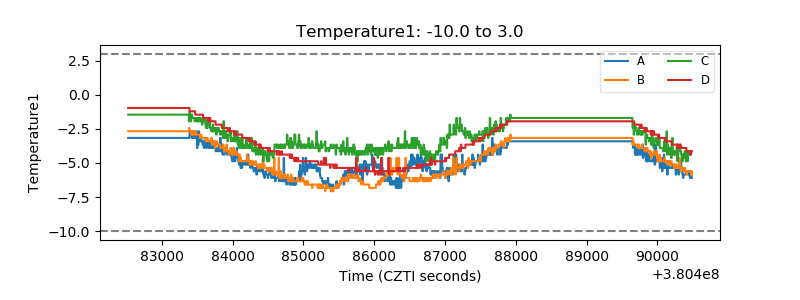 |
| Veto HV Monitor | 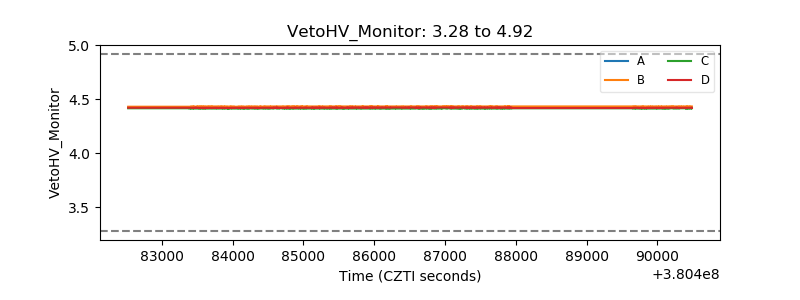 |
| Veto LLD | 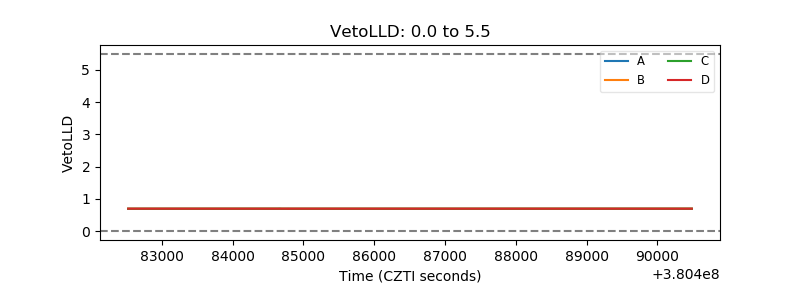 |
| Alpha Counter | 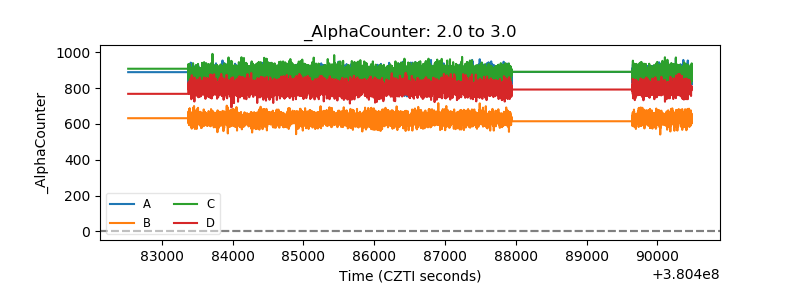 |
| _CPM_Rate | 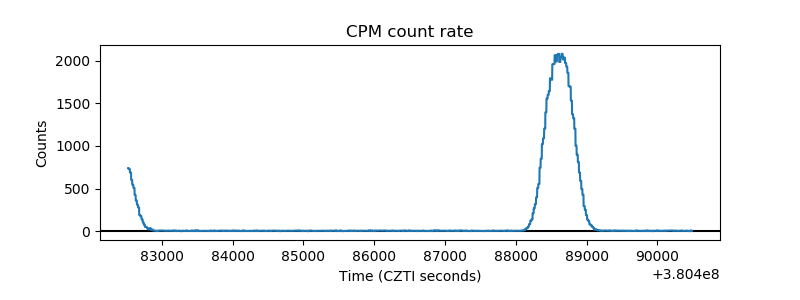 |
| CZT Counter | 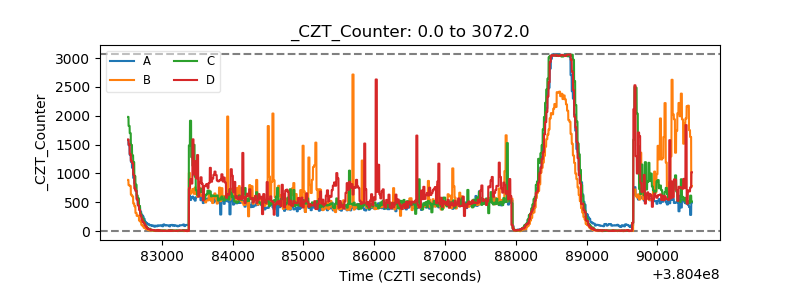 |
| +2.5 Volts monitor |  |
| +5 Volts monitor |  |
| _ROLL_ROT | 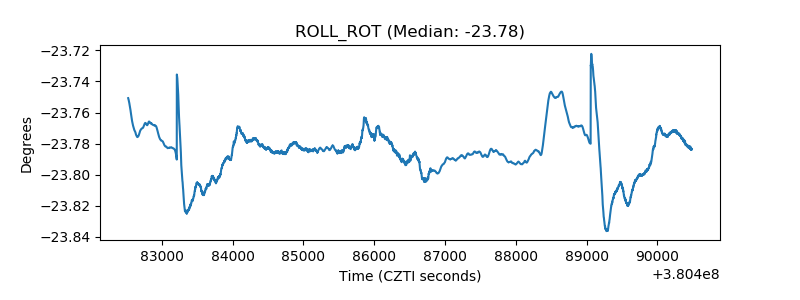 |
| _Roll_DEC | 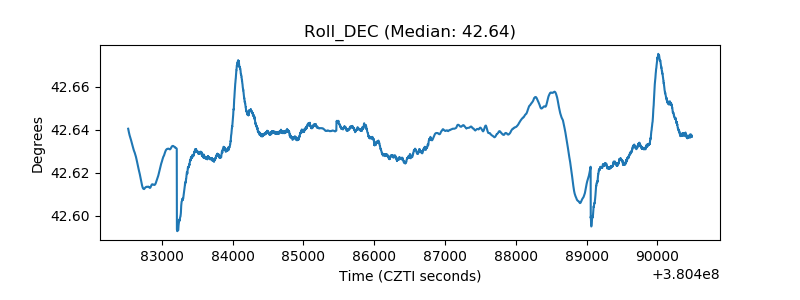 |
| _Roll_RA | 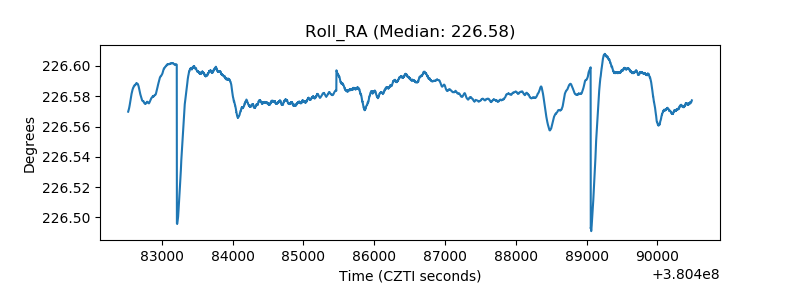 |
| Veto Counter | 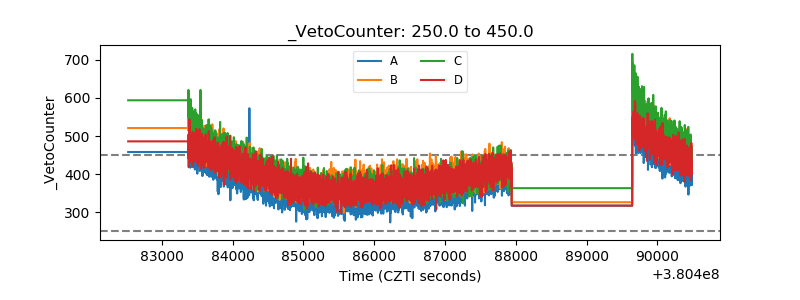 |