| Param | Original file | Final file |
|---|---|---|
| Filename | modeM0/AS1A11_054T07_9000004878_34159cztM0_level2.evt | modeM0/AS1A11_054T07_9000004878_34159cztM0_level2_quad_clean.evt |
| Size (bytes) | 469,290,240 | 85,167,360 |
| Size | 447.6 MB | 81.2 MB |
| Events in quadrant A | 2,481,547 | 558,426 |
| Events in quadrant B | 3,902,962 | 564,207 |
| Events in quadrant C | 3,298,135 | 562,868 |
| Events in quadrant D | 4,173,096 | 525,346 |
| Mode SS | |||
|---|---|---|---|
| Quadrant | BADHDUFLAG | Total packets | Discarded packets |
| A | 0 | 108 | 0 |
| B | 0 | 108 | 0 |
| C | 0 | 108 | 0 |
| D | 0 | 108 | 0 |
| Mode M0 | |||
|---|---|---|---|
| Quadrant | BADHDUFLAG | Total packets | Discarded packets |
| A | 0 | 10810 | 3 |
| B | 0 | 15062 | 2 |
| C | 0 | 13086 | 2 |
| D | 0 | 16234 | 2 |
| Mode M9 | |||
|---|---|---|---|
| Quadrant | BADHDUFLAG | Total packets | Discarded packets |
| A | 0 | 35 | 0 |
| B | 0 | 35 | 0 |
| C | 0 | 35 | 0 |
| D | 0 | 35 | 0 |
| Quadrant | Total seconds | Saturated seconds | Saturation percentage |
|---|---|---|---|
| A | 5263 | 5 | 0.095003% |
| B | 5263 | 333 | 6.327190% |
| C | 5263 | 184 | 3.496105% |
| D | 5263 | 140 | 2.660080% |
Noise dominated data is calculated using 1-second bins in cleaned event files. If a bin has >2000 counts, and if more than 50% of those come from <1% of pixels, then it is considered to be noise-dominated and hence unusable.
| Quadrant | # 1 sec bins | Bins with >0 counts | Bins with >2000 counts | High rate bins dominated by noise | Noise dominated (total time) | Noise dominated (detector-on time) | Marked lightcurve |
|---|---|---|---|---|---|---|---|
| A | 8787 | 5265 | 0 | 0 | 0.00% | 0.00% | 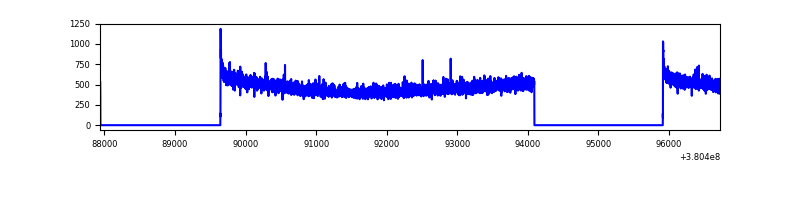 |
| B | 8787 | 5265 | 221 | 221 | 2.52% | 4.20% | 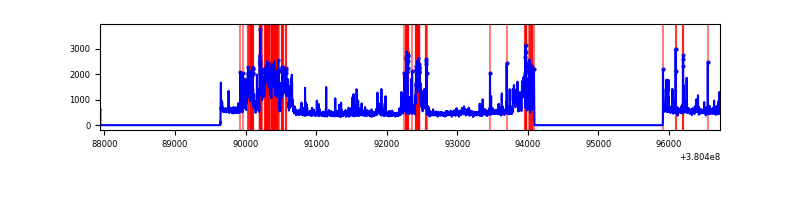 |
| C | 8787 | 5265 | 112 | 112 | 1.27% | 2.13% | 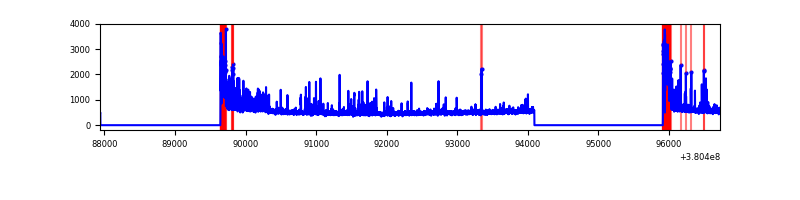 |
| D | 8787 | 5265 | 89 | 89 | 1.01% | 1.69% | 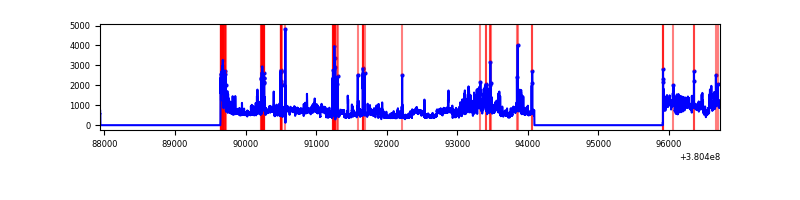 |
Top three noisy pixels from each quadrant. If the there are fewer than three noisy pixels in the level2.evt file, extra rows are filled as -1
| Pixel properties | Quadrant properties | ||||||
|---|---|---|---|---|---|---|---|
| Quadrant | DetID | PixID | Counts | Sigma | Mean | Median | Sigma |
| A | 10 | 83 | 21384 | 164.11 | 634 | 622 | 126.5 |
| A | 13 | 254 | 10124 | 75.11 | 634 | 622 | 126.5 |
| A | 13 | 6 | 8981 | 66.07 | 634 | 622 | 126.5 |
| B | 5 | 31 | 621061 | 5142.63 | 627 | 611 | 120.6 |
| B | 5 | 15 | 334145 | 2764.52 | 627 | 611 | 120.6 |
| B | 5 | 255 | 202840 | 1676.19 | 627 | 611 | 120.6 |
| C | 0 | 10 | 630929 | 4415.93 | 613 | 619 | 142.7 |
| C | 15 | 214 | 220345 | 1539.39 | 613 | 619 | 142.7 |
| C | 9 | 187 | 34225 | 235.44 | 613 | 619 | 142.7 |
| D | 8 | 195 | 996999 | 6646.7 | 612 | 595 | 149.9 |
| D | 8 | 230 | 236320 | 1572.45 | 612 | 595 | 149.9 |
| D | 10 | 118 | 124492 | 826.48 | 612 | 595 | 149.9 |
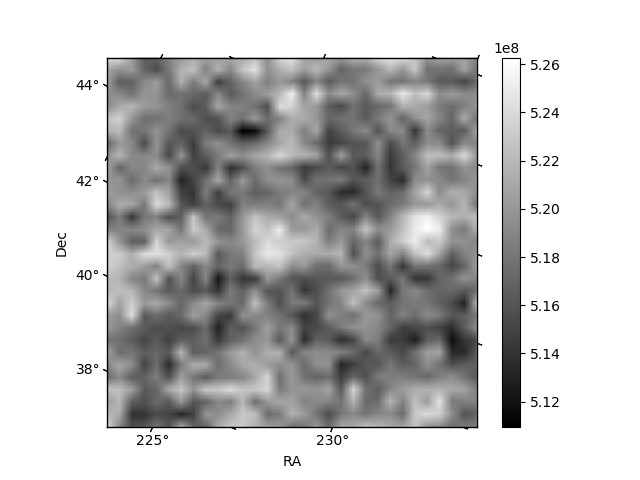
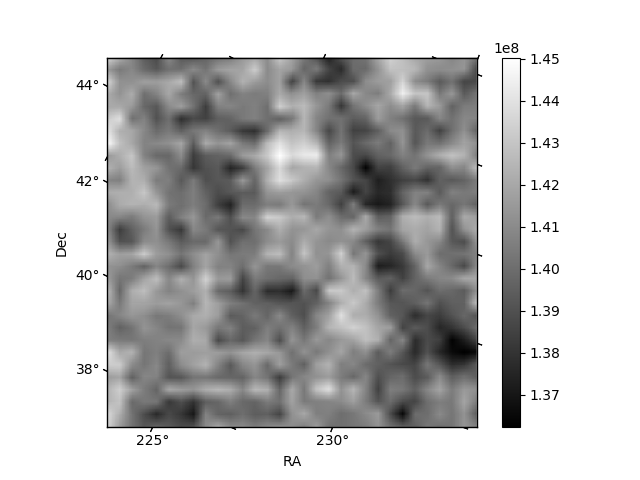
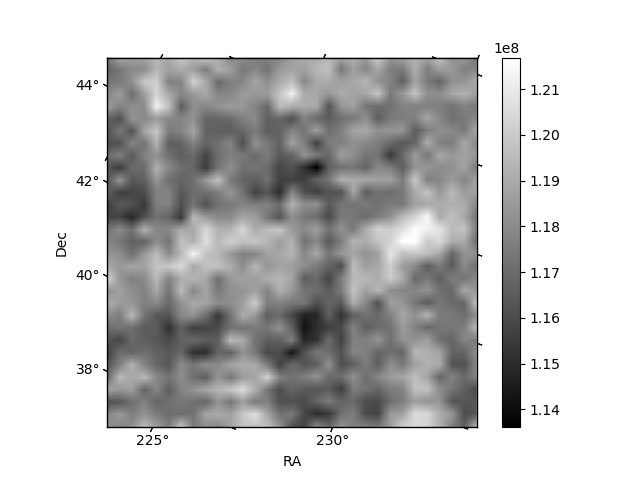
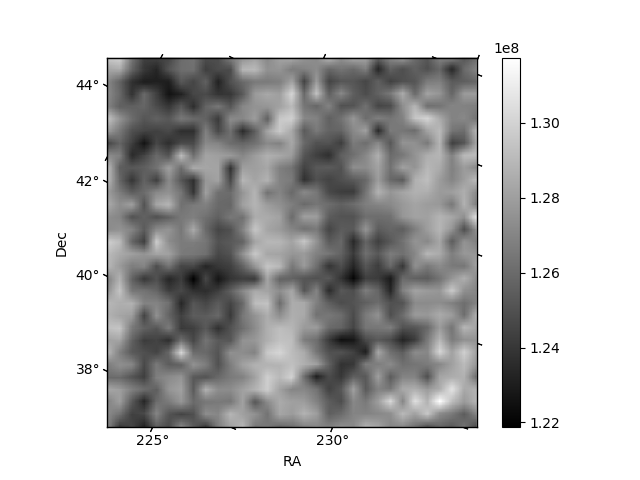
Histogram calculated using DETX and DETY for each event in the final _common_clean file
| Quadrant A | 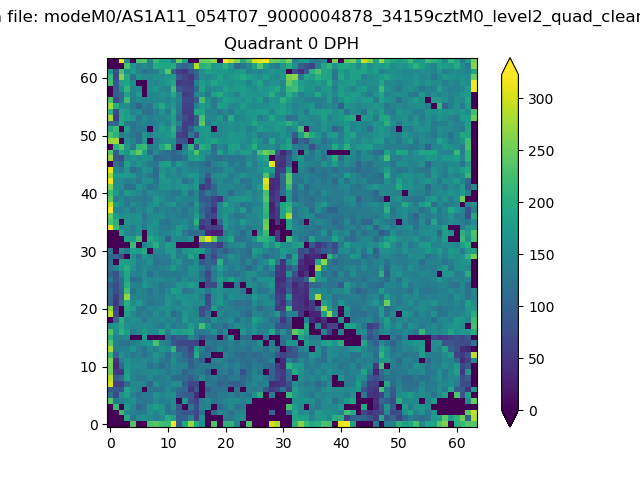 |
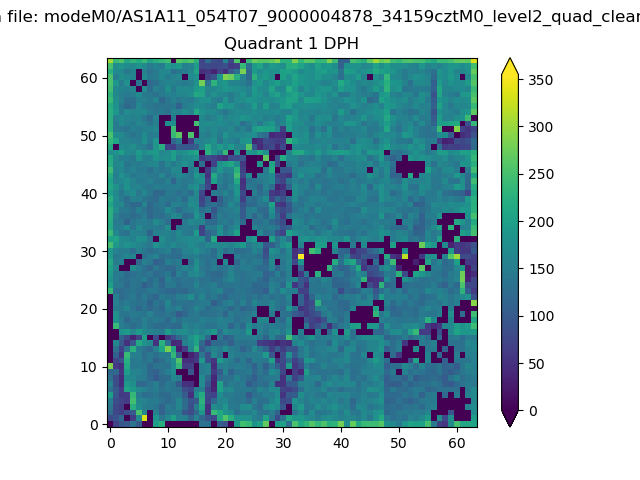 |
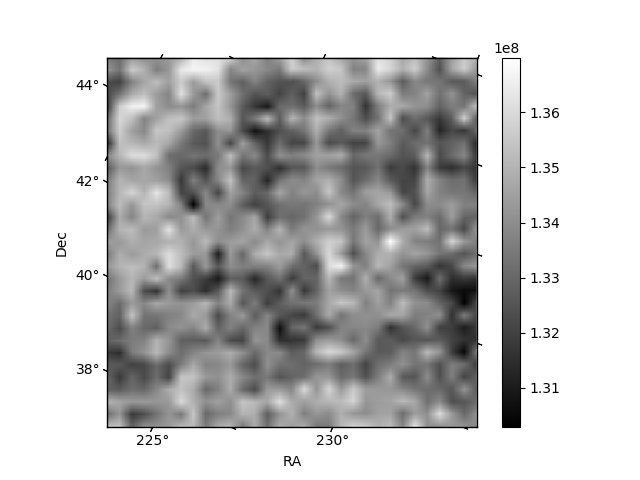
Quadrant B |
|---|---|---|---|
| Quadrant D | 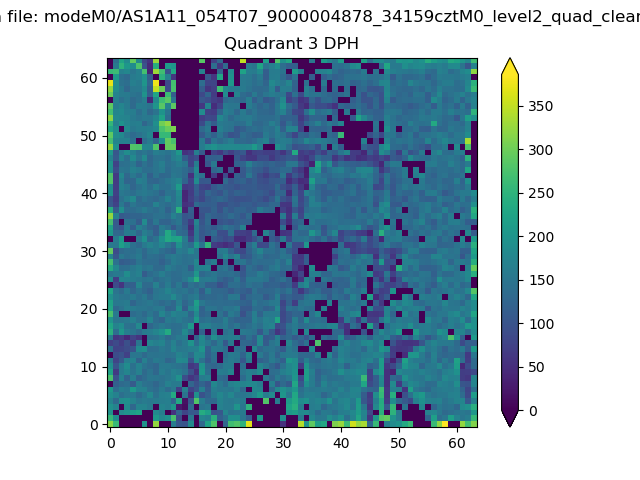 |
 |
Quadrant C |
| Plot type | Count rate plots | Images |
|---|---|---|
| Comparison with Poisson distribution Blue bars denote a histogram of data divided into 1 sec bins. Red curve is a Poisson curve with rate = median count rate of data. |
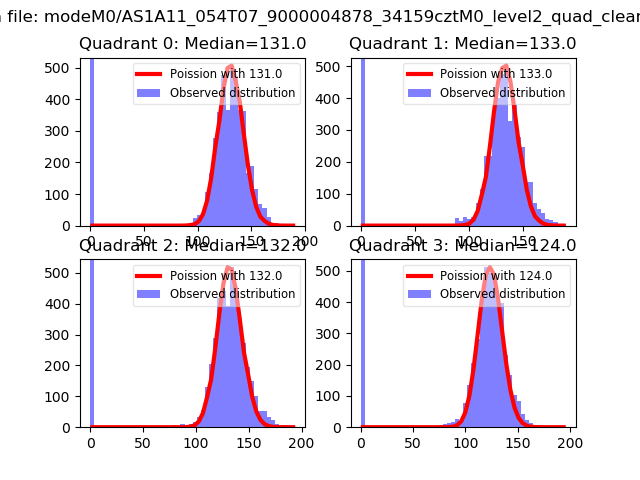 |
 |
| Quadrant-wise count rates Data is divided into 100 sec bins |
 |
|
| Module-wise count rates for Quadrant A Data is divided into 100 sec bins |
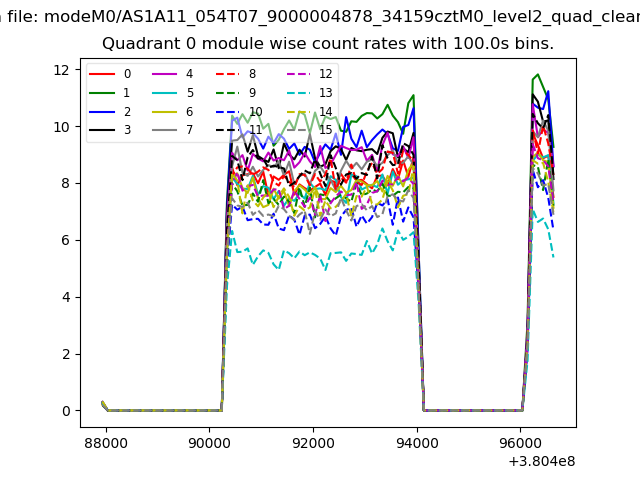 |
 |
| Module-wise count rates for Quadrant B Data is divided into 100 sec bins |
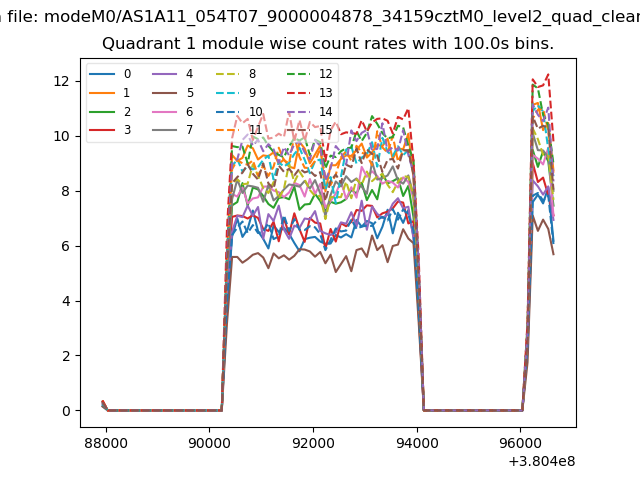 |
 |
| Module-wise count rates for Quadrant C Data is divided into 100 sec bins |
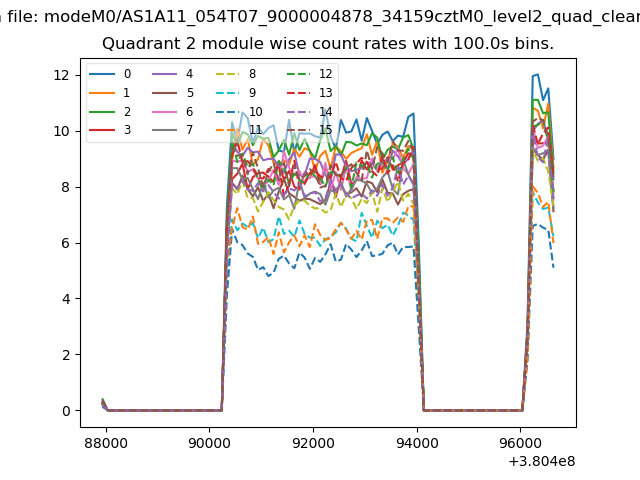 |
 |
| Module-wise count rates for Quadrant D Data is divided into 100 sec bins |
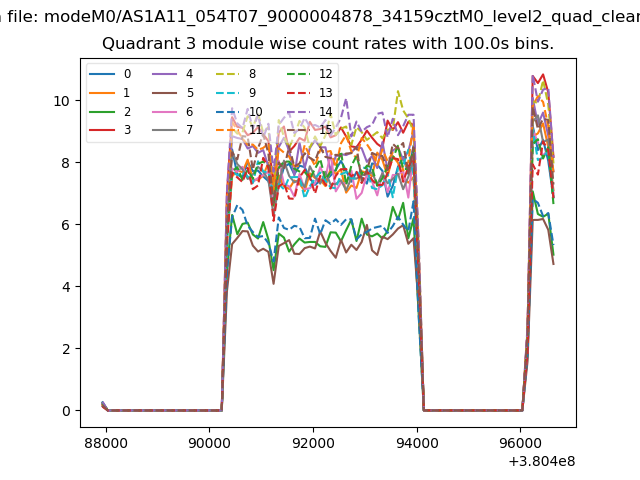 |
 |
| Parameter | Plot |
|---|---|
| CZT HV Monitor | 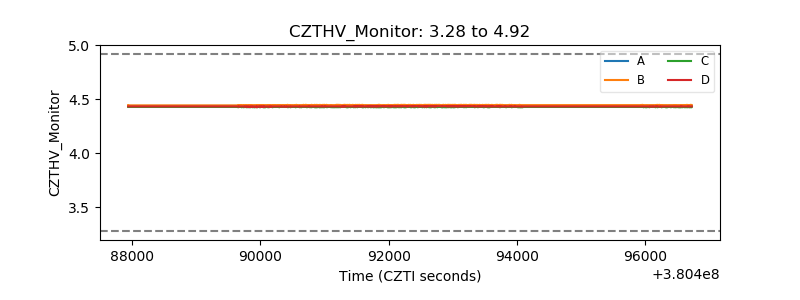 |
| D_VDD | 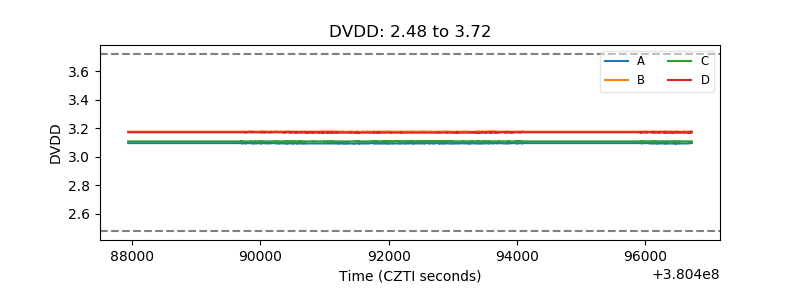 |
| Temperature 1 | 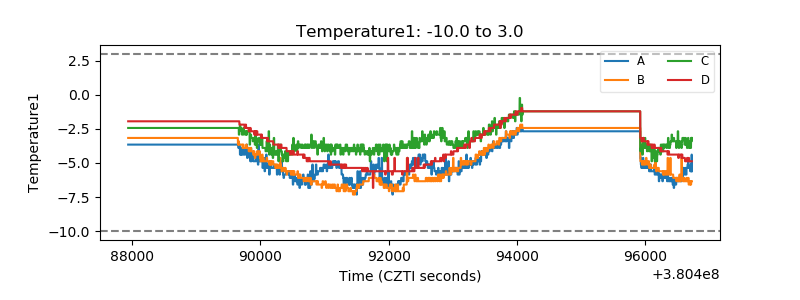 |
| Veto HV Monitor |  |
| Veto LLD | 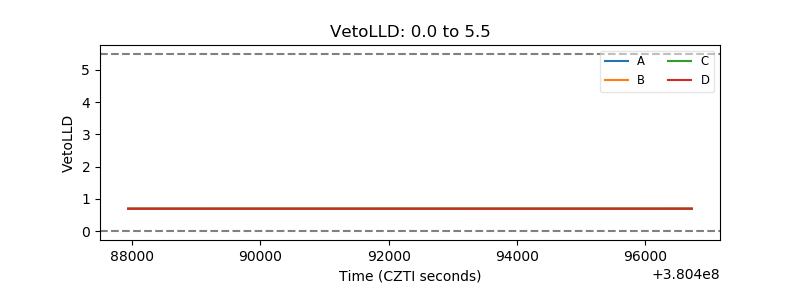 |
| Alpha Counter | 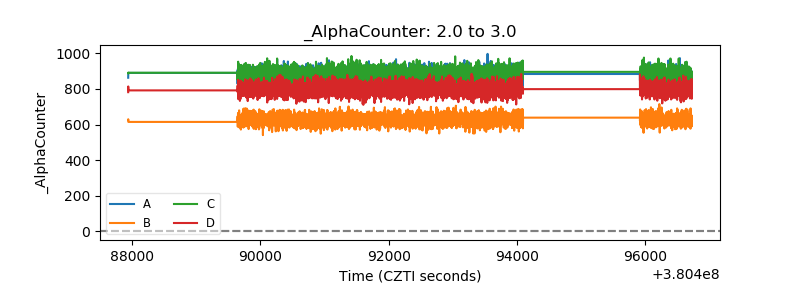 |
| _CPM_Rate | 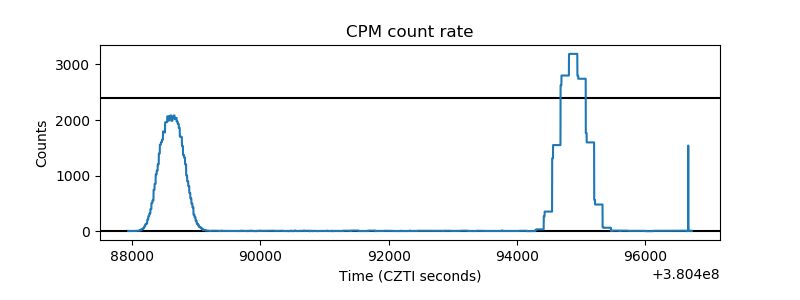 |
| CZT Counter | 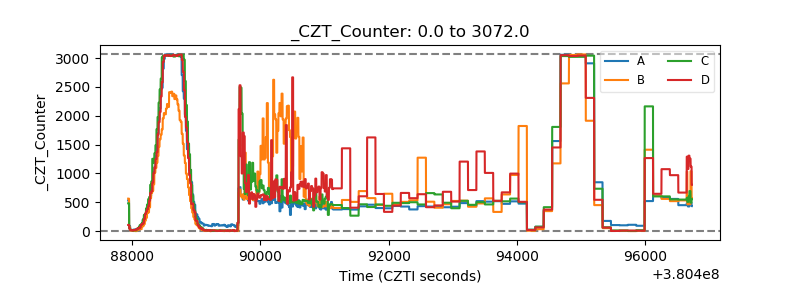 |
| +2.5 Volts monitor |  |
| +5 Volts monitor |  |
| _ROLL_ROT | 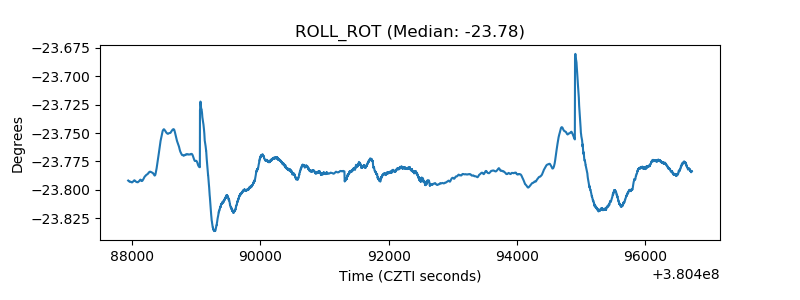 |
| _Roll_DEC | 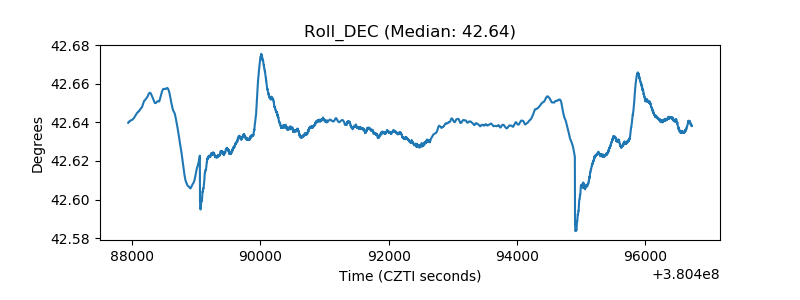 |
| _Roll_RA | 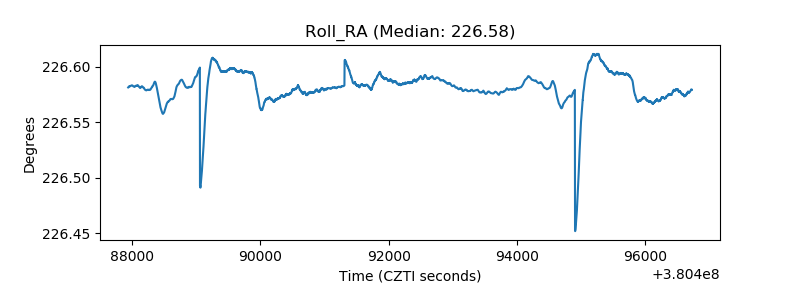 |
| Veto Counter | 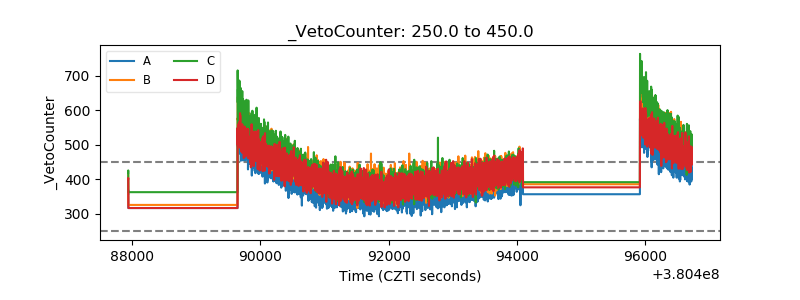 |