| Param | Original file | Final file |
|---|---|---|
| Filename | modeM0/AS1A11_054T07_9000004878_34160cztM0_level2.evt | modeM0/AS1A11_054T07_9000004878_34160cztM0_level2_quad_clean.evt |
| Size (bytes) | 442,912,320 | 92,381,760 |
| Size | 422.4 MB | 88.1 MB |
| Events in quadrant A | 2,440,945 | 616,470 |
| Events in quadrant B | 2,795,802 | 639,061 |
| Events in quadrant C | 3,589,306 | 612,883 |
| Events in quadrant D | 4,246,780 | 577,143 |
| Mode SS | |||
|---|---|---|---|
| Quadrant | BADHDUFLAG | Total packets | Discarded packets |
| A | 0 | 102 | 0 |
| B | 0 | 102 | 0 |
| C | 0 | 102 | 0 |
| D | 0 | 102 | 0 |
| Mode M0 | |||
|---|---|---|---|
| Quadrant | BADHDUFLAG | Total packets | Discarded packets |
| A | 0 | 10425 | 3 |
| B | 0 | 11402 | 2 |
| C | 0 | 13819 | 2 |
| D | 0 | 16181 | 2 |
| Mode M9 | |||
|---|---|---|---|
| Quadrant | BADHDUFLAG | Total packets | Discarded packets |
| A | 0 | 30 | 0 |
| B | 0 | 30 | 0 |
| C | 0 | 30 | 0 |
| D | 0 | 31 | 0 |
| Quadrant | Total seconds | Saturated seconds | Saturation percentage |
|---|---|---|---|
| A | 5025 | 5 | 0.099502% |
| B | 5025 | 61 | 1.213930% |
| C | 5025 | 312 | 6.208955% |
| D | 5025 | 67 | 1.333333% |
Noise dominated data is calculated using 1-second bins in cleaned event files. If a bin has >2000 counts, and if more than 50% of those come from <1% of pixels, then it is considered to be noise-dominated and hence unusable.
| Quadrant | # 1 sec bins | Bins with >0 counts | Bins with >2000 counts | High rate bins dominated by noise | Noise dominated (total time) | Noise dominated (detector-on time) | Marked lightcurve |
|---|---|---|---|---|---|---|---|
| A | 6998 | 5026 | 2 | 2 | 0.03% | 0.04% | 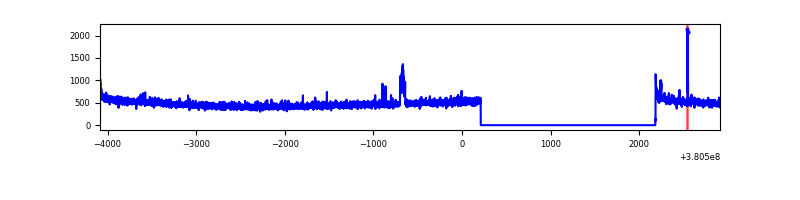 |
| B | 6998 | 5026 | 39 | 39 | 0.56% | 0.78% | 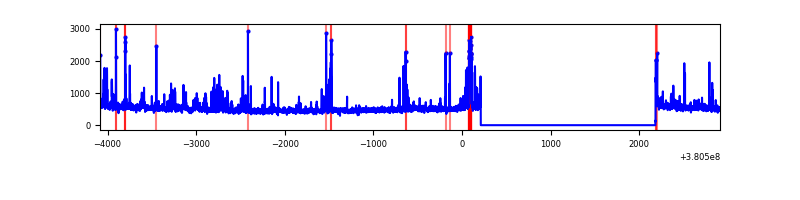 |
| C | 6998 | 5026 | 274 | 274 | 3.92% | 5.45% | 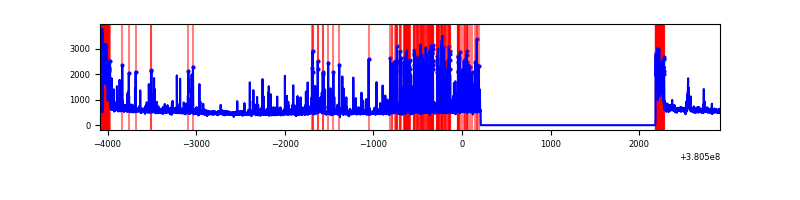 |
| D | 6998 | 5026 | 45 | 45 | 0.64% | 0.90% | 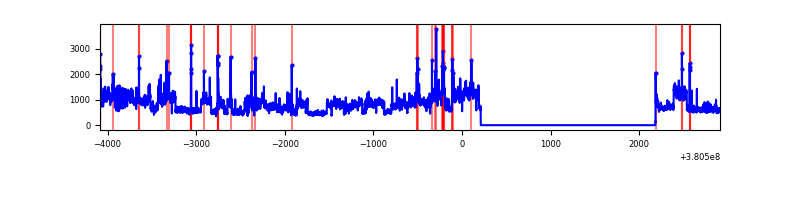 |
Top three noisy pixels from each quadrant. If the there are fewer than three noisy pixels in the level2.evt file, extra rows are filled as -1
| Pixel properties | Quadrant properties | ||||||
|---|---|---|---|---|---|---|---|
| Quadrant | DetID | PixID | Counts | Sigma | Mean | Median | Sigma |
| A | 15 | 169 | 40303 | 324.2 | 613 | 603 | 122.5 |
| A | 10 | 83 | 20708 | 164.18 | 613 | 603 | 122.5 |
| A | 13 | 6 | 10986 | 84.79 | 613 | 603 | 122.5 |
| B | 5 | 172 | 143326 | 1218.44 | 616 | 601 | 117.1 |
| B | 5 | 255 | 100884 | 856.11 | 616 | 601 | 117.1 |
| B | 4 | 232 | 46690 | 393.46 | 616 | 601 | 117.1 |
| C | 0 | 10 | 635869 | 4701.88 | 585 | 592 | 135.1 |
| C | 0 | 239 | 412679 | 3049.98 | 585 | 592 | 135.1 |
| C | 15 | 214 | 210809 | 1555.88 | 585 | 592 | 135.1 |
| D | 8 | 195 | 1557566 | 10608.53 | 594 | 578 | 146.8 |
| D | 1 | 52 | 112148 | 760.18 | 594 | 578 | 146.8 |
| D | 7 | 223 | 79807 | 539.83 | 594 | 578 | 146.8 |
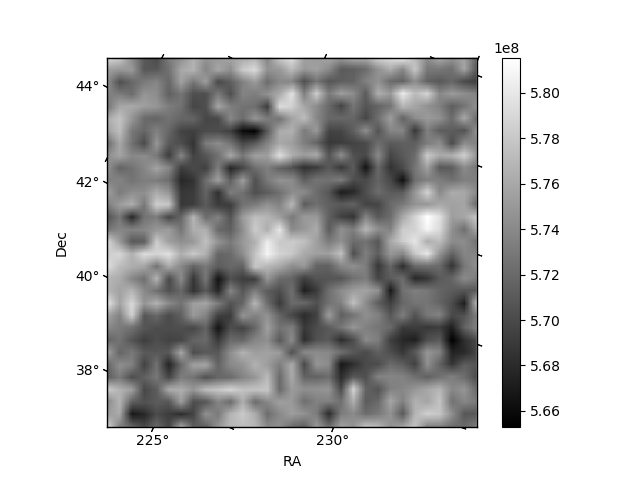
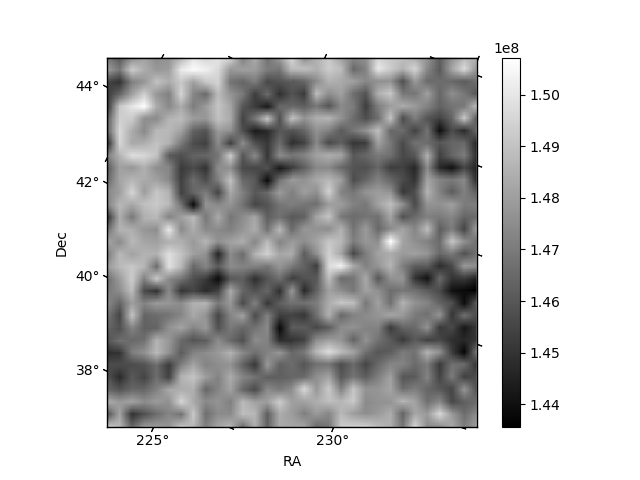
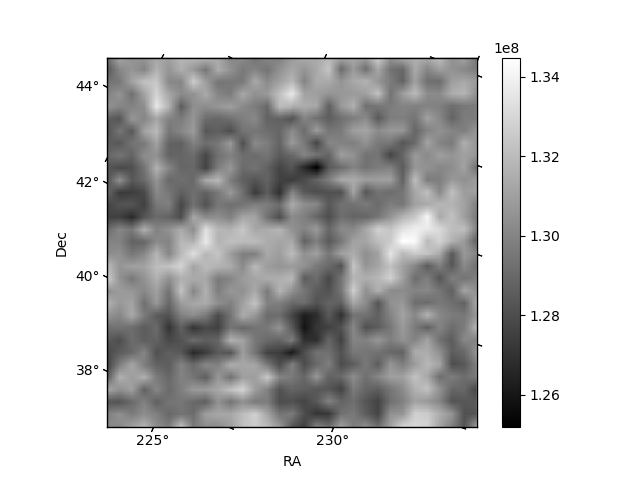
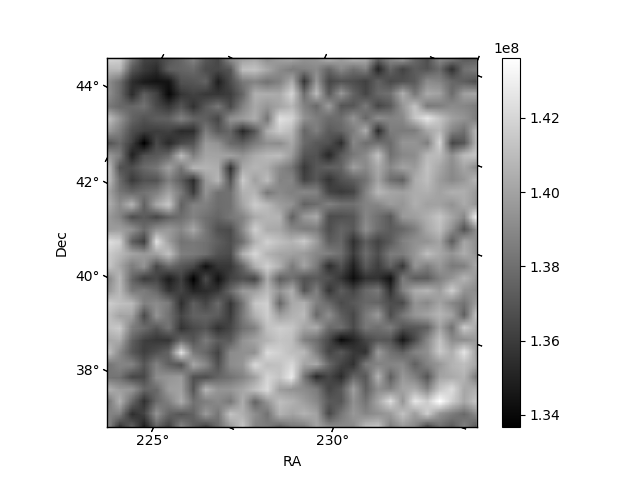
Histogram calculated using DETX and DETY for each event in the final _common_clean file
| Quadrant A | 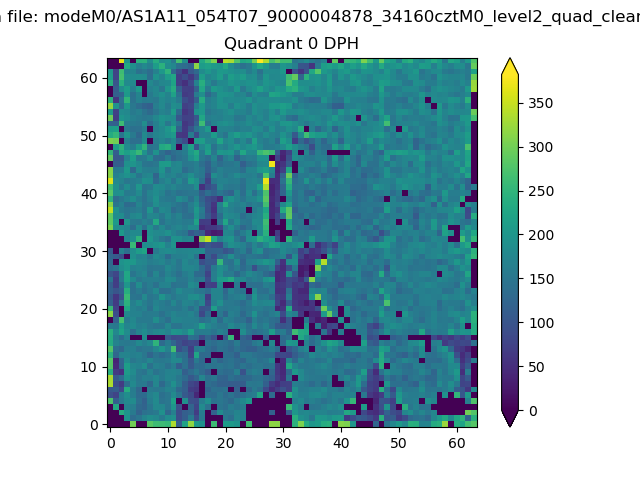 |
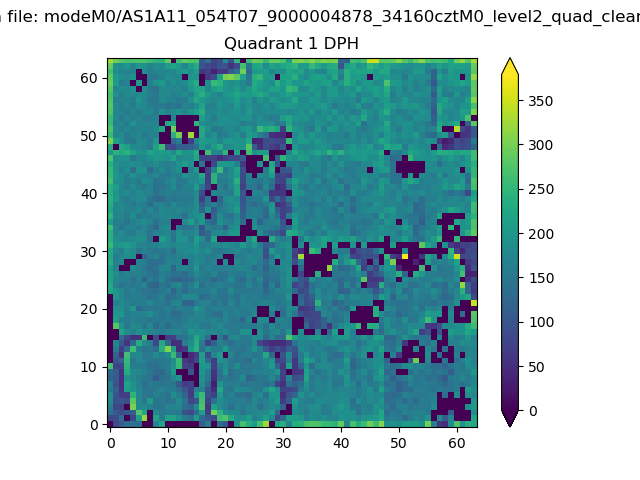 |
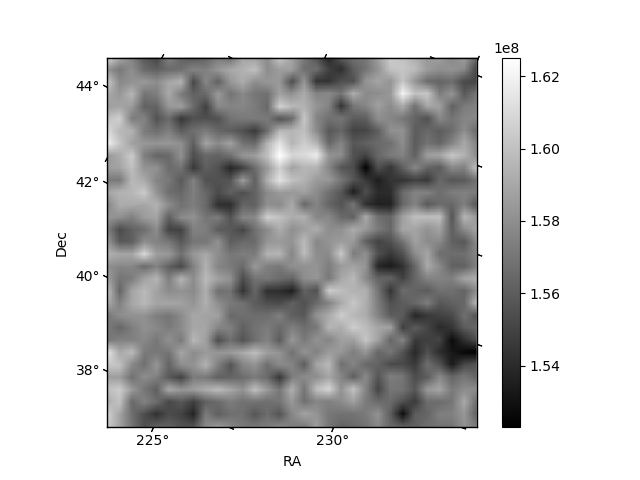
Quadrant B |
|---|---|---|---|
| Quadrant D | 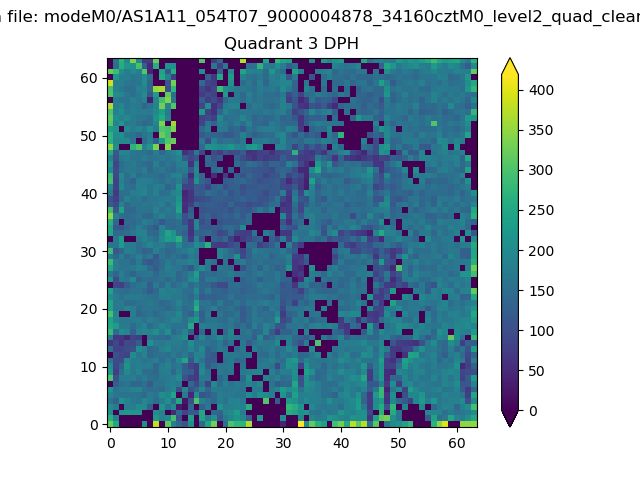 |
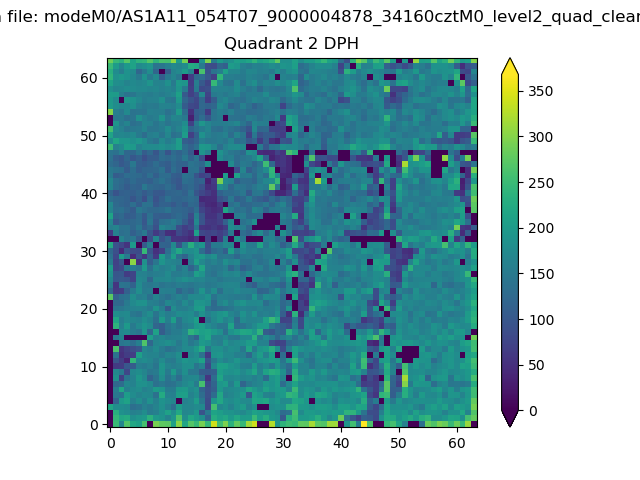 |
Quadrant C |
| Plot type | Count rate plots | Images |
|---|---|---|
| Comparison with Poisson distribution Blue bars denote a histogram of data divided into 1 sec bins. Red curve is a Poisson curve with rate = median count rate of data. |
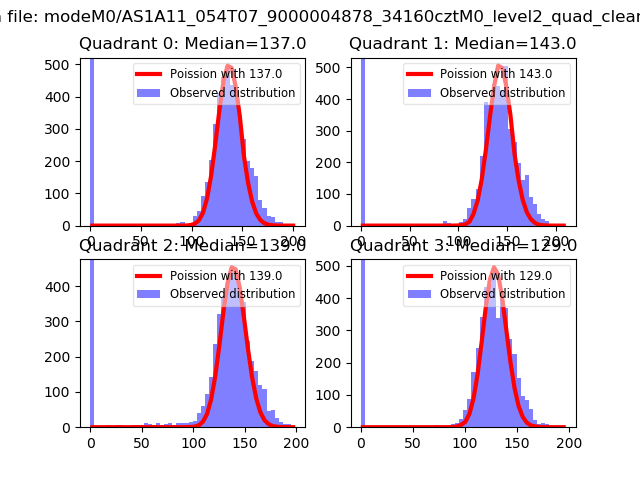 |
 |
| Quadrant-wise count rates Data is divided into 100 sec bins |
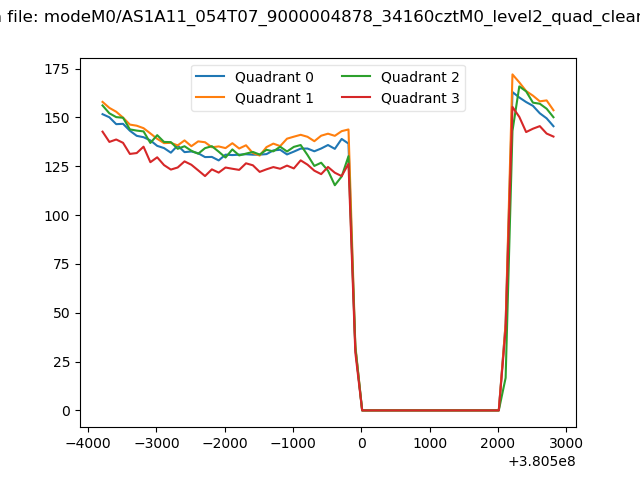 |
|
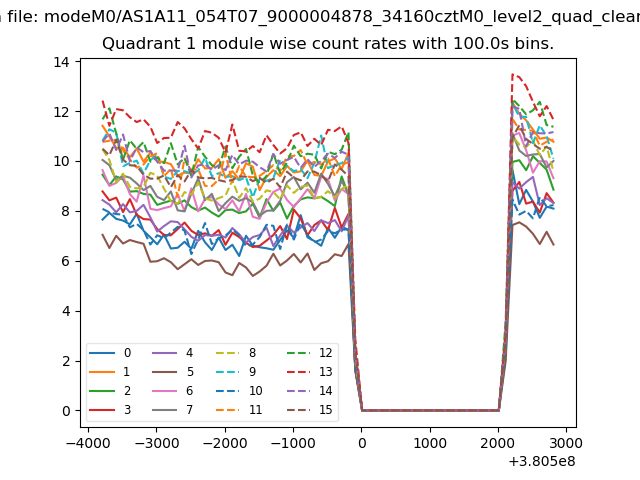
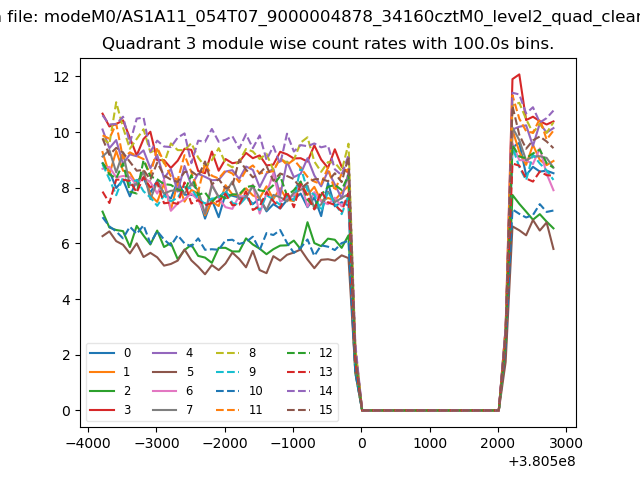
| Module-wise count rates for Quadrant A Data is divided into 100 sec bins |
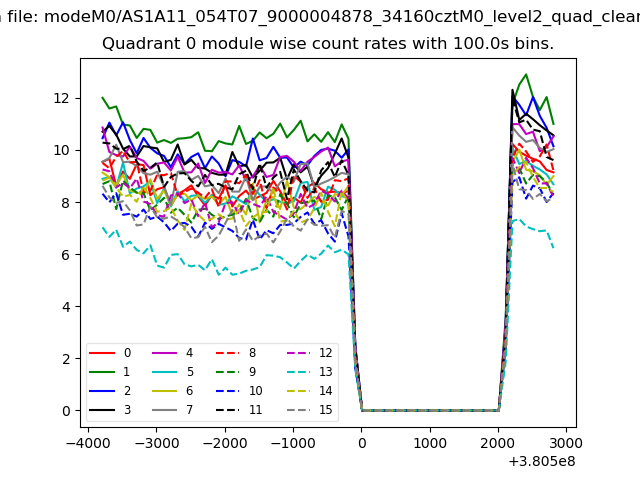 |
 |
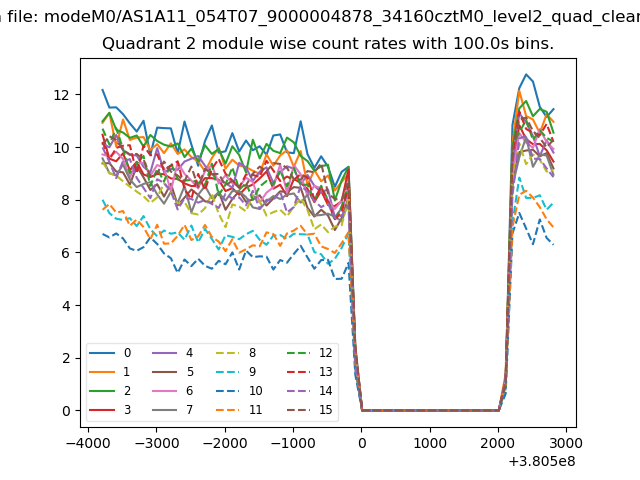
| Module-wise count rates for Quadrant B Data is divided into 100 sec bins |
 |
 |
| Module-wise count rates for Quadrant C Data is divided into 100 sec bins |
 |
 |
| Module-wise count rates for Quadrant D Data is divided into 100 sec bins |
 |
 |
| Parameter | Plot |
|---|---|
| CZT HV Monitor |  |
| D_VDD | 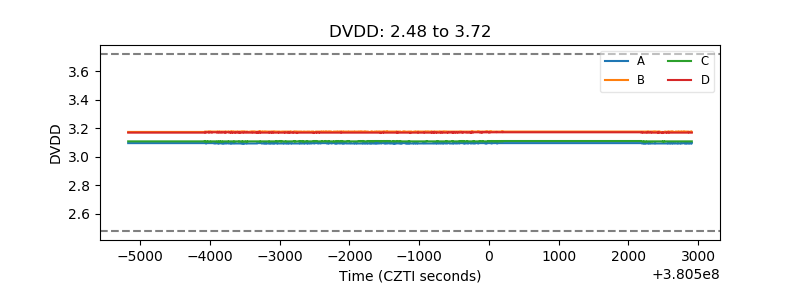 |
| Temperature 1 | 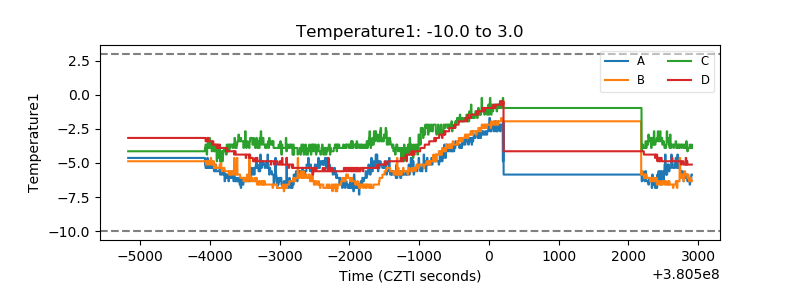 |
| Veto HV Monitor | 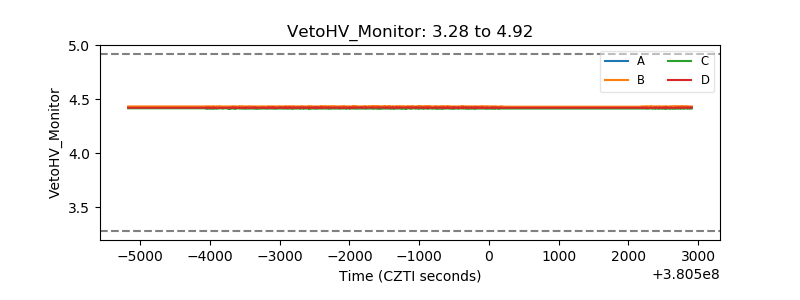 |
| Veto LLD | 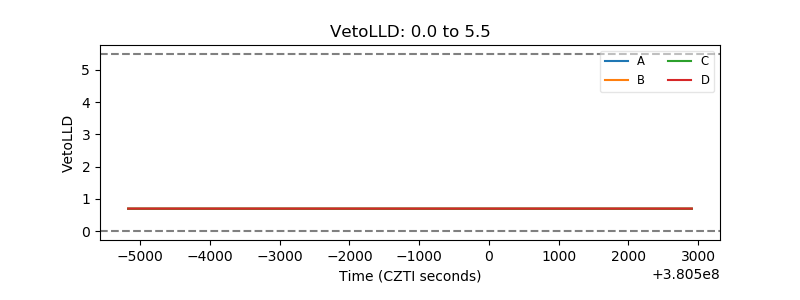 |
| Alpha Counter | 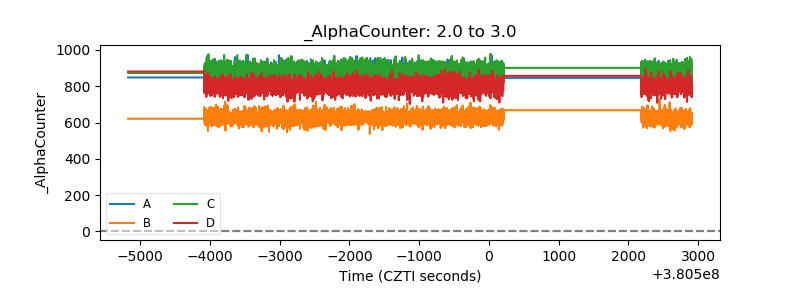 |
| _CPM_Rate | 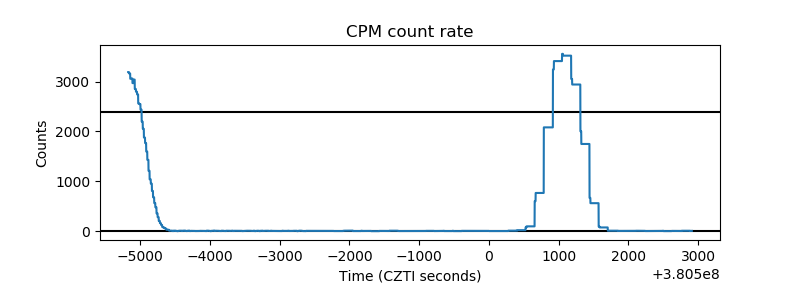 |
| CZT Counter | 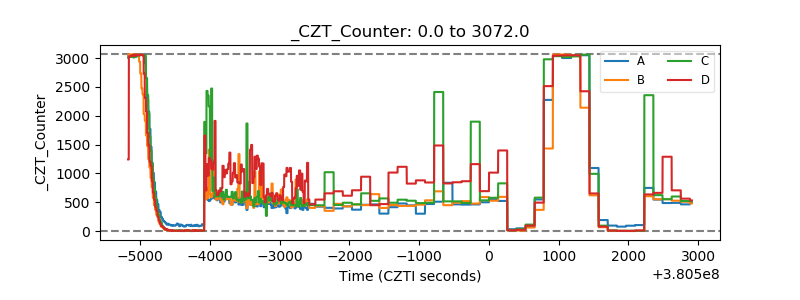 |
| +2.5 Volts monitor | 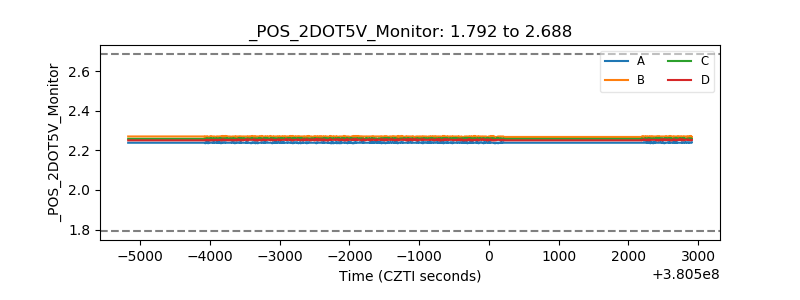 |
| +5 Volts monitor |  |
| _ROLL_ROT | 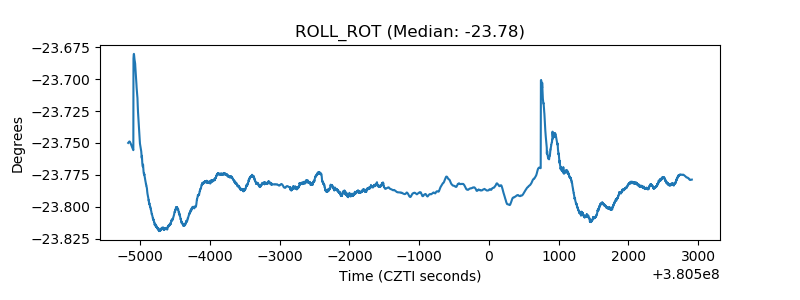 |
| _Roll_DEC | 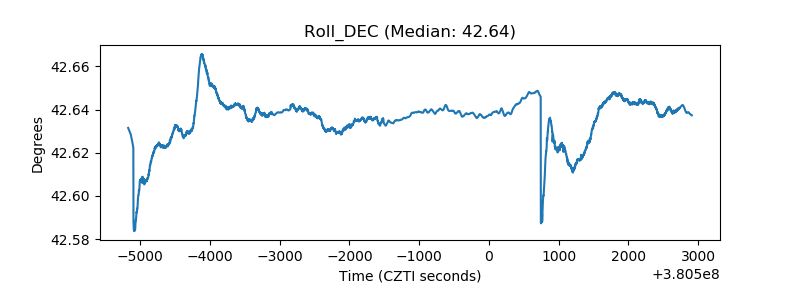 |
| _Roll_RA | 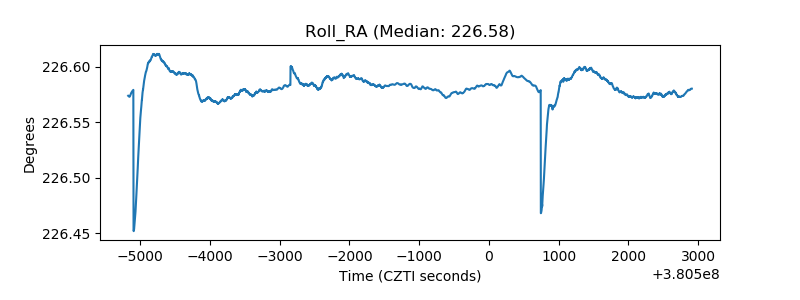 |
| Veto Counter | 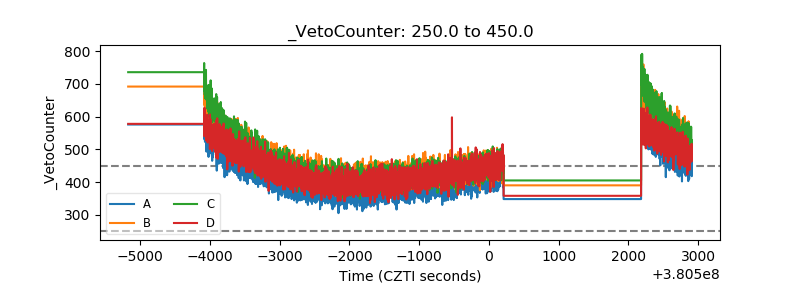 |