| Param | Original file | Final file |
|---|---|---|
| Filename | modeM0/AS1A11_054T07_9000004878_34161cztM0_level2.evt | modeM0/AS1A11_054T07_9000004878_34161cztM0_level2_quad_clean.evt |
| Size (bytes) | 414,132,480 | 91,765,440 |
| Size | 394.9 MB | 87.5 MB |
| Events in quadrant A | 2,376,037 | 613,445 |
| Events in quadrant B | 2,842,144 | 636,449 |
| Events in quadrant C | 3,044,688 | 613,362 |
| Events in quadrant D | 3,945,700 | 571,289 |
| Mode SS | |||
|---|---|---|---|
| Quadrant | BADHDUFLAG | Total packets | Discarded packets |
| A | 0 | 100 | 0 |
| B | 0 | 100 | 0 |
| C | 0 | 100 | 0 |
| D | 0 | 100 | 0 |
| Mode M0 | |||
|---|---|---|---|
| Quadrant | BADHDUFLAG | Total packets | Discarded packets |
| A | 0 | 10073 | 3 |
| B | 0 | 11465 | 2 |
| C | 0 | 12015 | 2 |
| D | 0 | 15082 | 2 |
| Mode M9 | |||
|---|---|---|---|
| Quadrant | BADHDUFLAG | Total packets | Discarded packets |
| A | 0 | 28 | 0 |
| B | 0 | 28 | 0 |
| C | 0 | 28 | 0 |
| D | 0 | 29 | 0 |
| Quadrant | Total seconds | Saturated seconds | Saturation percentage |
|---|---|---|---|
| A | 4912 | 4 | 0.081433% |
| B | 4912 | 68 | 1.384365% |
| C | 4912 | 123 | 2.504072% |
| D | 4912 | 107 | 2.178339% |
Noise dominated data is calculated using 1-second bins in cleaned event files. If a bin has >2000 counts, and if more than 50% of those come from <1% of pixels, then it is considered to be noise-dominated and hence unusable.
| Quadrant | # 1 sec bins | Bins with >0 counts | Bins with >2000 counts | High rate bins dominated by noise | Noise dominated (total time) | Noise dominated (detector-on time) | Marked lightcurve |
|---|---|---|---|---|---|---|---|
| A | 6973 | 4913 | 2 | 2 | 0.03% | 0.04% | 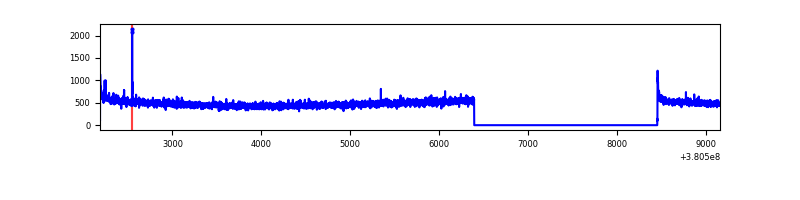 |
| B | 6973 | 4913 | 55 | 55 | 0.79% | 1.12% | 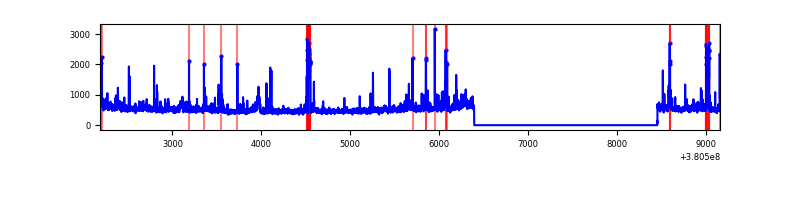 |
| C | 6973 | 4913 | 94 | 94 | 1.35% | 1.91% | 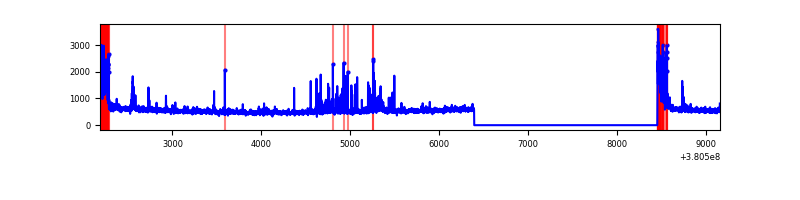 |
| D | 6973 | 4912 | 67 | 67 | 0.96% | 1.36% | 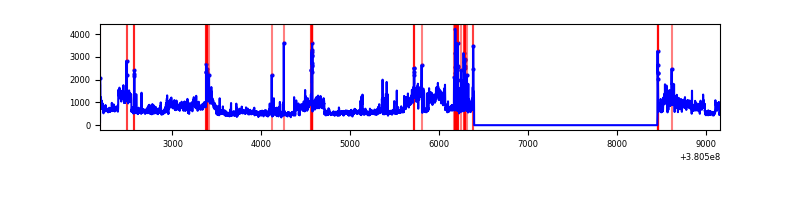 |
Top three noisy pixels from each quadrant. If the there are fewer than three noisy pixels in the level2.evt file, extra rows are filled as -1
| Pixel properties | Quadrant properties | ||||||
|---|---|---|---|---|---|---|---|
| Quadrant | DetID | PixID | Counts | Sigma | Mean | Median | Sigma |
| A | 10 | 83 | 20295 | 161.79 | 604 | 593 | 121.8 |
| A | 13 | 6 | 11661 | 90.89 | 604 | 593 | 121.8 |
| A | 15 | 169 | 11461 | 89.24 | 604 | 593 | 121.8 |
| B | 5 | 172 | 110971 | 962.48 | 608 | 593 | 114.7 |
| B | 0 | 229 | 102263 | 886.55 | 608 | 593 | 114.7 |
| B | 5 | 255 | 82663 | 715.64 | 608 | 593 | 114.7 |
| C | 0 | 10 | 390716 | 2876.64 | 588 | 595 | 135.6 |
| C | 15 | 214 | 209539 | 1540.7 | 588 | 595 | 135.6 |
| C | 0 | 239 | 130837 | 960.37 | 588 | 595 | 135.6 |
| D | 8 | 195 | 1221512 | 8652.63 | 576 | 559 | 141.1 |
| D | 13 | 249 | 162614 | 1148.45 | 576 | 559 | 141.1 |
| D | 1 | 52 | 130553 | 921.24 | 576 | 559 | 141.1 |
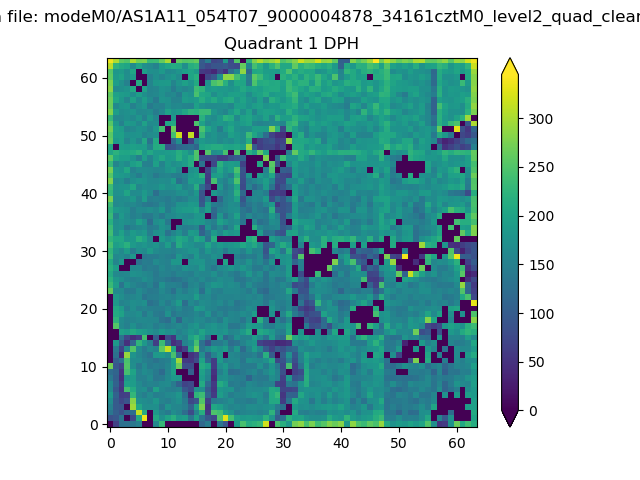
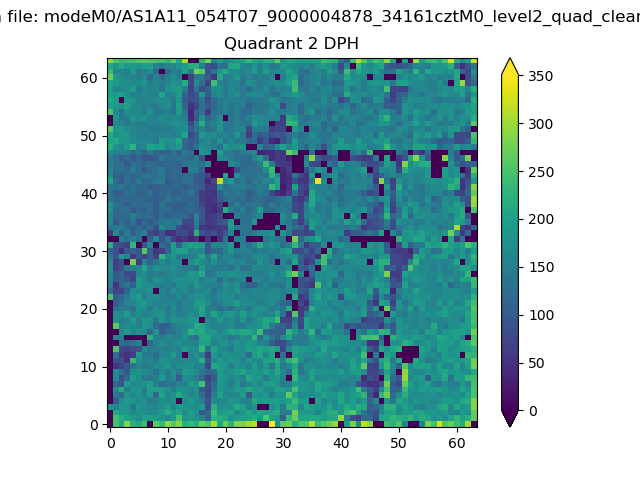
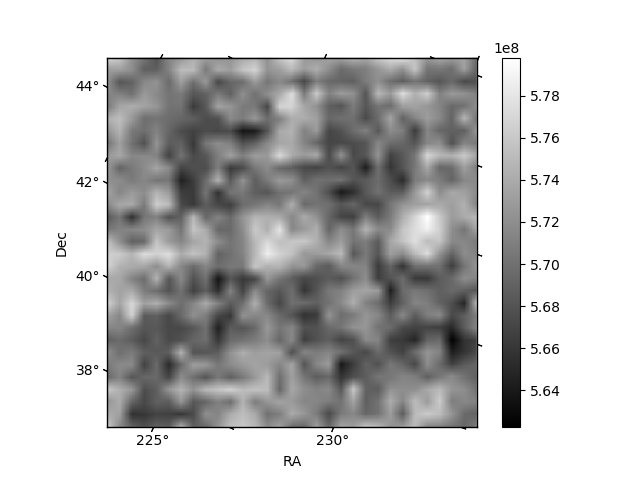
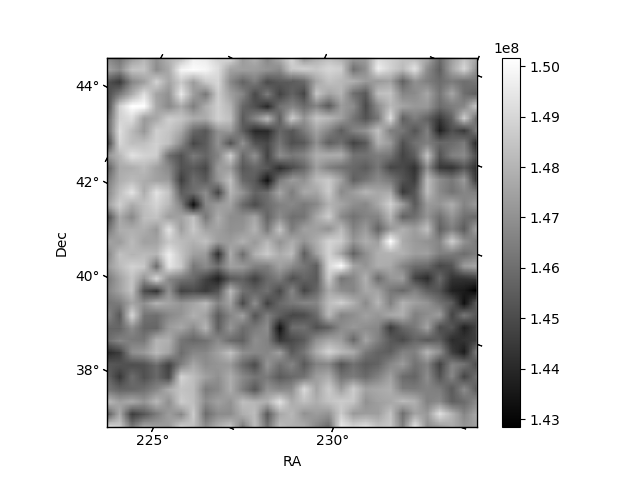
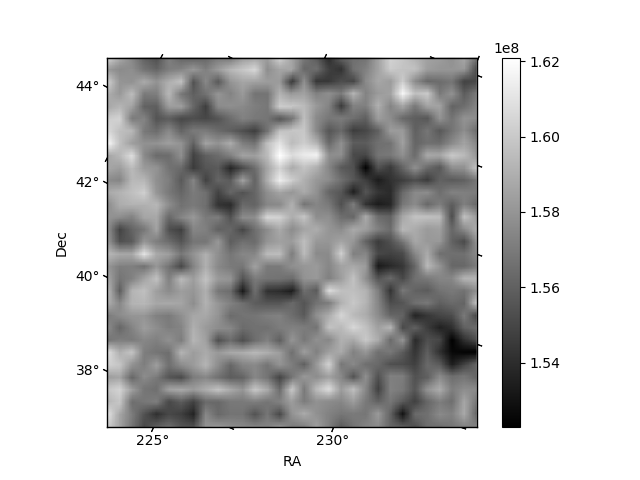
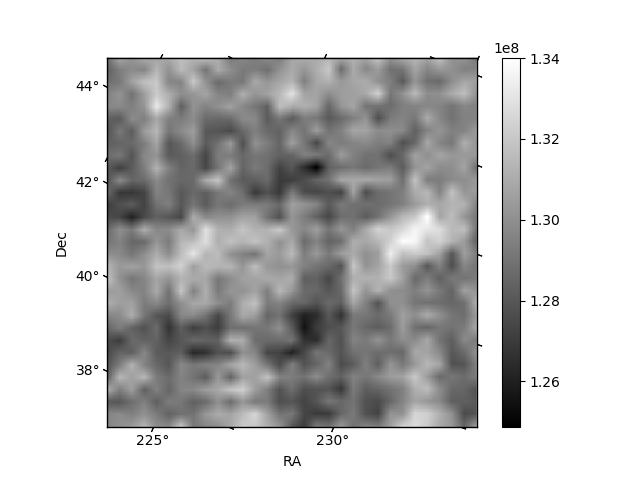
Histogram calculated using DETX and DETY for each event in the final _common_clean file
| Quadrant A |  |
 |
Quadrant B |
|---|---|---|---|
| Quadrant D | 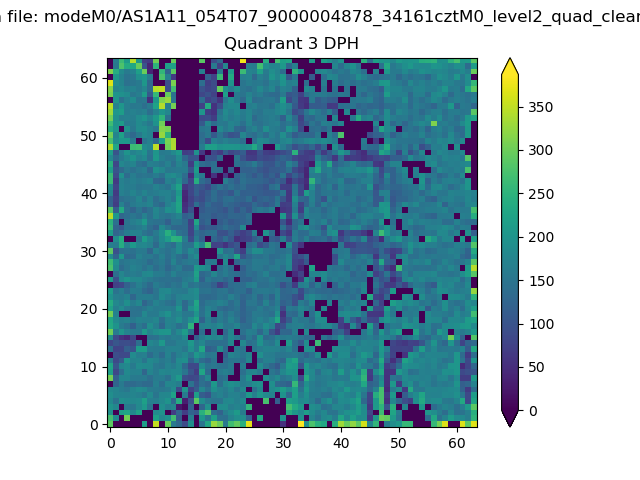 |
 |
Quadrant C |
| Plot type | Count rate plots | Images |
|---|---|---|
| Comparison with Poisson distribution Blue bars denote a histogram of data divided into 1 sec bins. Red curve is a Poisson curve with rate = median count rate of data. |
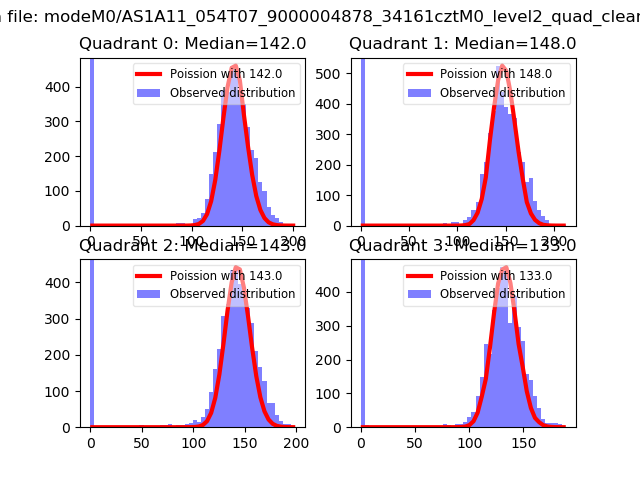 |
 |
| Quadrant-wise count rates Data is divided into 100 sec bins |
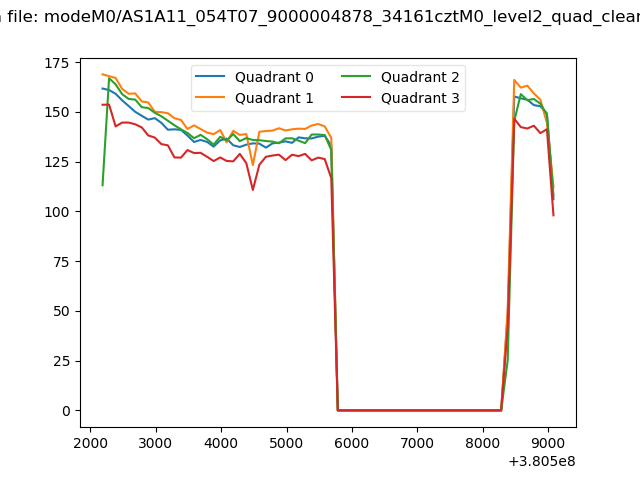 |
|
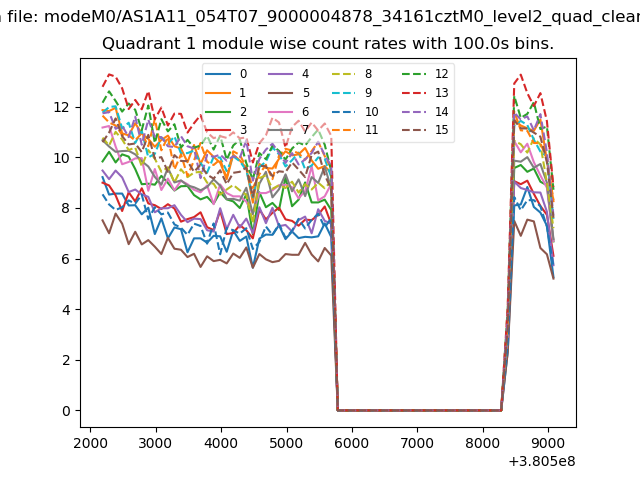
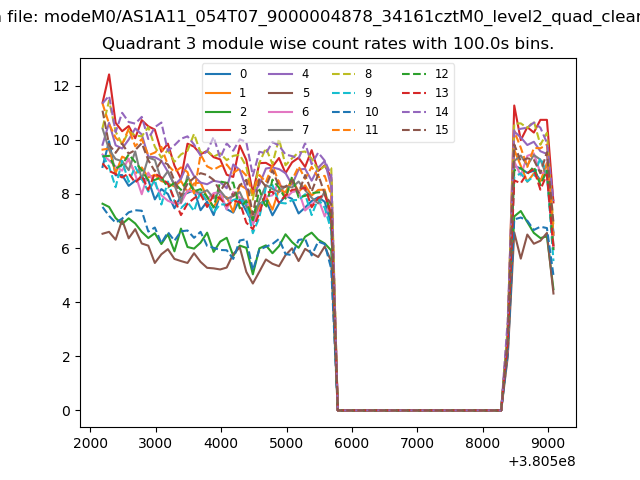
| Module-wise count rates for Quadrant A Data is divided into 100 sec bins |
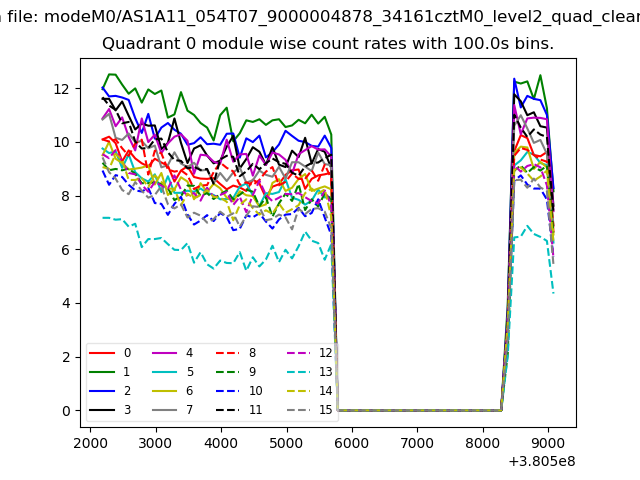 |
 |
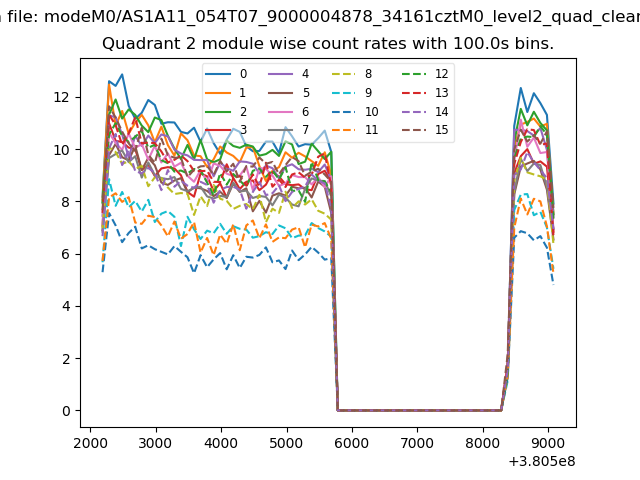
| Module-wise count rates for Quadrant B Data is divided into 100 sec bins |
 |
 |
| Module-wise count rates for Quadrant C Data is divided into 100 sec bins |
 |
 |
| Module-wise count rates for Quadrant D Data is divided into 100 sec bins |
 |
 |
| Parameter | Plot |
|---|---|
| CZT HV Monitor | 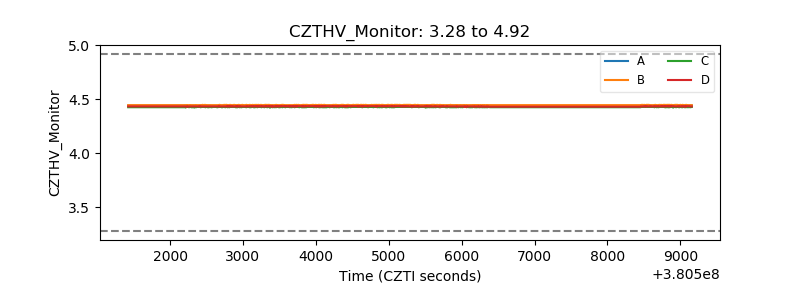 |
| D_VDD | 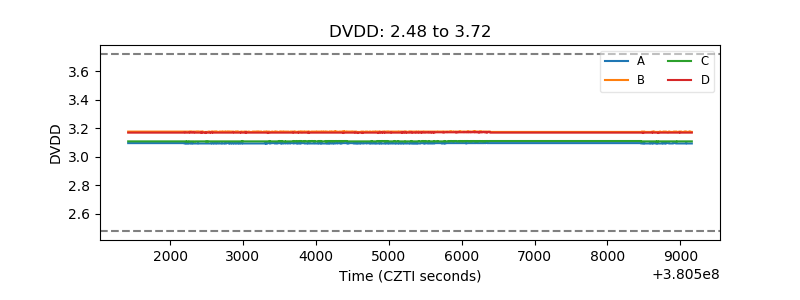 |
| Temperature 1 | 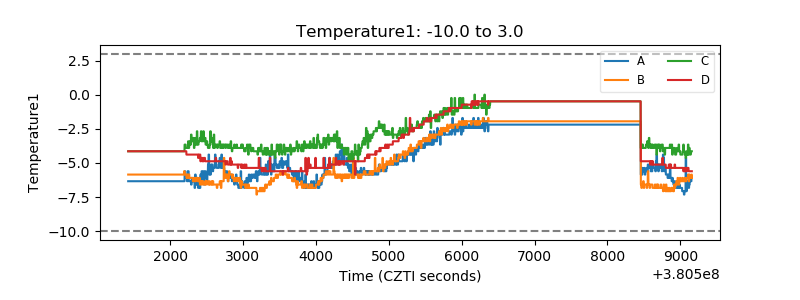 |
| Veto HV Monitor | 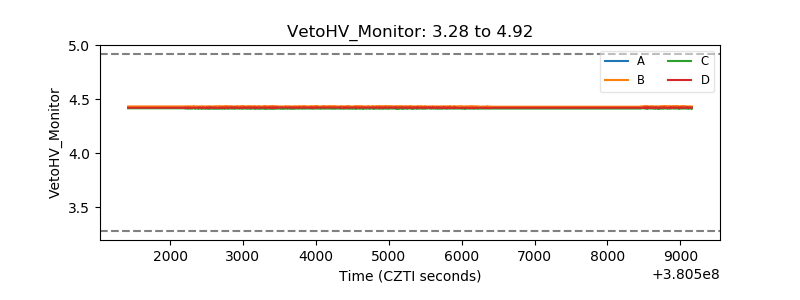 |
| Veto LLD |  |
| Alpha Counter |  |
| _CPM_Rate | 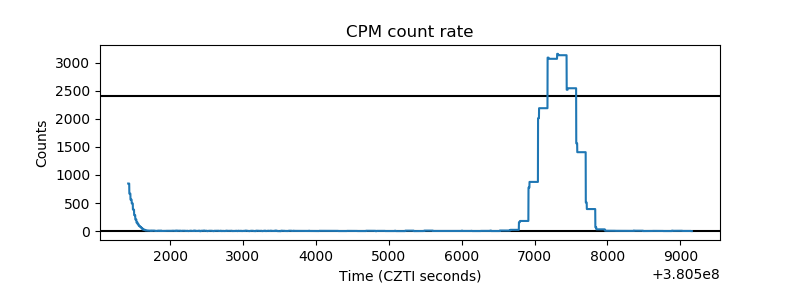 |
| CZT Counter | 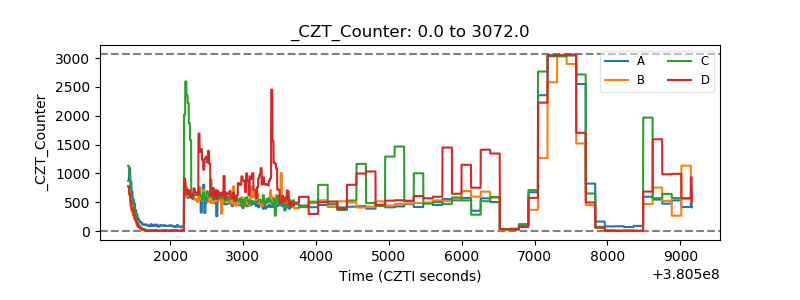 |
| +2.5 Volts monitor |  |
| +5 Volts monitor |  |
| _ROLL_ROT | 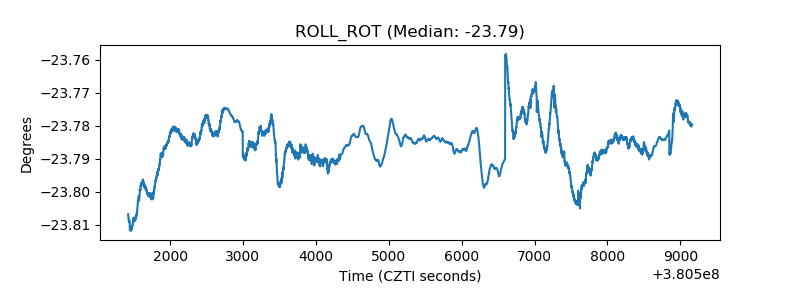 |
| _Roll_DEC | 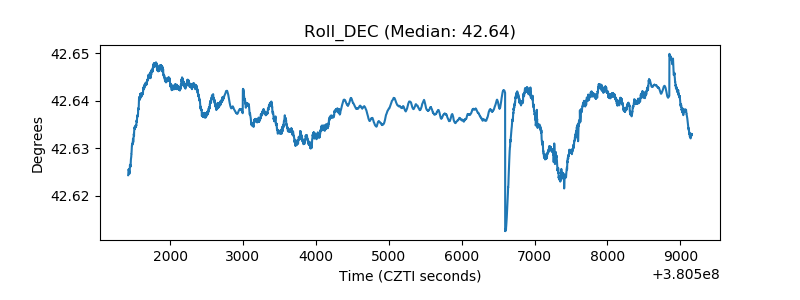 |
| _Roll_RA |  |
| Veto Counter | 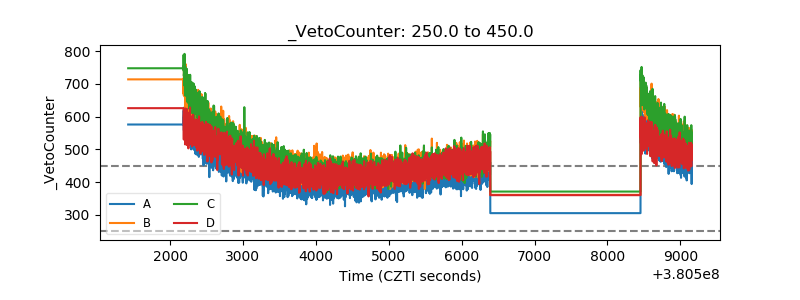 |