| Param | Original file | Final file |
|---|---|---|
| Filename | modeM0/AS1A11_054T07_9000004878_34162cztM0_level2.evt | modeM0/AS1A11_054T07_9000004878_34162cztM0_level2_quad_clean.evt |
| Size (bytes) | 235,408,320 | 63,204,480 |
| Size | 224.5 MB | 60.3 MB |
| Events in quadrant A | 1,399,119 | 427,120 |
| Events in quadrant B | 1,670,596 | 444,492 |
| Events in quadrant C | 1,720,794 | 427,154 |
| Events in quadrant D | 2,130,491 | 398,431 |
| Mode SS | |||
|---|---|---|---|
| Quadrant | BADHDUFLAG | Total packets | Discarded packets |
| A | 0 | 60 | 0 |
| B | 0 | 60 | 0 |
| C | 0 | 60 | 0 |
| D | 0 | 60 | 0 |
| Mode M0 | |||
|---|---|---|---|
| Quadrant | BADHDUFLAG | Total packets | Discarded packets |
| A | 0 | 6149 | 1 |
| B | 0 | 6879 | 1 |
| C | 0 | 6929 | 1 |
| D | 0 | 8384 | 1 |
| Mode M9 | |||
|---|---|---|---|
| Quadrant | BADHDUFLAG | Total packets | Discarded packets |
| A | 0 | 16 | 0 |
| B | 0 | 16 | 0 |
| C | 0 | 16 | 0 |
| D | 0 | 17 | 0 |
| Quadrant | Total seconds | Saturated seconds | Saturation percentage |
|---|---|---|---|
| A | 3045 | 2 | 0.065681% |
| B | 3045 | 31 | 1.018062% |
| C | 3045 | 56 | 1.839080% |
| D | 3045 | 14 | 0.459770% |
Noise dominated data is calculated using 1-second bins in cleaned event files. If a bin has >2000 counts, and if more than 50% of those come from <1% of pixels, then it is considered to be noise-dominated and hence unusable.
| Quadrant | # 1 sec bins | Bins with >0 counts | Bins with >2000 counts | High rate bins dominated by noise | Noise dominated (total time) | Noise dominated (detector-on time) | Marked lightcurve |
|---|---|---|---|---|---|---|---|
| A | 3045 | 3045 | 0 | 0 | 0.00% | 0.00% | 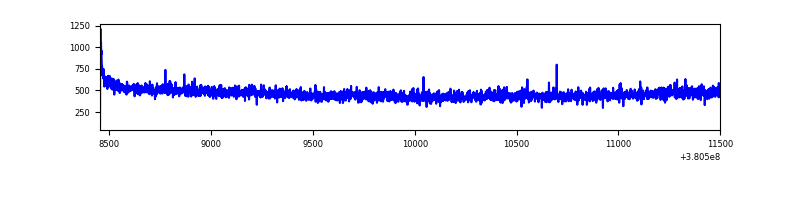 |
| B | 3045 | 3045 | 26 | 26 | 0.85% | 0.85% | 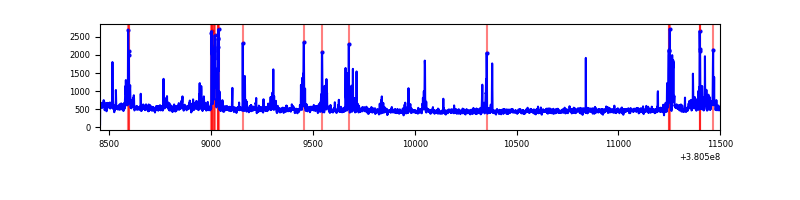 |
| C | 3045 | 3045 | 36 | 36 | 1.18% | 1.18% | 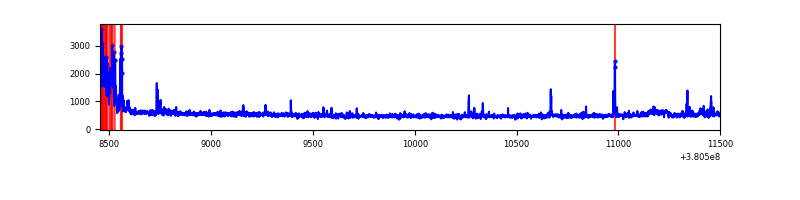 |
| D | 3045 | 3045 | 12 | 12 | 0.39% | 0.39% | 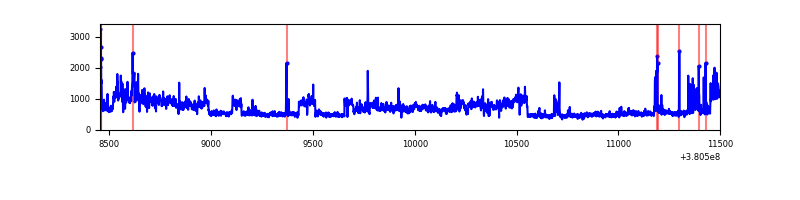 |
Top three noisy pixels from each quadrant. If the there are fewer than three noisy pixels in the level2.evt file, extra rows are filled as -1
| Pixel properties | Quadrant properties | ||||||
|---|---|---|---|---|---|---|---|
| Quadrant | DetID | PixID | Counts | Sigma | Mean | Median | Sigma |
| A | 10 | 83 | 10474 | 139.83 | 358 | 352 | 72.4 |
| A | 13 | 254 | 5465 | 70.63 | 358 | 352 | 72.4 |
| A | 13 | 6 | 3856 | 48.41 | 358 | 352 | 72.4 |
| B | 5 | 172 | 157056 | 2253.26 | 362 | 354 | 69.5 |
| B | 5 | 255 | 38919 | 554.54 | 362 | 354 | 69.5 |
| B | 0 | 245 | 20364 | 287.73 | 362 | 354 | 69.5 |
| C | 0 | 10 | 209358 | 2569.42 | 347 | 350 | 81.3 |
| C | 15 | 214 | 129573 | 1588.59 | 347 | 350 | 81.3 |
| C | 1 | 128 | 15805 | 189.99 | 347 | 350 | 81.3 |
| D | 8 | 195 | 642578 | 7633.37 | 341 | 331 | 84.1 |
| D | 1 | 52 | 35791 | 421.46 | 341 | 331 | 84.1 |
| D | 13 | 249 | 32485 | 382.16 | 341 | 331 | 84.1 |
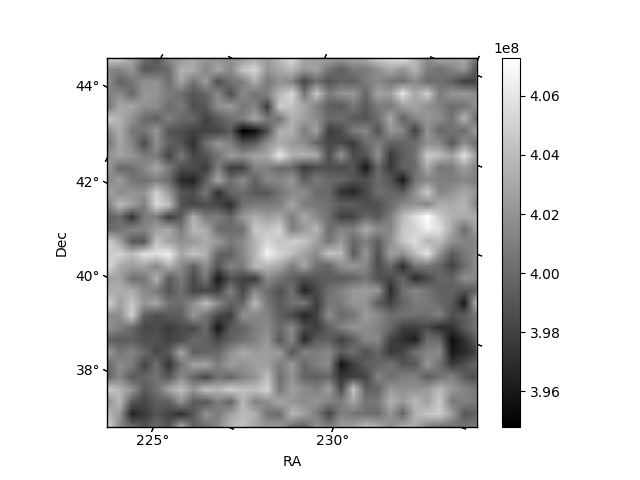
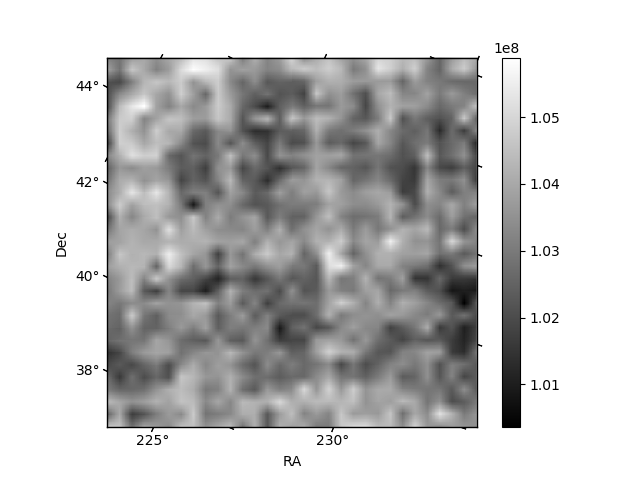
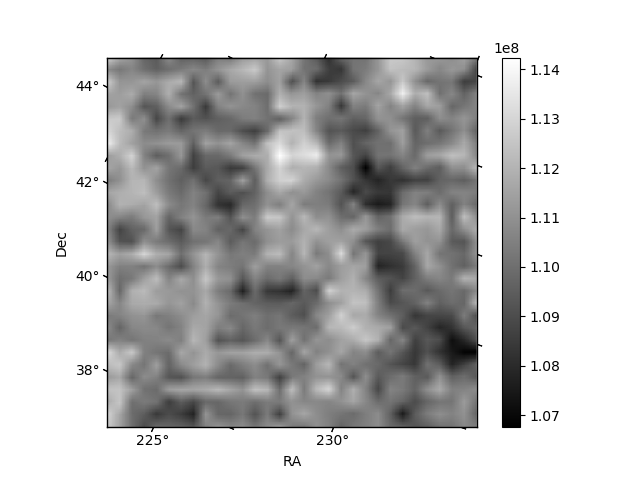
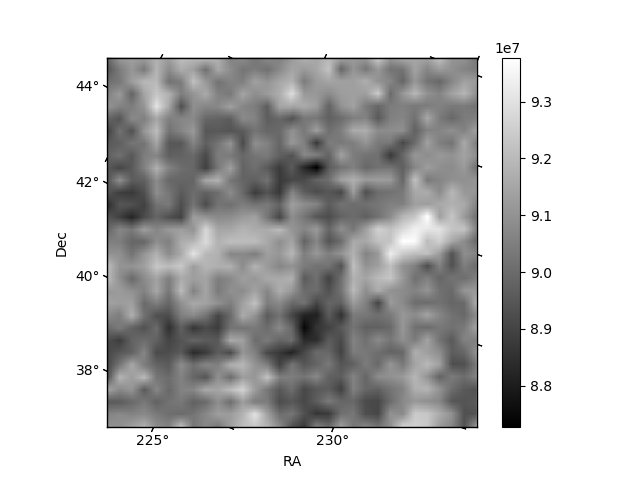
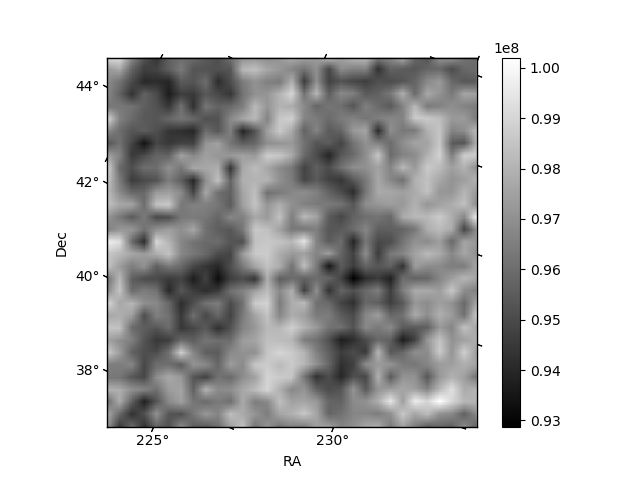
Histogram calculated using DETX and DETY for each event in the final _common_clean file
| Quadrant A | 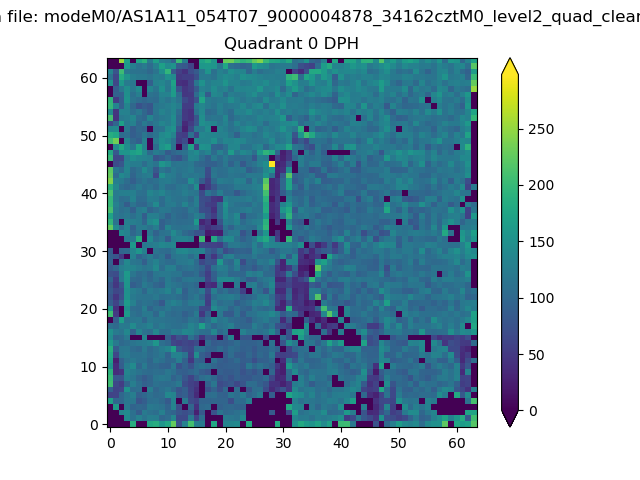 |
 |
Quadrant B |
|---|---|---|---|
| Quadrant D | 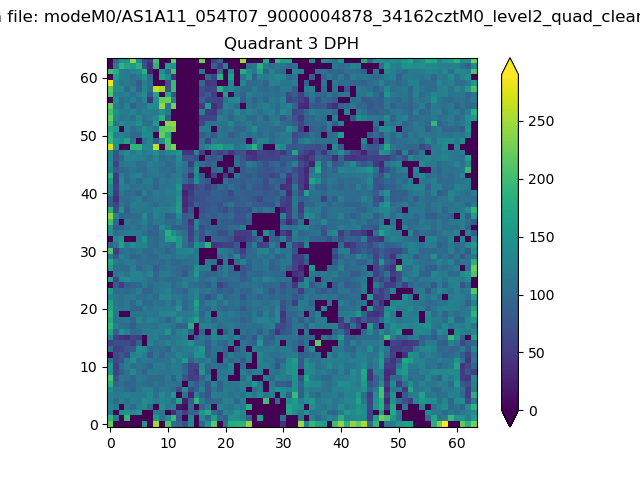 |
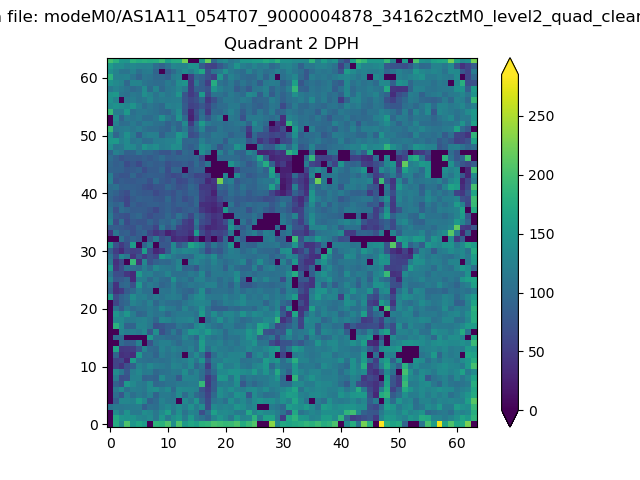 |
Quadrant C |
| Plot type | Count rate plots | Images |
|---|---|---|
| Comparison with Poisson distribution Blue bars denote a histogram of data divided into 1 sec bins. Red curve is a Poisson curve with rate = median count rate of data. |
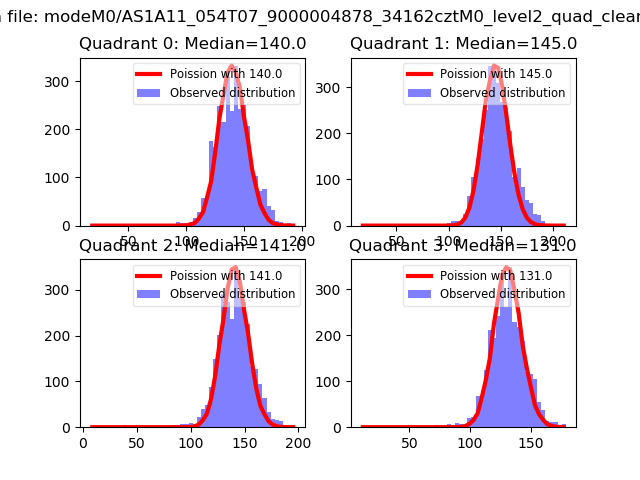 |
 |
| Quadrant-wise count rates Data is divided into 100 sec bins |
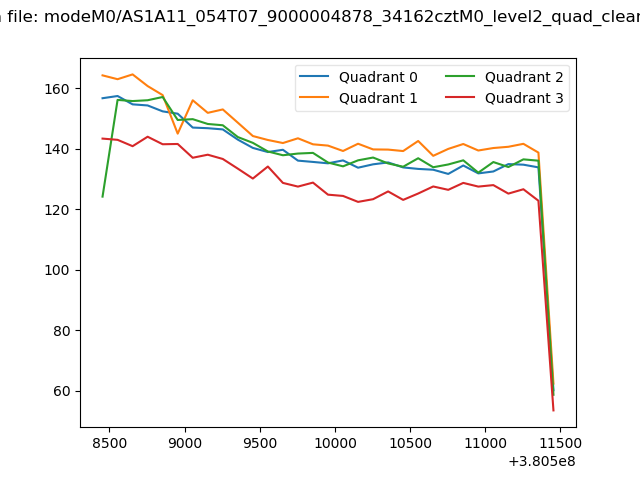 |
|
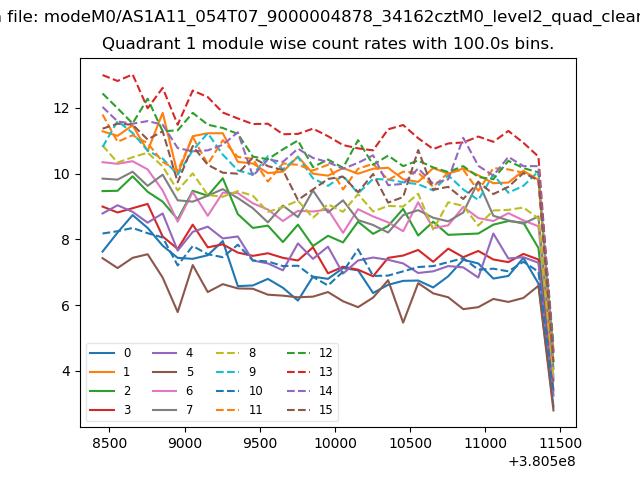
| Module-wise count rates for Quadrant A Data is divided into 100 sec bins |
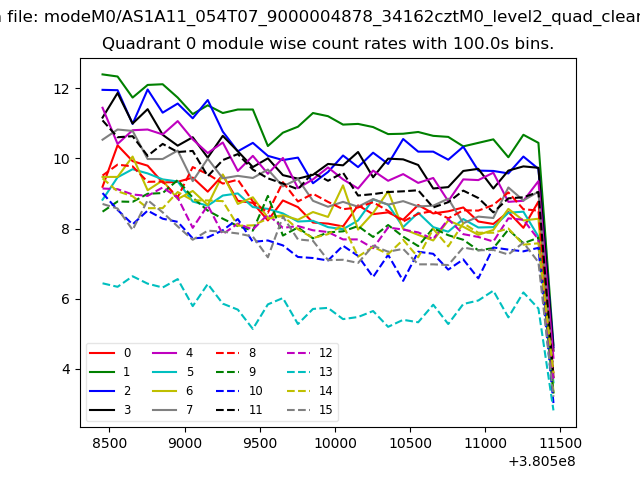 |
 |
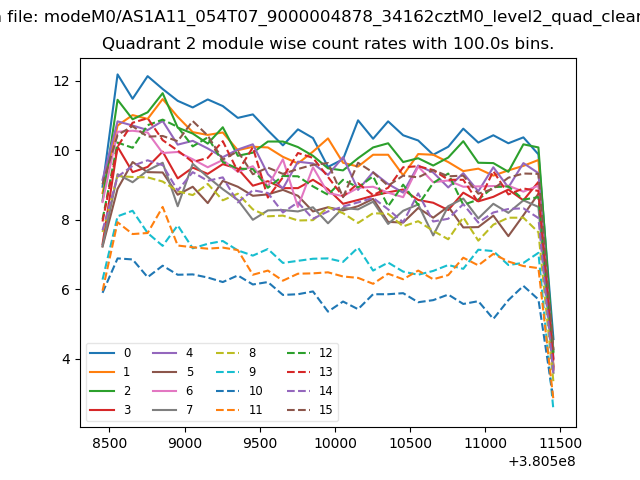
| Module-wise count rates for Quadrant B Data is divided into 100 sec bins |
 |
 |
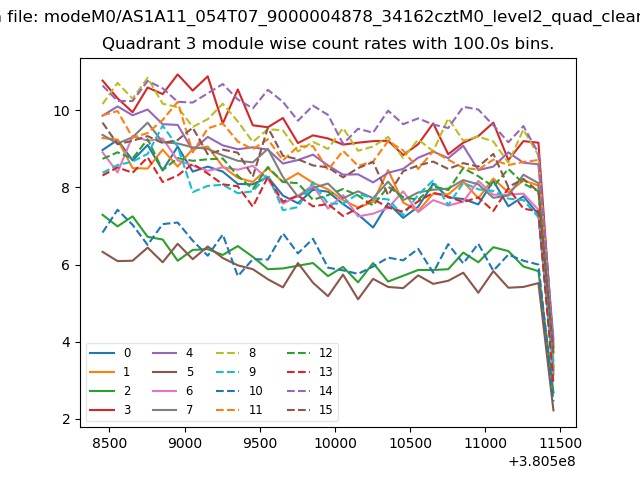
| Module-wise count rates for Quadrant C Data is divided into 100 sec bins |
 |
 |
| Module-wise count rates for Quadrant D Data is divided into 100 sec bins |
 |
 |
| Parameter | Plot |
|---|---|
| CZT HV Monitor |  |
| D_VDD | 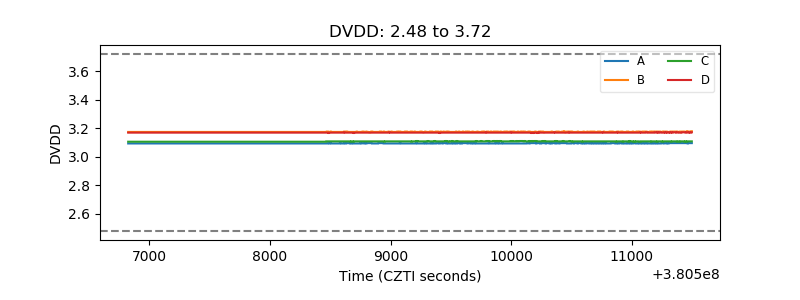 |
| Temperature 1 | 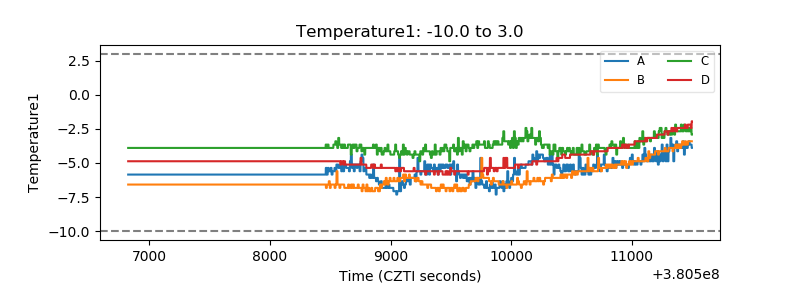 |
| Veto HV Monitor | 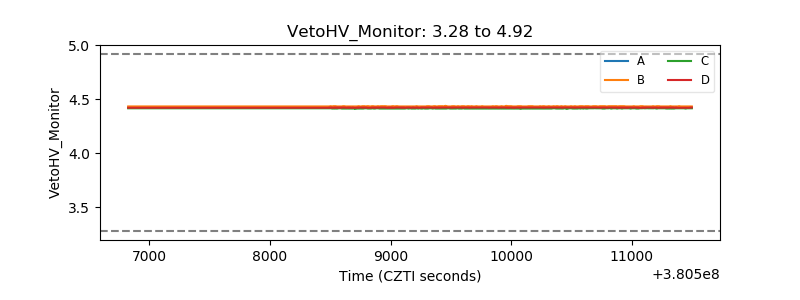 |
| Veto LLD | 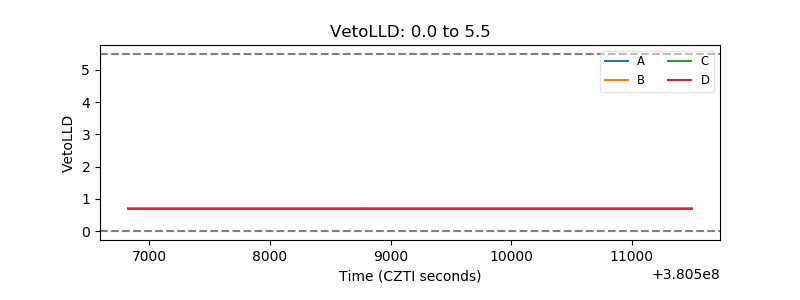 |
| Alpha Counter | 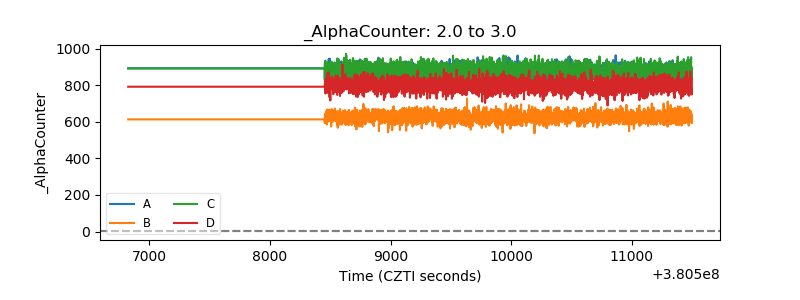 |
| _CPM_Rate | 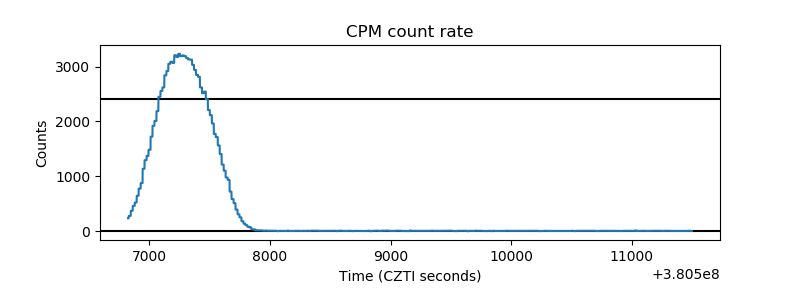 |
| CZT Counter | 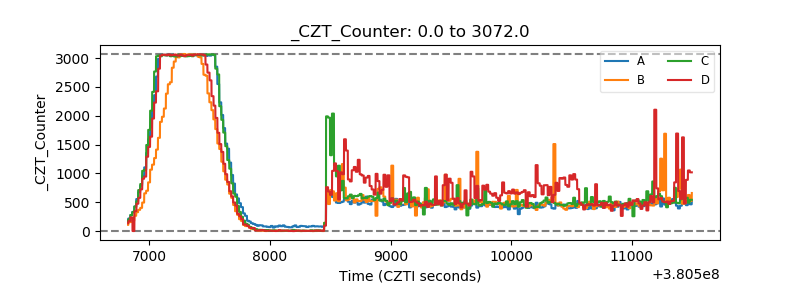 |
| +2.5 Volts monitor |  |
| +5 Volts monitor |  |
| _ROLL_ROT | 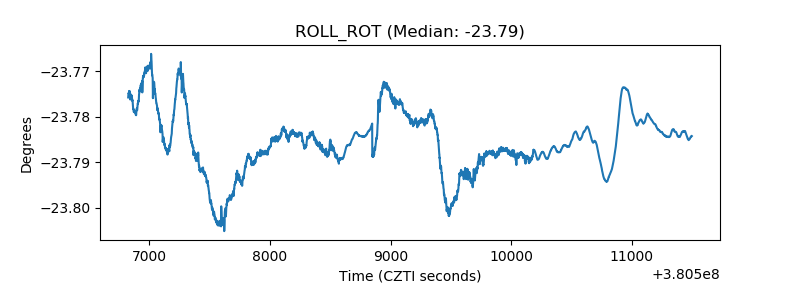 |
| _Roll_DEC |  |
| _Roll_RA | 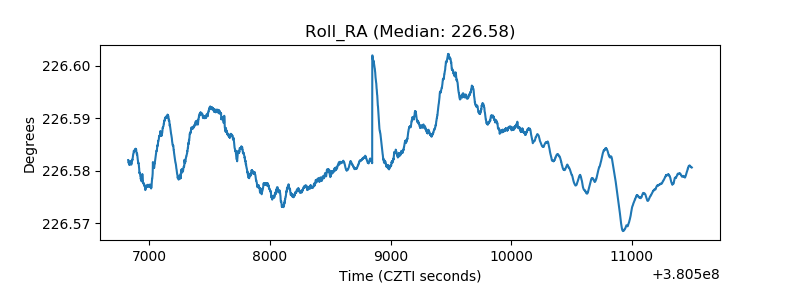 |
| Veto Counter | 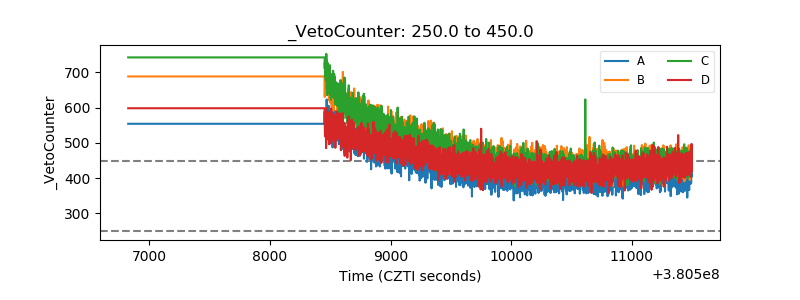 |