| Param | Original file | Final file |
|---|---|---|
| Filename | modeM0/AS1A11_047T03_9000004880cztM0_level2.fits | modeM0/AS1A11_047T03_9000004880cztM0_level2_quad_clean.evt |
| Size (bytes) | 328,916,160 | 291,421,440 |
| Size | 313.7 MB | 277.9 MB |
| Events in quadrant A | 2,114,848 | 1,858,941 |
| Events in quadrant B | 1,648,618 | 1,168,819 |
| Events in quadrant C | 1,965,494 | 1,705,639 |
| Events in quadrant D | 1,732,946 | 1,600,371 |
| Mode SS | |||
|---|---|---|---|
| Quadrant | BADHDUFLAG | Total packets | Discarded packets |
| A | 0 | 740 | 0 |
| B | 0 | 740 | 0 |
| C | 0 | 740 | 0 |
| D | 0 | 740 | 0 |
| Mode M9 | |||
|---|---|---|---|
| Quadrant | BADHDUFLAG | Total packets | Discarded packets |
| A | 0 | 134 | 0 |
| B | 0 | 134 | 0 |
| C | 0 | 134 | 0 |
| D | 0 | 134 | 0 |
| Mode M0 | |||
|---|---|---|---|
| Quadrant | BADHDUFLAG | Total packets | Discarded packets |
| A | 0 | 73236 | 0 |
| B | 0 | 186904 | 0 |
| C | 0 | 115581 | 0 |
| D | 0 | 109041 | 0 |
| Quadrant | Total seconds | Saturated seconds | Saturation percentage |
|---|---|---|---|
| A | 36263 | 39 | 0.107548% |
| B | 36263 | 15788 | 43.537490% |
| C | 36263 | 2858 | 7.881312% |
| D | 36263 | 1323 | 3.648347% |
Noise dominated data is calculated using 1-second bins in cleaned event files. If a bin has >2000 counts, and if more than 50% of those come from <1% of pixels, then it is considered to be noise-dominated and hence unusable.
| Quadrant | # 1 sec bins | Bins with >0 counts | Bins with >2000 counts | High rate bins dominated by noise | Noise dominated (total time) | Noise dominated (detector-on time) | Marked lightcurve |
|---|---|---|---|---|---|---|---|
| A | 49643 | 36263 | 0 | 0 | 0.00% | 0.00% |  |
| B | 49643 | 36251 | 0 | 0 | 0.00% | 0.00% |  |
| C | 49643 | 36239 | 0 | 0 | 0.00% | 0.00% | 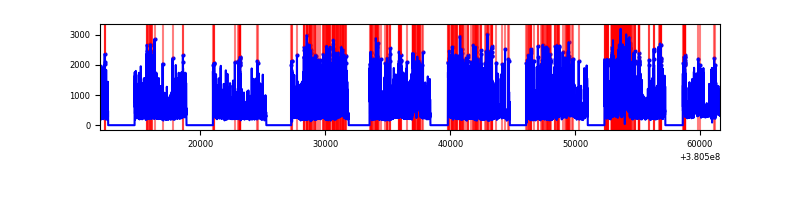 |
| D | 49643 | 36250 | 0 | 0 | 0.00% | 0.00% |  |
Top three noisy pixels from each quadrant. If the there are fewer than three noisy pixels in the level2.evt file, extra rows are filled as -1
| Pixel properties | Quadrant properties | ||||||
|---|---|---|---|---|---|---|---|
| Quadrant | DetID | PixID | Counts | Sigma | Mean | Median | Sigma |
| A | 7 | 110 | 1692 | 8.53 | 550 | 515 | 138.0 |
| A | 9 | 19 | 1690 | 8.52 | 550 | 515 | 138.0 |
| A | 0 | 29 | 1682 | 8.46 | 550 | 515 | 138.0 |
| B | 2 | 9 | 1425 | 11.73 | 436 | 416 | 86.0 |
| B | 3 | 80 | 1256 | 9.77 | 436 | 416 | 86.0 |
| B | 2 | 8 | 1181 | 8.89 | 436 | 416 | 86.0 |
| C | 1 | 81 | 1638 | 8.54 | 520 | 485 | 135.0 |
| C | 1 | 80 | 1622 | 8.42 | 520 | 485 | 135.0 |
| C | 3 | 158 | 1345 | 6.37 | 520 | 485 | 135.0 |
| D | 3 | 14 | 1291 | 6.26 | 496 | 451 | 134.1 |
| D | 4 | 160 | 1287 | 6.23 | 496 | 451 | 134.1 |
| D | 10 | 113 | 1268 | 6.09 | 496 | 451 | 134.1 |
Histogram calculated using DETX and DETY for each event in the final _common_clean file
| Quadrant A | 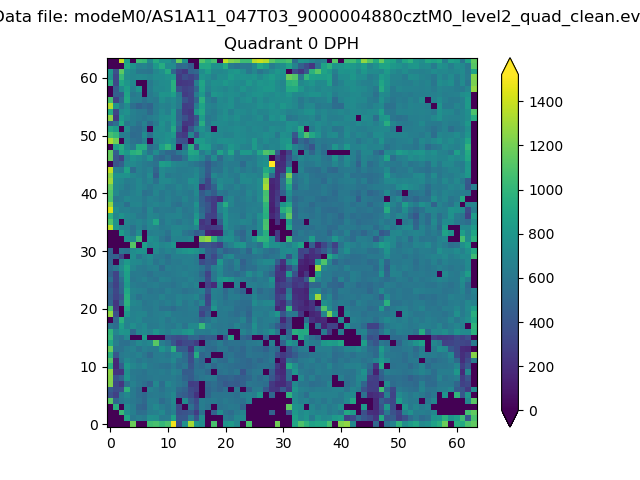 |
 |
Quadrant B |
|---|---|---|---|
| Quadrant D |  |
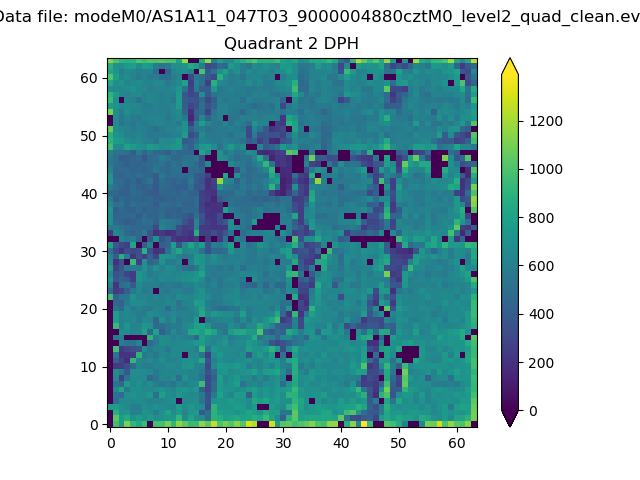 |
Quadrant C |
| Plot type | Count rate plots | Images |
|---|---|---|
| Comparison with Poisson distribution Blue bars denote a histogram of data divided into 1 sec bins. Red curve is a Poisson curve with rate = median count rate of data. |
 |
 |
| Quadrant-wise count rates Data is divided into 100 sec bins |
 |
|
| Module-wise count rates for Quadrant A Data is divided into 100 sec bins |
 |
 |
| Module-wise count rates for Quadrant B Data is divided into 100 sec bins |
 |
 |
| Module-wise count rates for Quadrant C Data is divided into 100 sec bins |
 |
 |
| Module-wise count rates for Quadrant D Data is divided into 100 sec bins |
 |
 |
| Parameter | Plot |
|---|---|
| CZT HV Monitor |  |
| D_VDD |  |
| Temperature 1 |  |
| Veto HV Monitor |  |
| Veto LLD |  |
| Alpha Counter |  |
| _CPM_Rate |  |
| CZT Counter |  |
| +2.5 Volts monitor |  |
| +5 Volts monitor |  |
| _ROLL_ROT |  |
| _Roll_DEC |  |
| _Roll_RA |  |
| Veto Counter | 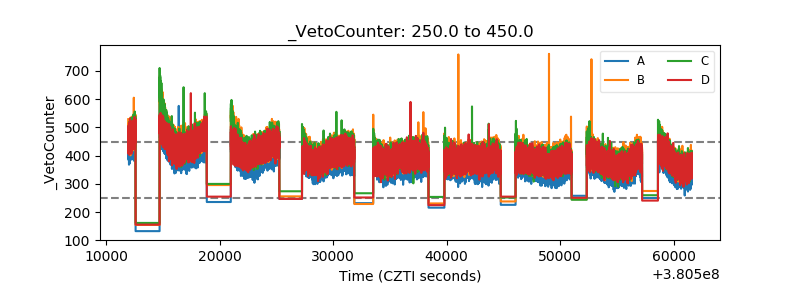 |