| Param | Original file | Final file |
|---|---|---|
| Filename | modeM0/AS1A11_047T03_9000004880_34162cztM0_level2.evt | modeM0/AS1A11_047T03_9000004880_34162cztM0_level2_quad_clean.evt |
| Size (bytes) | 171,432,000 | 25,009,920 |
| Size | 163.5 MB | 23.9 MB |
| Events in quadrant A | 881,734 | 160,205 |
| Events in quadrant B | 1,133,037 | 164,258 |
| Events in quadrant C | 1,263,082 | 154,373 |
| Events in quadrant D | 1,792,038 | 148,894 |
| Mode SS | |||
|---|---|---|---|
| Quadrant | BADHDUFLAG | Total packets | Discarded packets |
| A | 0 | 38 | 0 |
| B | 0 | 38 | 0 |
| C | 0 | 38 | 0 |
| D | 0 | 38 | 0 |
| Mode M9 | |||
|---|---|---|---|
| Quadrant | BADHDUFLAG | Total packets | Discarded packets |
| A | 0 | 21 | 0 |
| B | 0 | 21 | 0 |
| C | 0 | 21 | 0 |
| D | 0 | 21 | 0 |
| Mode M0 | |||
|---|---|---|---|
| Quadrant | BADHDUFLAG | Total packets | Discarded packets |
| A | 0 | 3643 | 2 |
| B | 0 | 4466 | 1 |
| C | 0 | 4843 | 1 |
| D | 0 | 6478 | 1 |
| Quadrant | Total seconds | Saturated seconds | Saturation percentage |
|---|---|---|---|
| A | 1758 | 1 | 0.056883% |
| B | 1758 | 34 | 1.934016% |
| C | 1758 | 92 | 5.233220% |
| D | 1758 | 393 | 22.354949% |
Noise dominated data is calculated using 1-second bins in cleaned event files. If a bin has >2000 counts, and if more than 50% of those come from <1% of pixels, then it is considered to be noise-dominated and hence unusable.
| Quadrant | # 1 sec bins | Bins with >0 counts | Bins with >2000 counts | High rate bins dominated by noise | Noise dominated (total time) | Noise dominated (detector-on time) | Marked lightcurve |
|---|---|---|---|---|---|---|---|
| A | 3880 | 1759 | 0 | 0 | 0.00% | 0.00% | 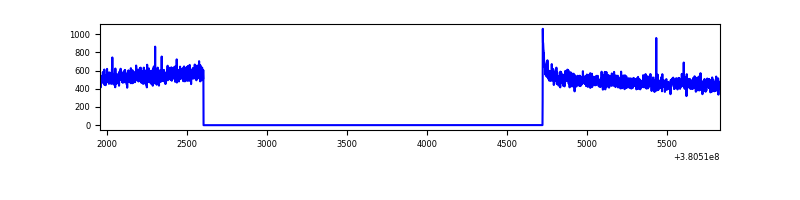 |
| B | 3880 | 1758 | 19 | 19 | 0.49% | 1.08% | 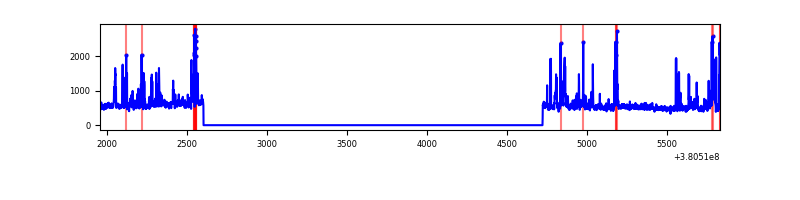 |
| C | 3880 | 1758 | 71 | 71 | 1.83% | 4.04% | 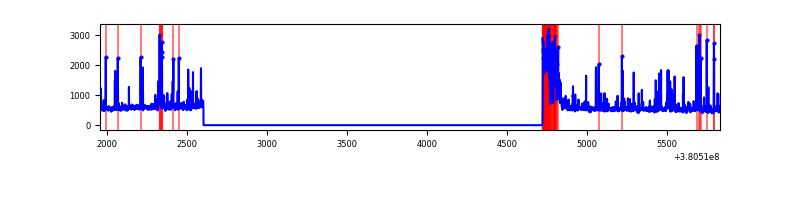 |
| D | 3880 | 1758 | 361 | 361 | 9.30% | 20.53% | 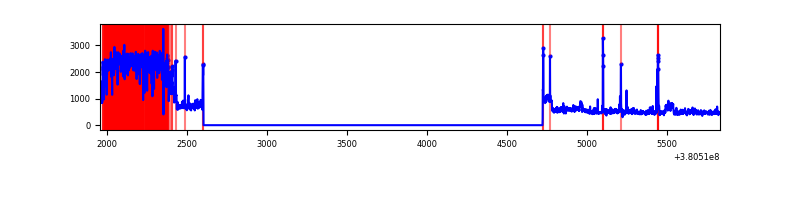 |
Top three noisy pixels from each quadrant. If the there are fewer than three noisy pixels in the level2.evt file, extra rows are filled as -1
| Pixel properties | Quadrant properties | ||||||
|---|---|---|---|---|---|---|---|
| Quadrant | DetID | PixID | Counts | Sigma | Mean | Median | Sigma |
| A | 10 | 83 | 9929 | 208.04 | 224 | 221 | 46.7 |
| A | 13 | 254 | 3390 | 67.91 | 224 | 221 | 46.7 |
| A | 13 | 6 | 3212 | 64.1 | 224 | 221 | 46.7 |
| B | 5 | 255 | 98921 | 2215.79 | 224 | 218 | 44.5 |
| B | 5 | 172 | 81827 | 1832.04 | 224 | 218 | 44.5 |
| B | 0 | 229 | 25757 | 573.33 | 224 | 218 | 44.5 |
| C | 0 | 10 | 315225 | 6210.08 | 214 | 215 | 50.7 |
| C | 15 | 214 | 76290 | 1499.74 | 214 | 215 | 50.7 |
| C | 6 | 96 | 30880 | 604.53 | 214 | 215 | 50.7 |
| D | 10 | 118 | 667016 | 13233.31 | 197 | 191 | 50.4 |
| D | 8 | 195 | 272297 | 5400.01 | 197 | 191 | 50.4 |
| D | 13 | 249 | 29622 | 584.07 | 197 | 191 | 50.4 |
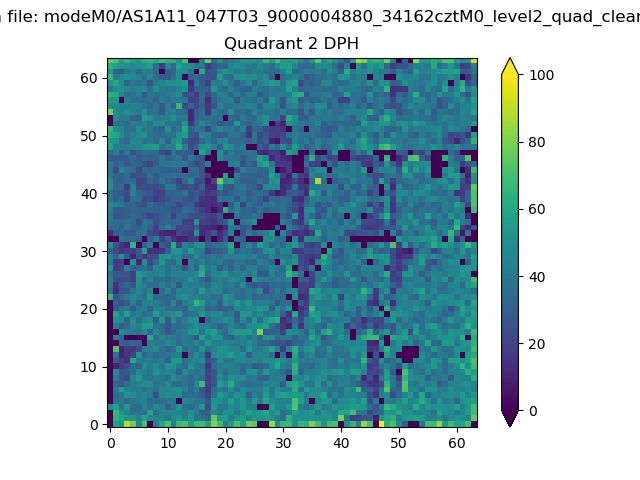
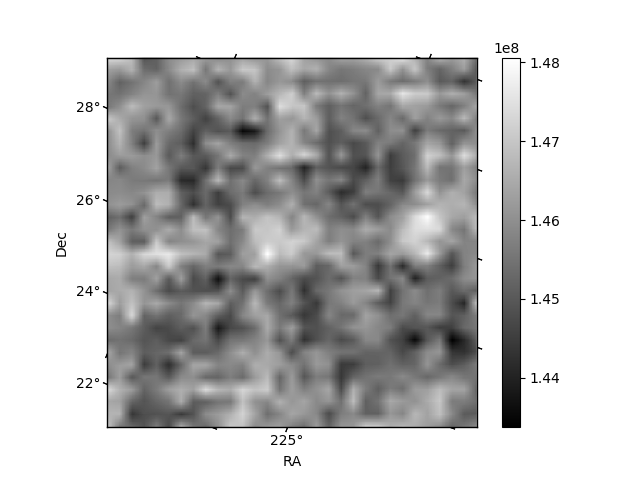
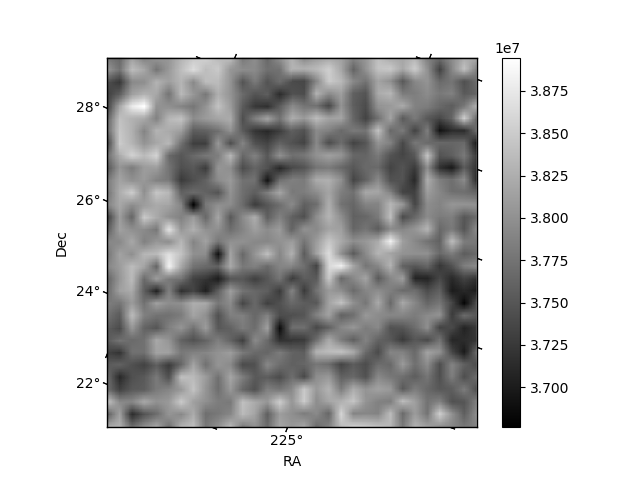
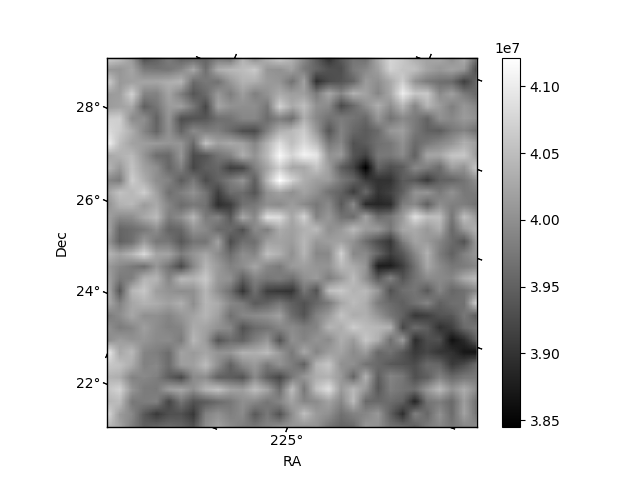
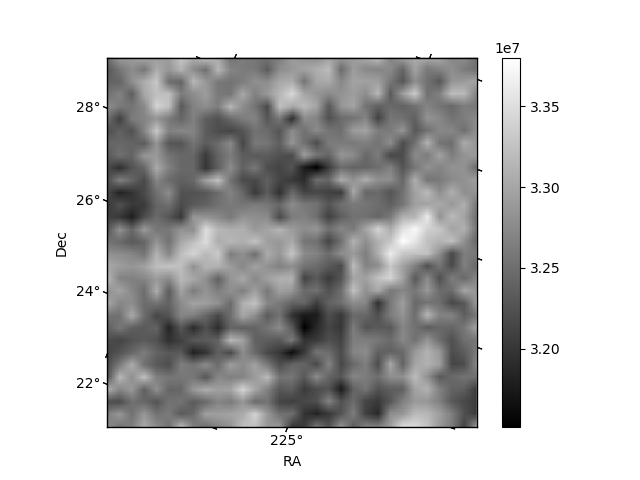
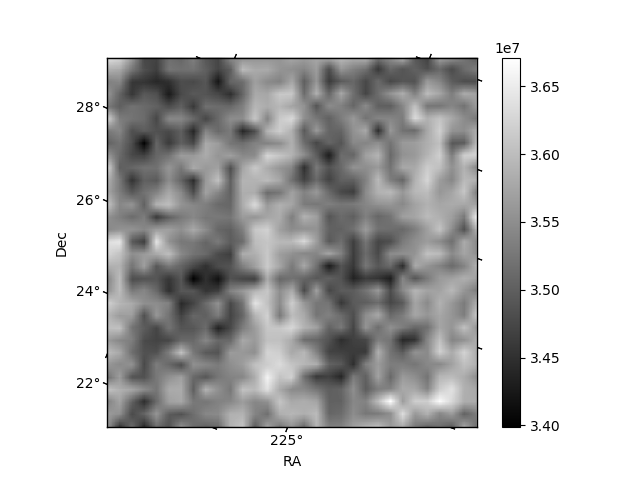
Histogram calculated using DETX and DETY for each event in the final _common_clean file
| Quadrant A | 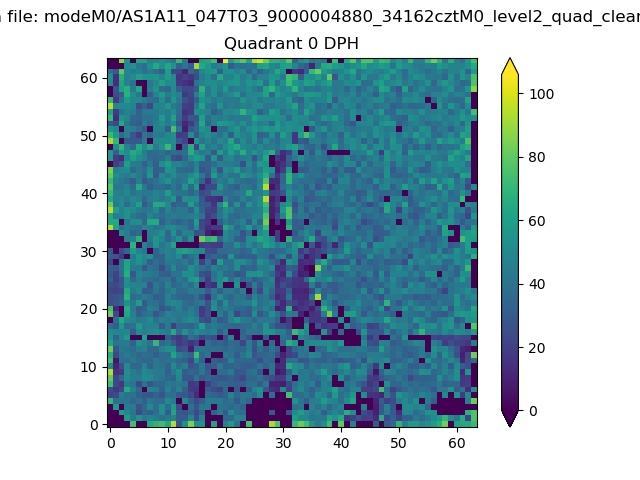 |
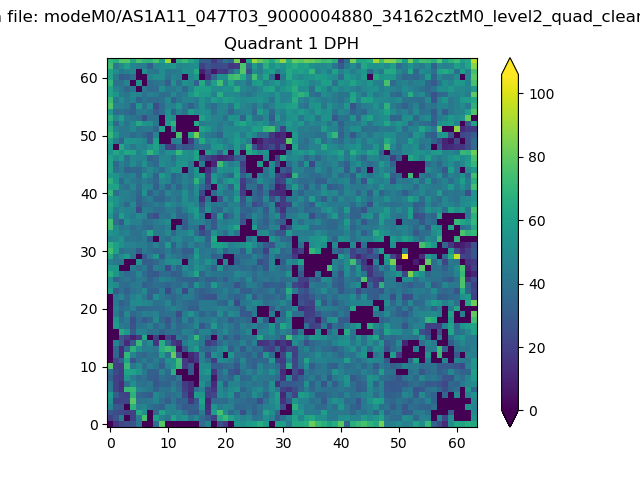 |
Quadrant B |
|---|---|---|---|
| Quadrant D | 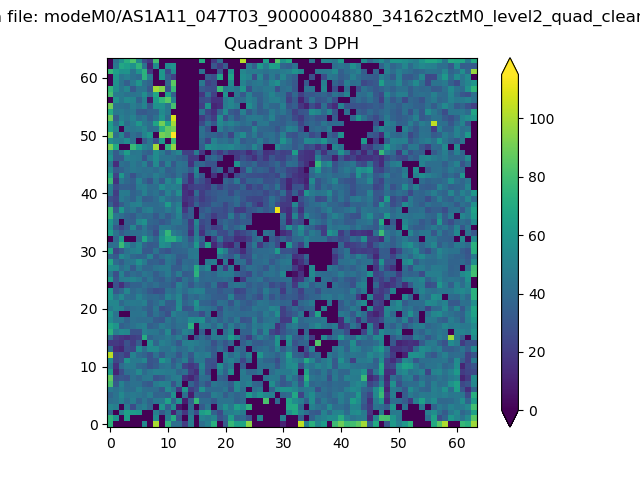 |
 |
Quadrant C |
| Plot type | Count rate plots | Images |
|---|---|---|
| Comparison with Poisson distribution Blue bars denote a histogram of data divided into 1 sec bins. Red curve is a Poisson curve with rate = median count rate of data. |
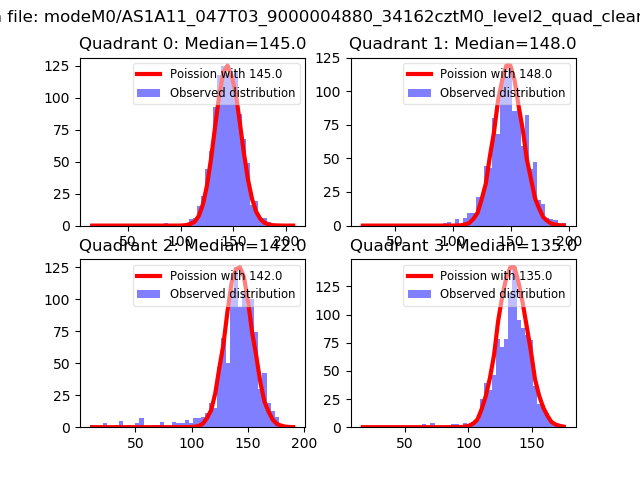 |
 |
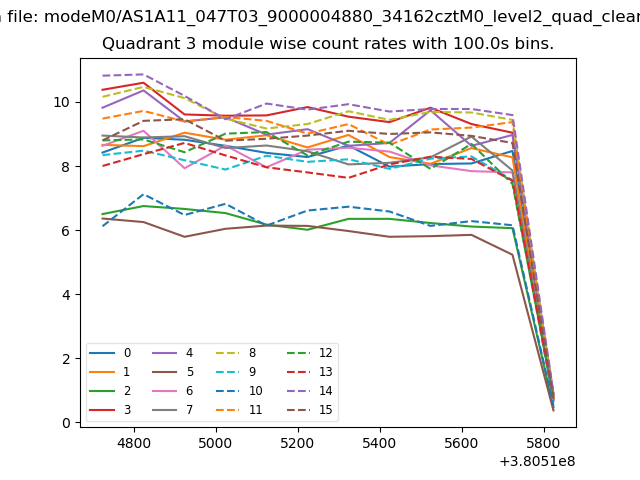
| Quadrant-wise count rates Data is divided into 100 sec bins |
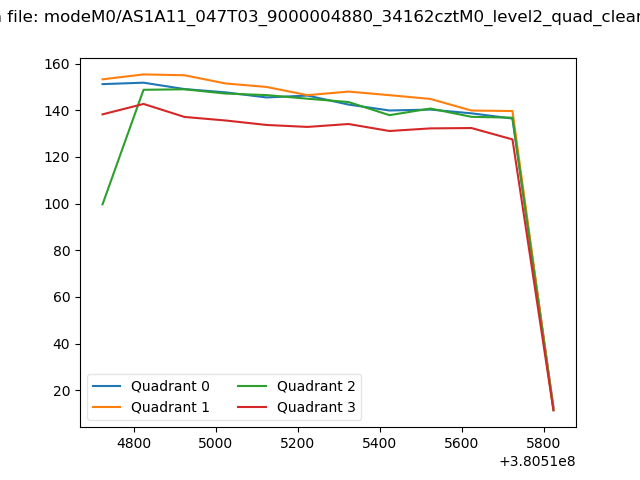 |
|
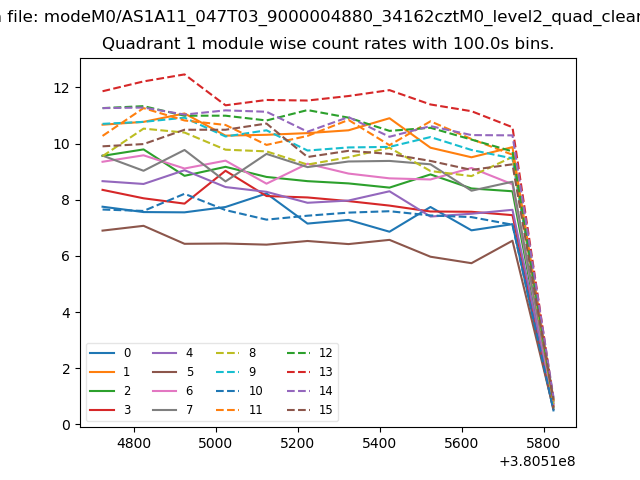
| Module-wise count rates for Quadrant A Data is divided into 100 sec bins |
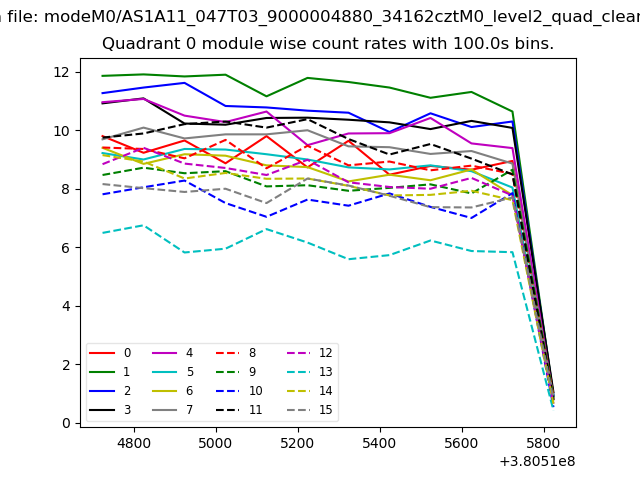 |
 |
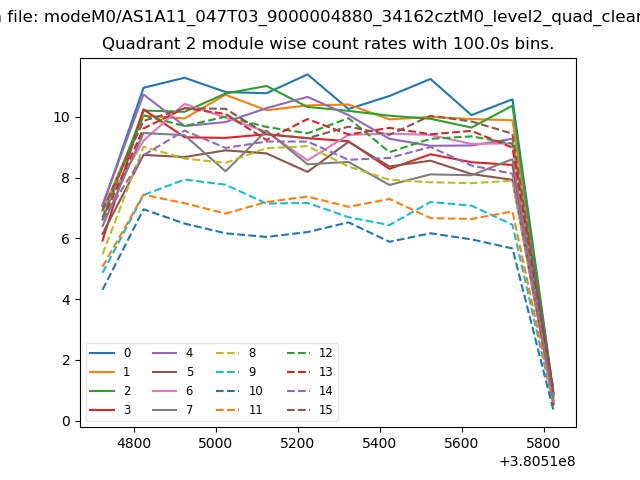
| Module-wise count rates for Quadrant B Data is divided into 100 sec bins |
 |
 |
| Module-wise count rates for Quadrant C Data is divided into 100 sec bins |
 |
 |
| Module-wise count rates for Quadrant D Data is divided into 100 sec bins |
 |
 |
| Parameter | Plot |
|---|---|
| CZT HV Monitor | 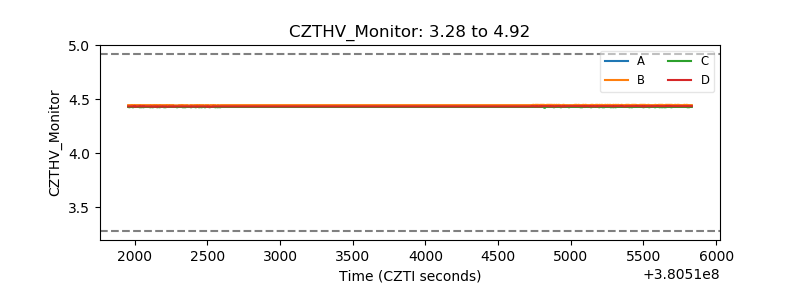 |
| D_VDD | 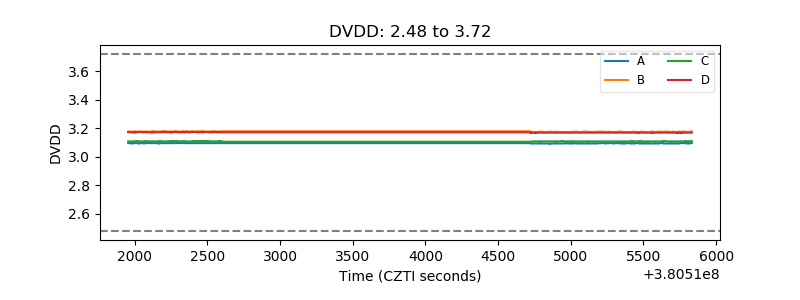 |
| Temperature 1 | 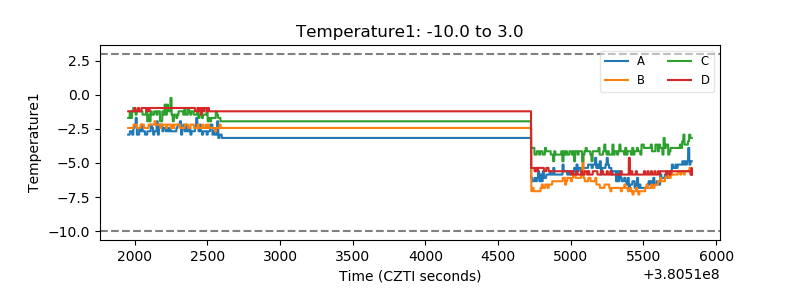 |
| Veto HV Monitor | 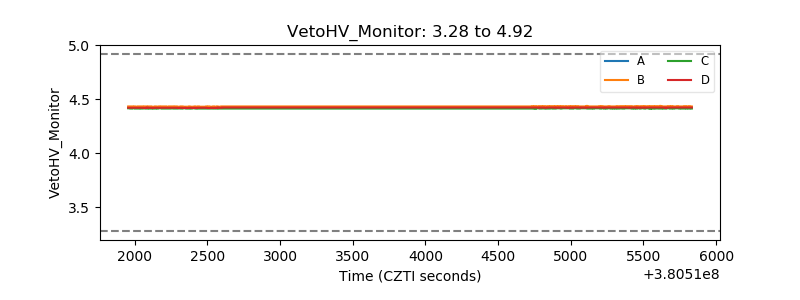 |
| Veto LLD | 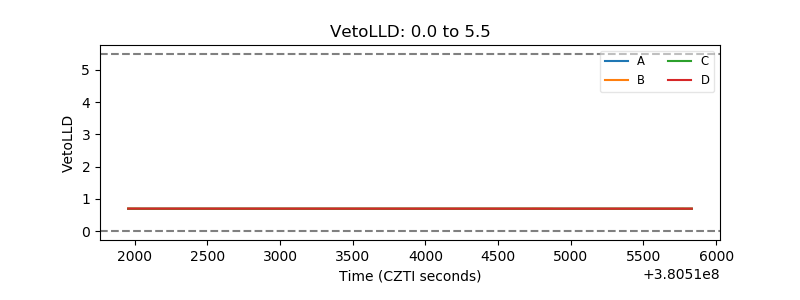 |
| Alpha Counter | 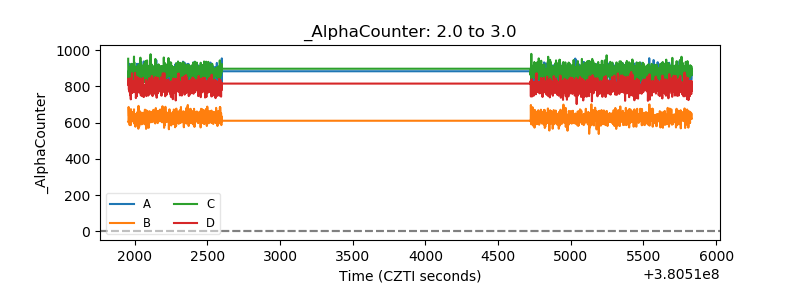 |
| _CPM_Rate | 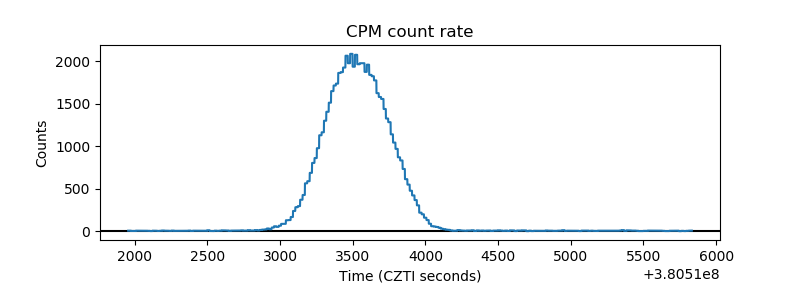 |
| CZT Counter | 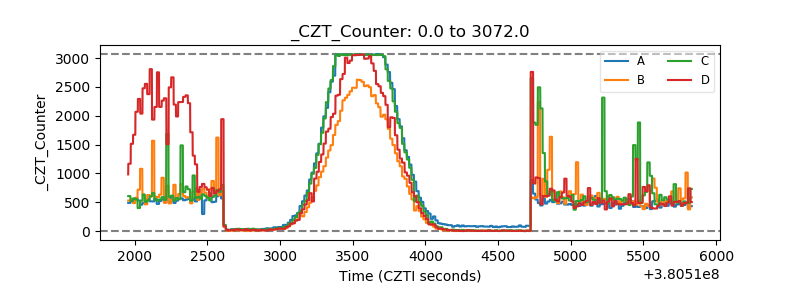 |
| +2.5 Volts monitor |  |
| +5 Volts monitor | 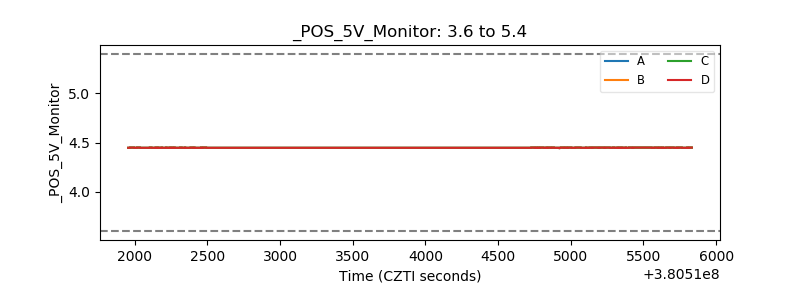 |
| _ROLL_ROT | 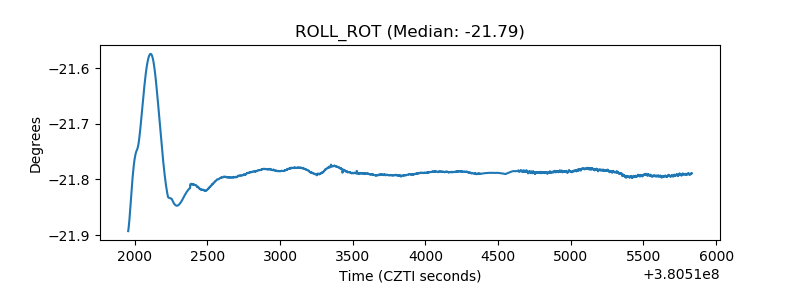 |
| _Roll_DEC | 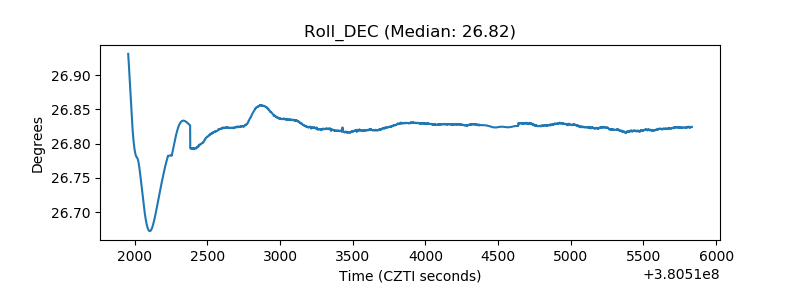 |
| _Roll_RA | 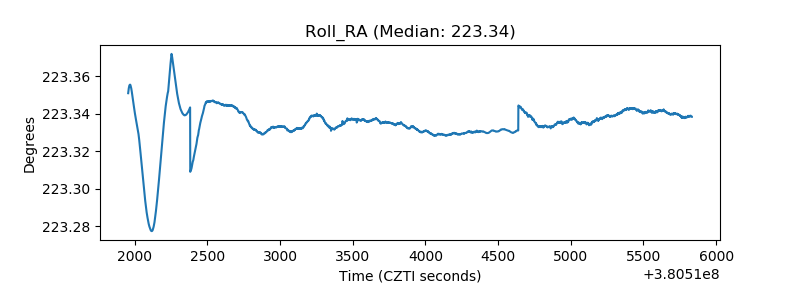 |
| Veto Counter | 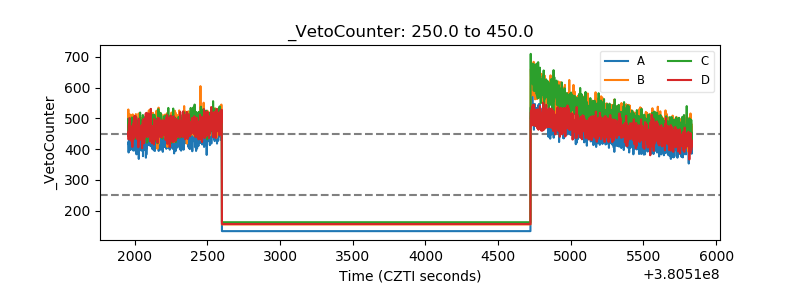 |