| Param | Original file | Final file |
|---|---|---|
| Filename | modeM0/AS1A11_047T03_9000004880_34163cztM0_level2.evt | modeM0/AS1A11_047T03_9000004880_34163cztM0_level2_quad_clean.evt |
| Size (bytes) | 429,969,600 | 77,028,480 |
| Size | 410.1 MB | 73.5 MB |
| Events in quadrant A | 2,444,939 | 501,554 |
| Events in quadrant B | 3,215,874 | 512,457 |
| Events in quadrant C | 3,658,909 | 487,133 |
| Events in quadrant D | 3,349,693 | 467,856 |
| Mode SS | |||
|---|---|---|---|
| Quadrant | BADHDUFLAG | Total packets | Discarded packets |
| A | 0 | 108 | 0 |
| B | 0 | 108 | 0 |
| C | 0 | 108 | 0 |
| D | 0 | 108 | 0 |
| Mode M9 | |||
|---|---|---|---|
| Quadrant | BADHDUFLAG | Total packets | Discarded packets |
| A | 0 | 38 | 0 |
| B | 0 | 38 | 0 |
| C | 0 | 38 | 0 |
| D | 0 | 39 | 0 |
| Mode M0 | |||
|---|---|---|---|
| Quadrant | BADHDUFLAG | Total packets | Discarded packets |
| A | 0 | 10485 | 3 |
| B | 0 | 12868 | 2 |
| C | 0 | 14130 | 2 |
| D | 0 | 13495 | 2 |
| Quadrant | Total seconds | Saturated seconds | Saturation percentage |
|---|---|---|---|
| A | 5182 | 7 | 0.135083% |
| B | 5182 | 96 | 1.852567% |
| C | 5182 | 197 | 3.801621% |
| D | 5182 | 66 | 1.273640% |
Noise dominated data is calculated using 1-second bins in cleaned event files. If a bin has >2000 counts, and if more than 50% of those come from <1% of pixels, then it is considered to be noise-dominated and hence unusable.
| Quadrant | # 1 sec bins | Bins with >0 counts | Bins with >2000 counts | High rate bins dominated by noise | Noise dominated (total time) | Noise dominated (detector-on time) | Marked lightcurve |
|---|---|---|---|---|---|---|---|
| A | 7304 | 5183 | 0 | 0 | 0.00% | 0.00% | 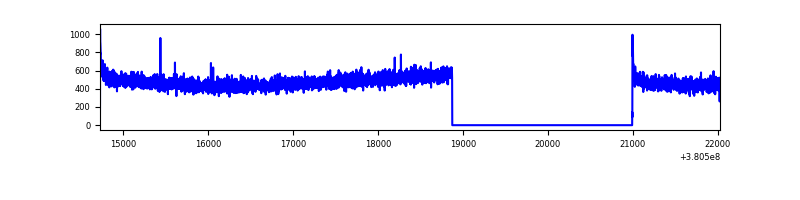 |
| B | 7303 | 5182 | 53 | 53 | 0.73% | 1.02% | 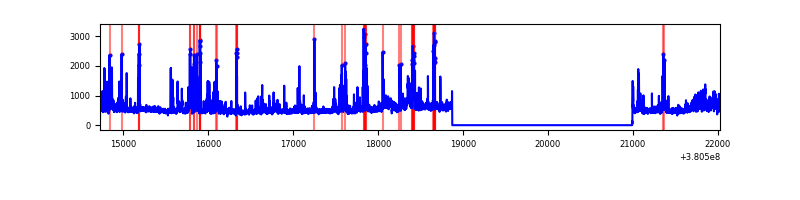 |
| C | 7303 | 5182 | 167 | 167 | 2.29% | 3.22% |  |
| D | 7303 | 5182 | 49 | 49 | 0.67% | 0.95% | 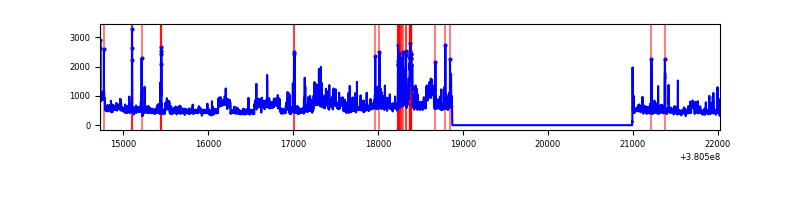 |
Top three noisy pixels from each quadrant. If the there are fewer than three noisy pixels in the level2.evt file, extra rows are filled as -1
| Pixel properties | Quadrant properties | ||||||
|---|---|---|---|---|---|---|---|
| Quadrant | DetID | PixID | Counts | Sigma | Mean | Median | Sigma |
| A | 10 | 83 | 20857 | 160.96 | 625 | 613 | 125.8 |
| A | 13 | 6 | 9670 | 72.01 | 625 | 613 | 125.8 |
| A | 13 | 254 | 9287 | 68.97 | 625 | 613 | 125.8 |
| B | 5 | 172 | 256585 | 2174.6 | 621 | 607 | 117.7 |
| B | 5 | 255 | 222390 | 1884.1 | 621 | 607 | 117.7 |
| B | 5 | 31 | 91750 | 774.28 | 621 | 607 | 117.7 |
| C | 0 | 10 | 994433 | 7197.01 | 598 | 604 | 138.1 |
| C | 15 | 214 | 221192 | 1597.43 | 598 | 604 | 138.1 |
| C | 0 | 239 | 76332 | 548.4 | 598 | 604 | 138.1 |
| D | 8 | 195 | 627737 | 4283.88 | 598 | 581 | 146.4 |
| D | 13 | 249 | 124852 | 848.85 | 598 | 581 | 146.4 |
| D | 12 | 218 | 98149 | 666.45 | 598 | 581 | 146.4 |
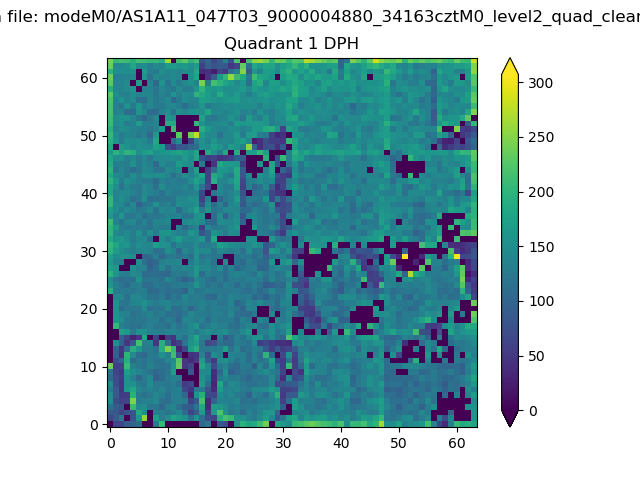
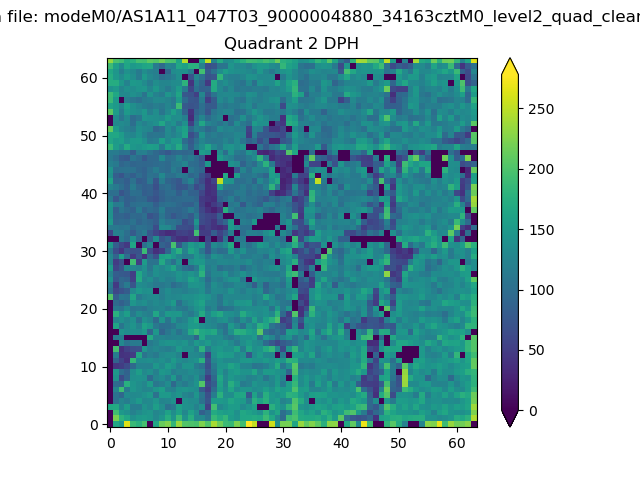
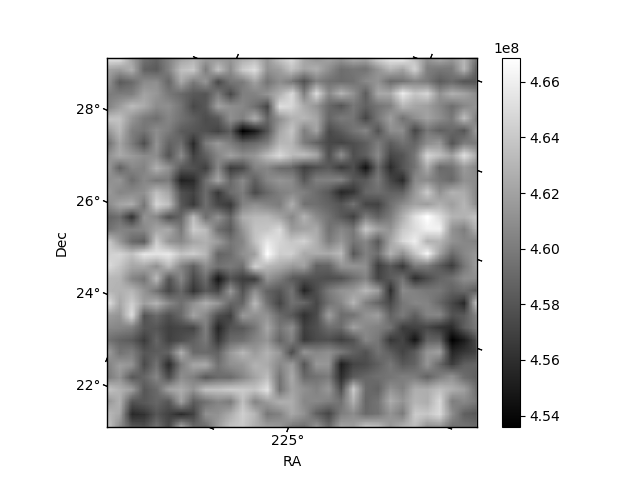
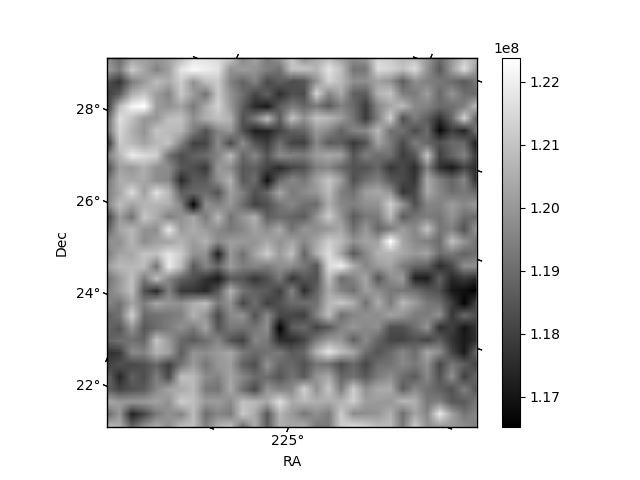
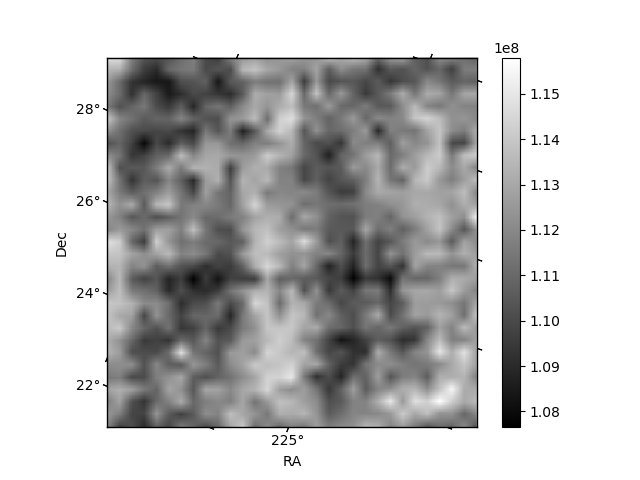
Histogram calculated using DETX and DETY for each event in the final _common_clean file
| Quadrant A | 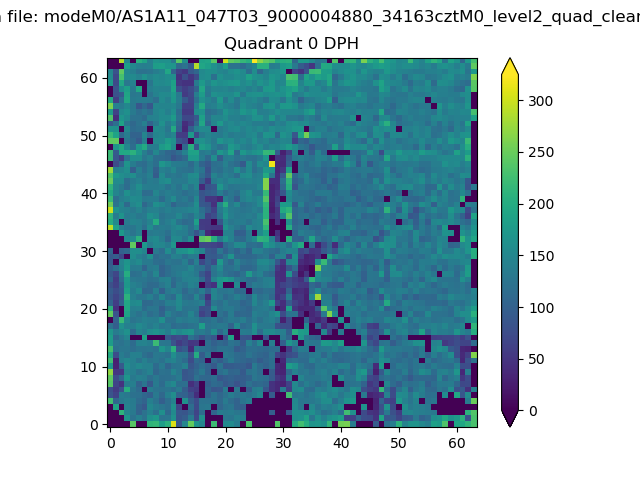 |
 |
Quadrant B |
|---|---|---|---|
| Quadrant D | 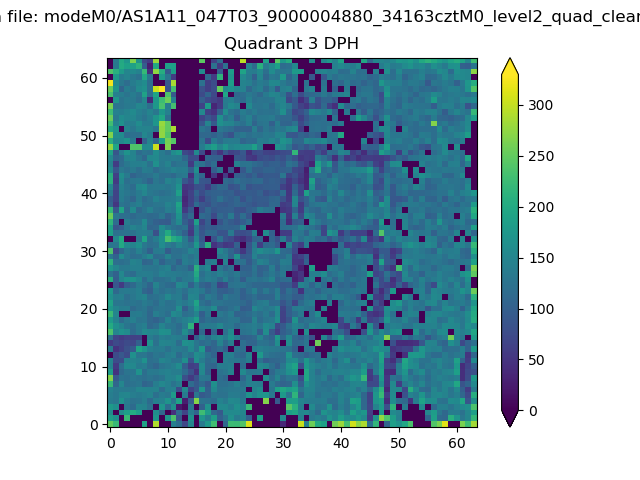 |
 |
Quadrant C |
| Plot type | Count rate plots | Images |
|---|---|---|
| Comparison with Poisson distribution Blue bars denote a histogram of data divided into 1 sec bins. Red curve is a Poisson curve with rate = median count rate of data. |
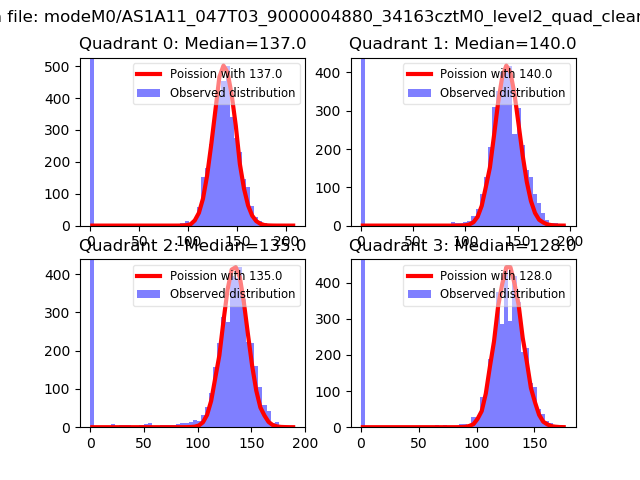 |
 |
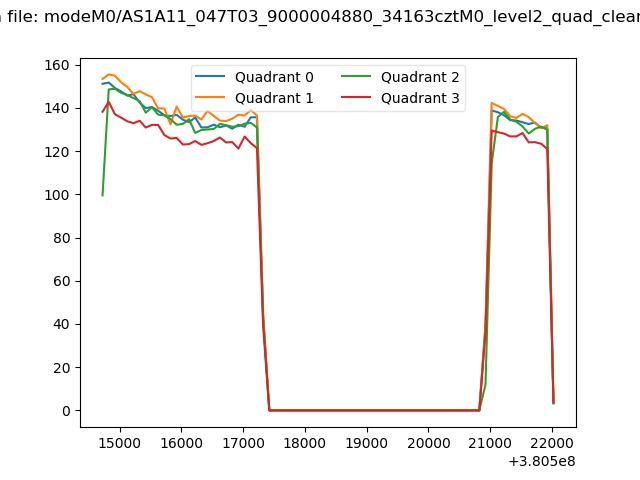
| Quadrant-wise count rates Data is divided into 100 sec bins |
 |
|
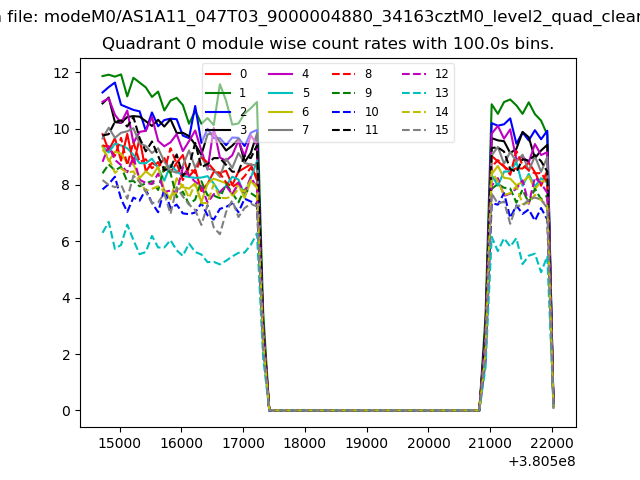
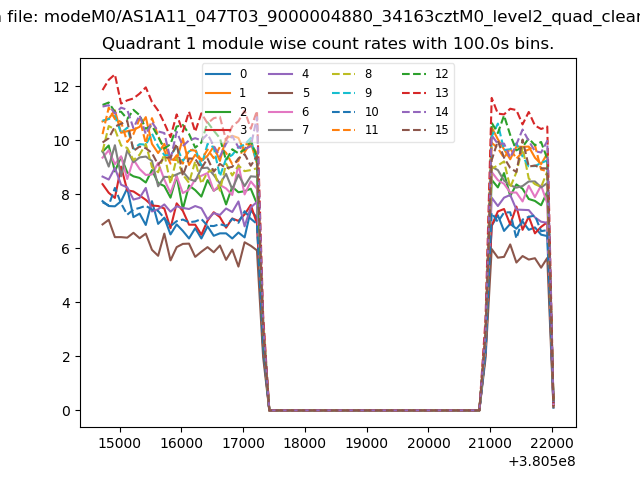
| Module-wise count rates for Quadrant A Data is divided into 100 sec bins |
 |
 |
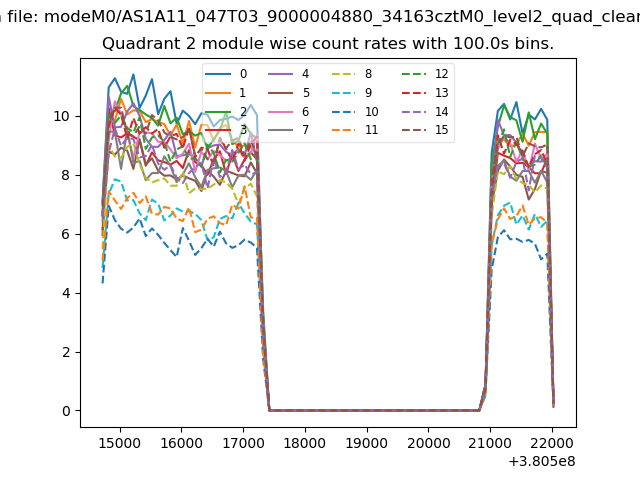
| Module-wise count rates for Quadrant B Data is divided into 100 sec bins |
 |
 |
| Module-wise count rates for Quadrant C Data is divided into 100 sec bins |
 |
 |
| Module-wise count rates for Quadrant D Data is divided into 100 sec bins |
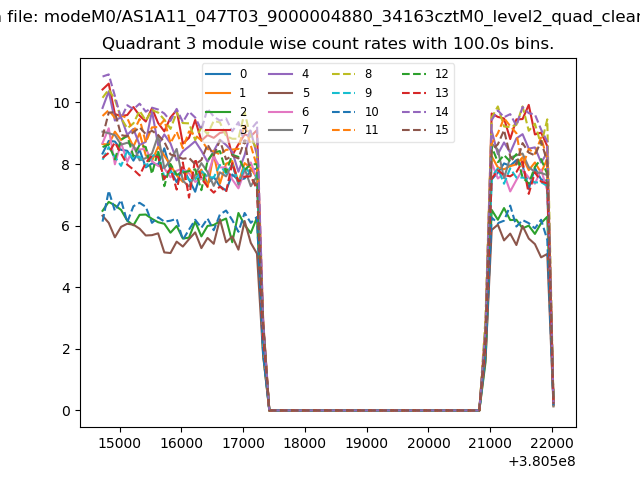 |
 |
| Parameter | Plot |
|---|---|
| CZT HV Monitor | 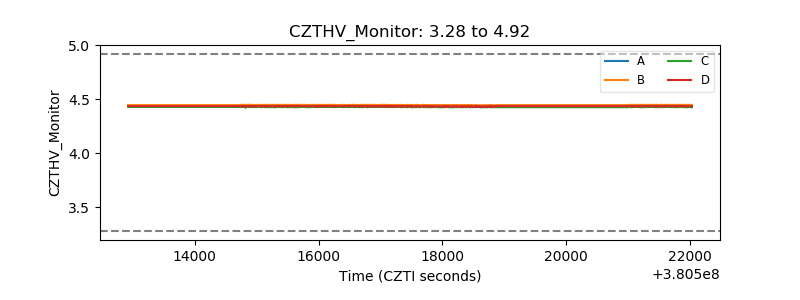 |
| D_VDD | 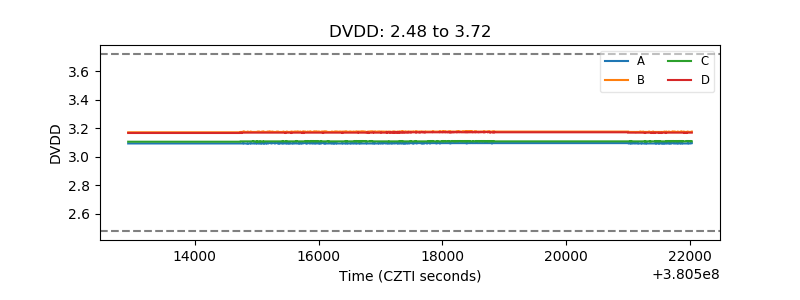 |
| Temperature 1 | 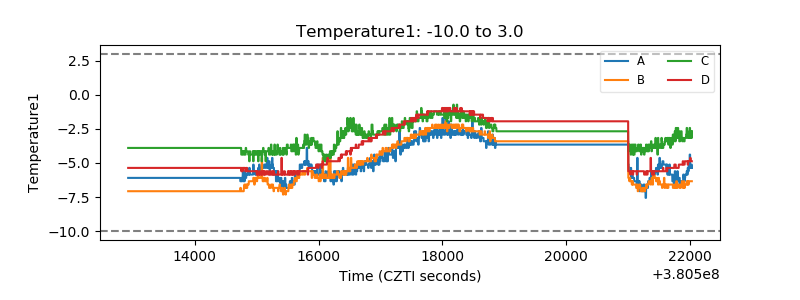 |
| Veto HV Monitor | 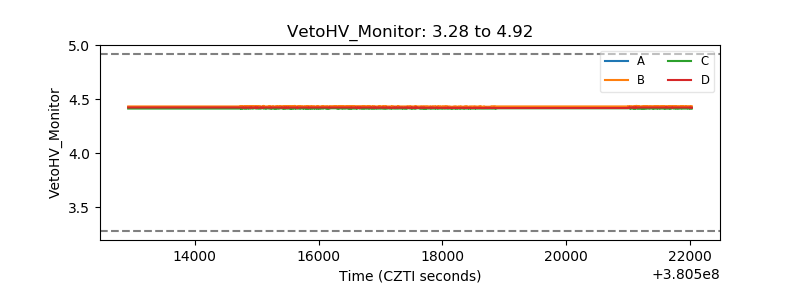 |
| Veto LLD | 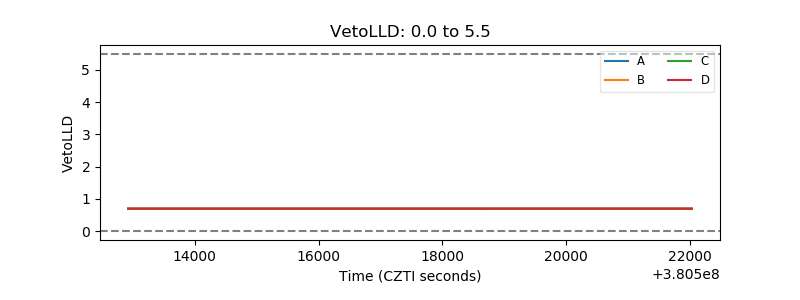 |
| Alpha Counter | 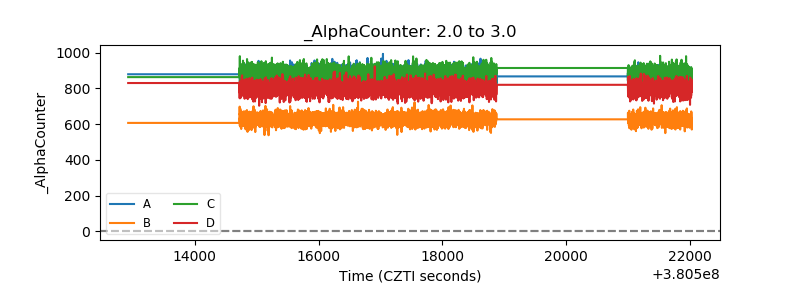 |
| _CPM_Rate | 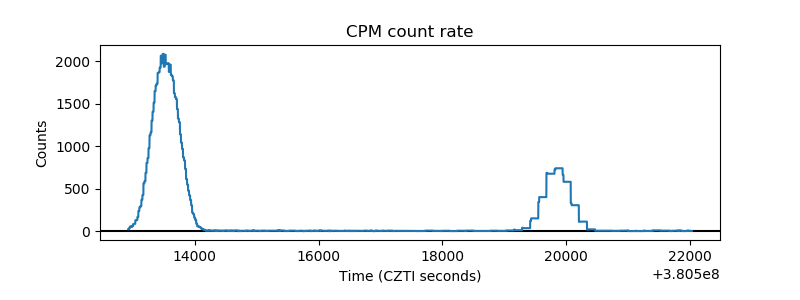 |
| CZT Counter | 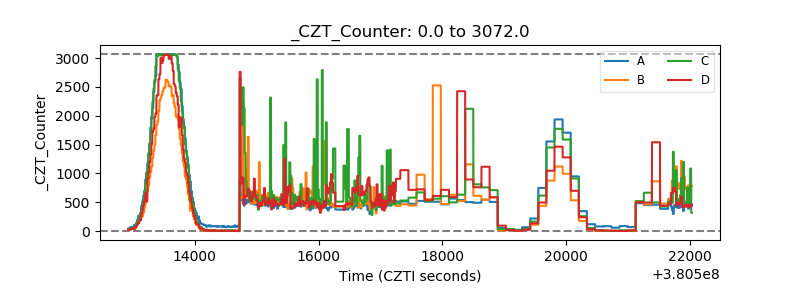 |
| +2.5 Volts monitor | 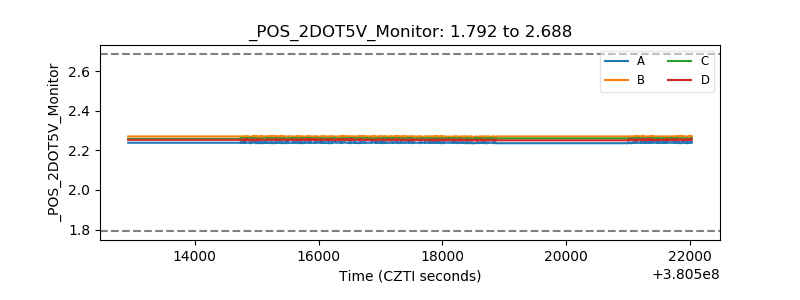 |
| +5 Volts monitor | 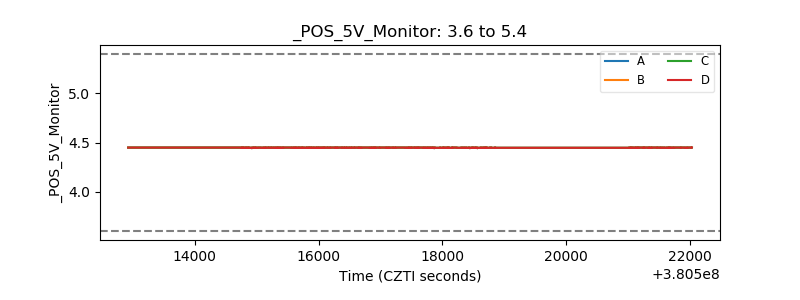 |
| _ROLL_ROT | 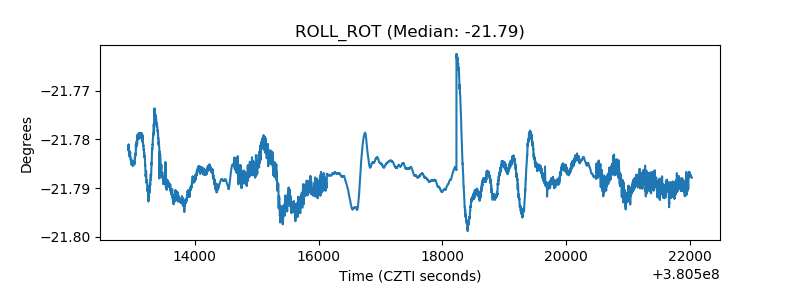 |
| _Roll_DEC |  |
| _Roll_RA | 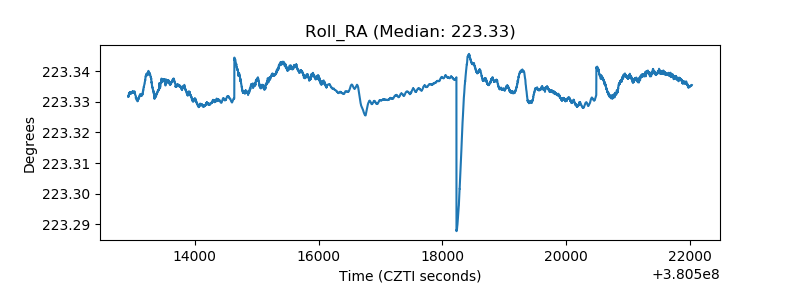 |
| Veto Counter | 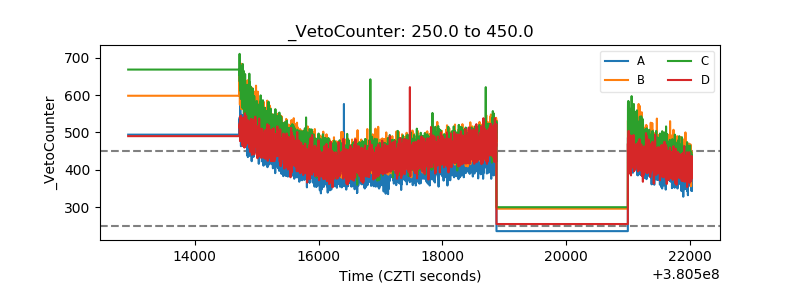 |