| Param | Original file | Final file |
|---|---|---|
| Filename | modeM0/AS1A11_047T03_9000004880_34164cztM0_level2.evt | modeM0/AS1A11_047T03_9000004880_34164cztM0_level2_quad_clean.evt |
| Size (bytes) | 546,814,080 | 64,607,040 |
| Size | 521.5 MB | 61.6 MB |
| Events in quadrant A | 2,426,954 | 410,247 |
| Events in quadrant B | 6,395,843 | 393,746 |
| Events in quadrant C | 3,696,791 | 396,625 |
| Events in quadrant D | 3,684,830 | 387,206 |
| Mode SS | |||
|---|---|---|---|
| Quadrant | BADHDUFLAG | Total packets | Discarded packets |
| A | 0 | 108 | 0 |
| B | 0 | 108 | 0 |
| C | 0 | 108 | 0 |
| D | 0 | 108 | 0 |
| Mode M9 | |||
|---|---|---|---|
| Quadrant | BADHDUFLAG | Total packets | Discarded packets |
| A | 0 | 28 | 0 |
| B | 0 | 28 | 0 |
| C | 0 | 28 | 0 |
| D | 0 | 29 | 0 |
| Mode M0 | |||
|---|---|---|---|
| Quadrant | BADHDUFLAG | Total packets | Discarded packets |
| A | 0 | 10582 | 3 |
| B | 0 | 22571 | 2 |
| C | 0 | 14331 | 2 |
| D | 0 | 14425 | 2 |
| Quadrant | Total seconds | Saturated seconds | Saturation percentage |
|---|---|---|---|
| A | 5251 | 9 | 0.171396% |
| B | 5251 | 1260 | 23.995429% |
| C | 5251 | 198 | 3.770710% |
| D | 5251 | 88 | 1.675871% |
Noise dominated data is calculated using 1-second bins in cleaned event files. If a bin has >2000 counts, and if more than 50% of those come from <1% of pixels, then it is considered to be noise-dominated and hence unusable.
| Quadrant | # 1 sec bins | Bins with >0 counts | Bins with >2000 counts | High rate bins dominated by noise | Noise dominated (total time) | Noise dominated (detector-on time) | Marked lightcurve |
|---|---|---|---|---|---|---|---|
| A | 7254 | 5252 | 0 | 0 | 0.00% | 0.00% | 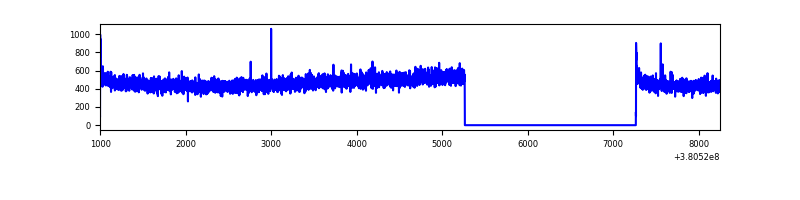 |
| B | 7254 | 5252 | 1095 | 1095 | 15.10% | 20.85% | 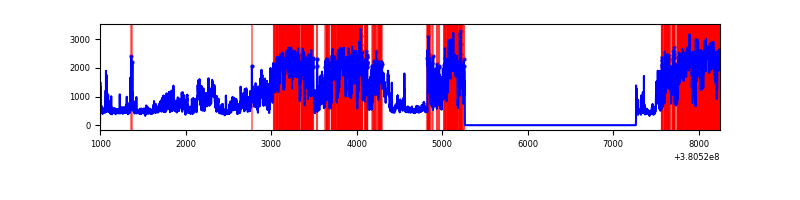 |
| C | 7254 | 5252 | 161 | 161 | 2.22% | 3.07% | 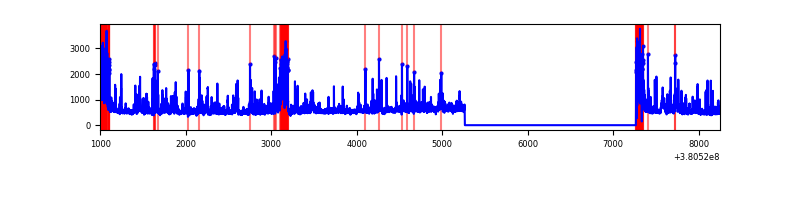 |
| D | 7254 | 5252 | 65 | 65 | 0.90% | 1.24% | 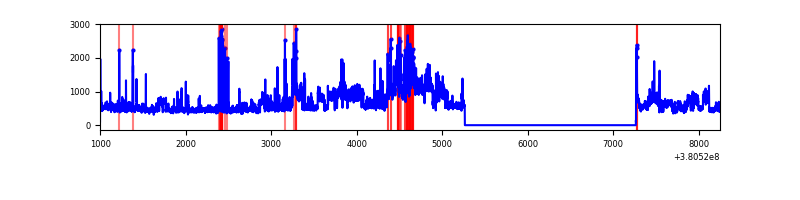 |
Top three noisy pixels from each quadrant. If the there are fewer than three noisy pixels in the level2.evt file, extra rows are filled as -1
| Pixel properties | Quadrant properties | ||||||
|---|---|---|---|---|---|---|---|
| Quadrant | DetID | PixID | Counts | Sigma | Mean | Median | Sigma |
| A | 10 | 83 | 21285 | 164.96 | 620 | 609 | 125.3 |
| A | 13 | 254 | 9913 | 74.23 | 620 | 609 | 125.3 |
| A | 13 | 6 | 7613 | 55.88 | 620 | 609 | 125.3 |
| B | 5 | 31 | 2457063 | 21978.77 | 577 | 561 | 111.8 |
| B | 5 | 15 | 1009156 | 9024.08 | 577 | 561 | 111.8 |
| B | 5 | 172 | 455767 | 4072.81 | 577 | 561 | 111.8 |
| C | 0 | 10 | 824409 | 6010.5 | 592 | 597 | 137.1 |
| C | 15 | 214 | 224359 | 1632.56 | 592 | 597 | 137.1 |
| C | 15 | 208 | 186180 | 1354.01 | 592 | 597 | 137.1 |
| D | 8 | 195 | 898285 | 6068.54 | 599 | 581 | 147.9 |
| D | 12 | 218 | 275416 | 1857.9 | 599 | 581 | 147.9 |
| D | 13 | 249 | 61709 | 413.23 | 599 | 581 | 147.9 |
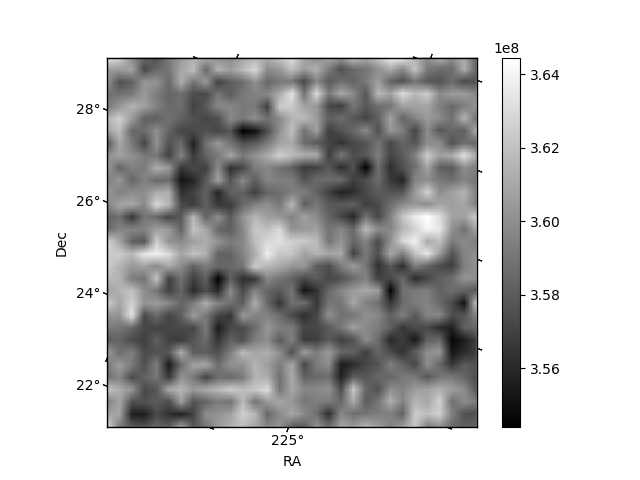
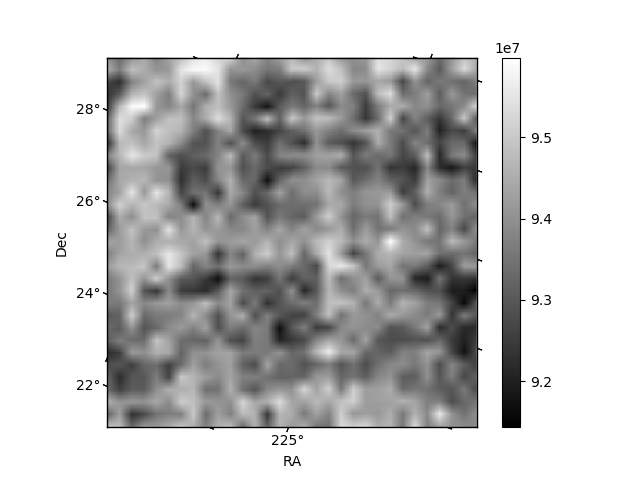
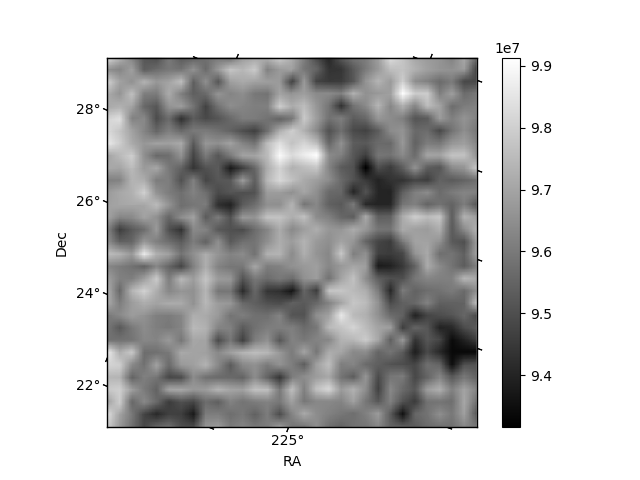
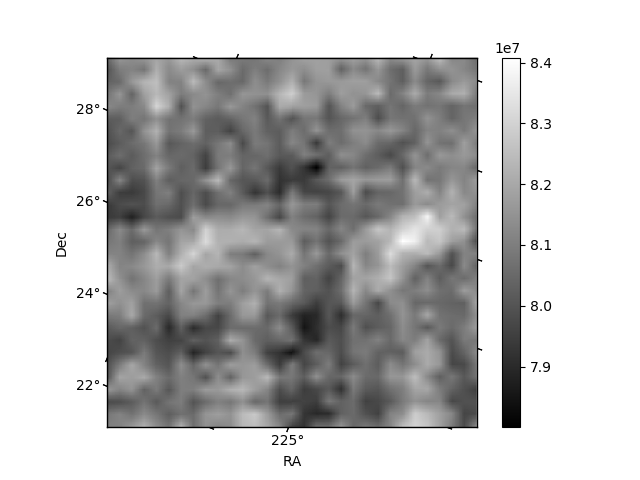
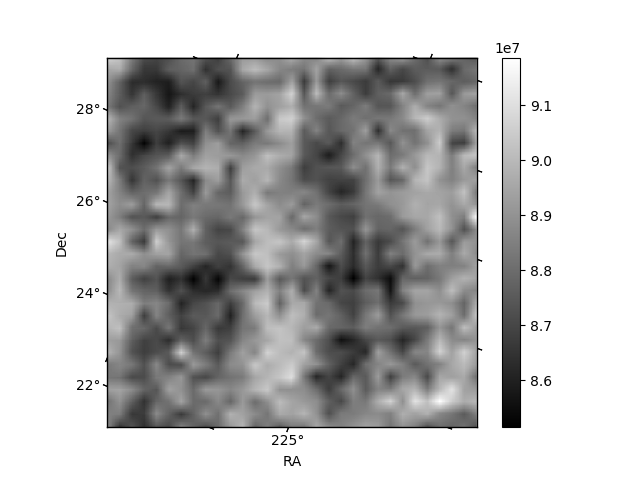
Histogram calculated using DETX and DETY for each event in the final _common_clean file
| Quadrant A | 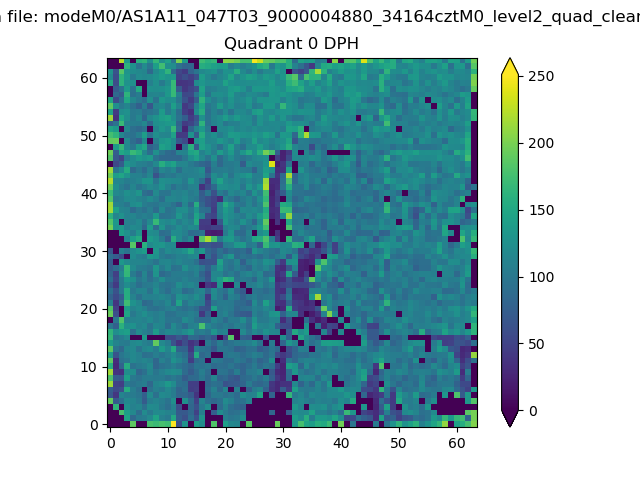 |
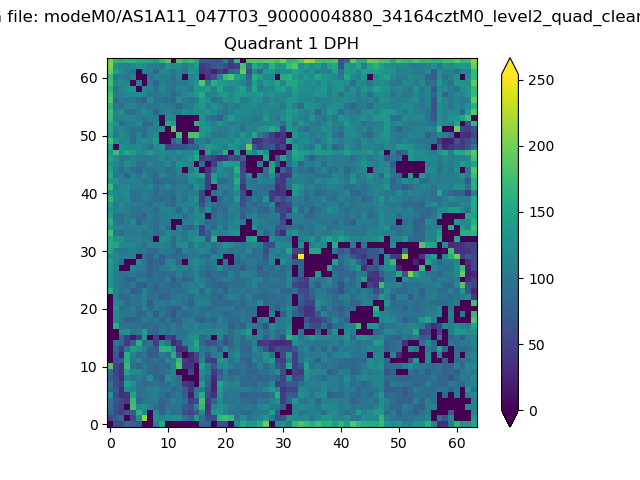 |
Quadrant B |
|---|---|---|---|
| Quadrant D | 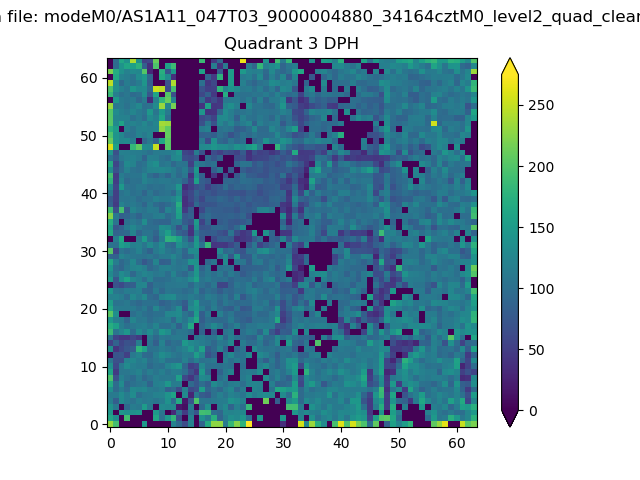 |
 |
Quadrant C |
| Plot type | Count rate plots | Images |
|---|---|---|
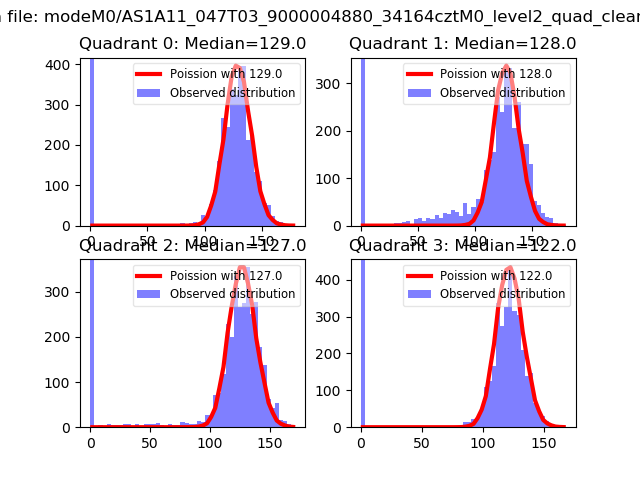
| Comparison with Poisson distribution Blue bars denote a histogram of data divided into 1 sec bins. Red curve is a Poisson curve with rate = median count rate of data. |
 |
 |
| Quadrant-wise count rates Data is divided into 100 sec bins |
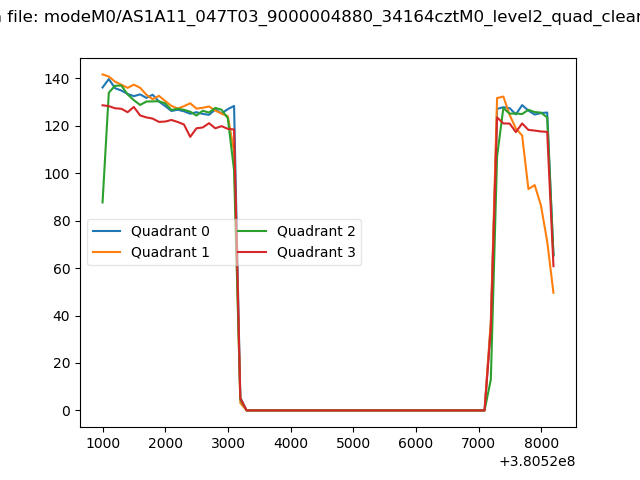 |
|
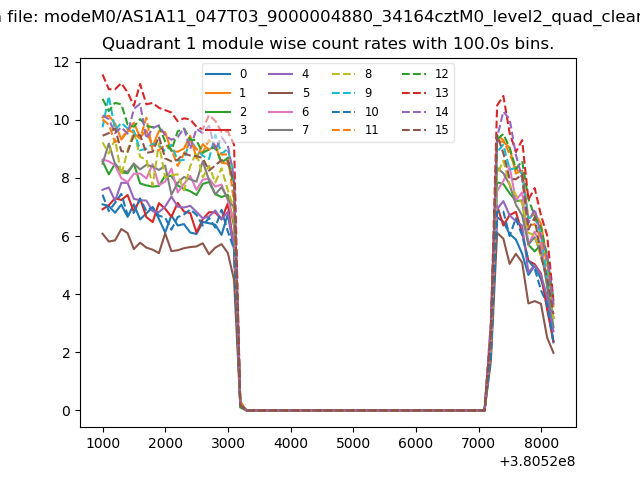
| Module-wise count rates for Quadrant A Data is divided into 100 sec bins |
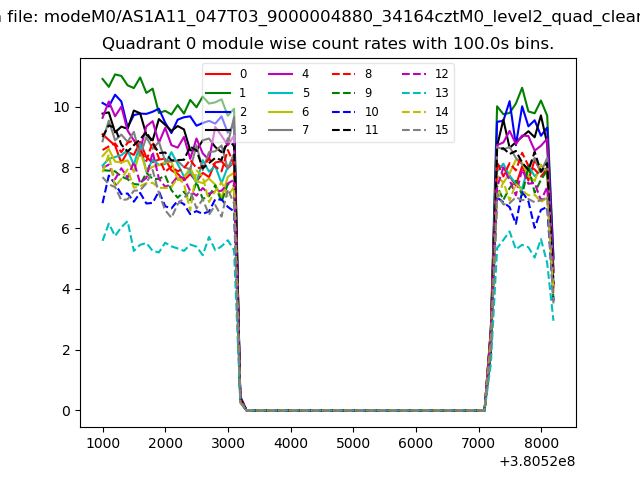 |
 |
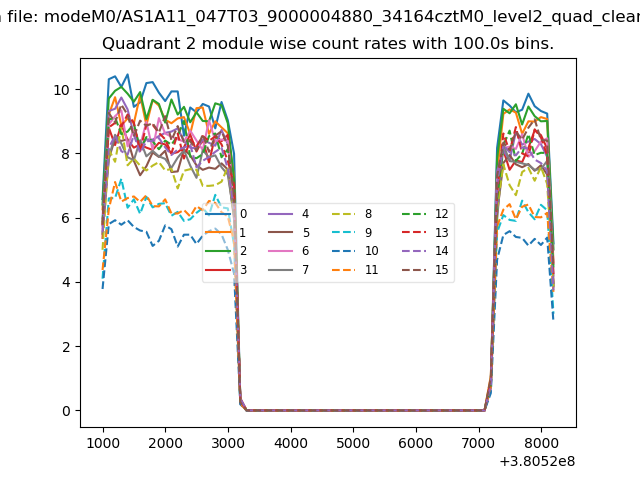
| Module-wise count rates for Quadrant B Data is divided into 100 sec bins |
 |
 |
| Module-wise count rates for Quadrant C Data is divided into 100 sec bins |
 |
 |
| Module-wise count rates for Quadrant D Data is divided into 100 sec bins |
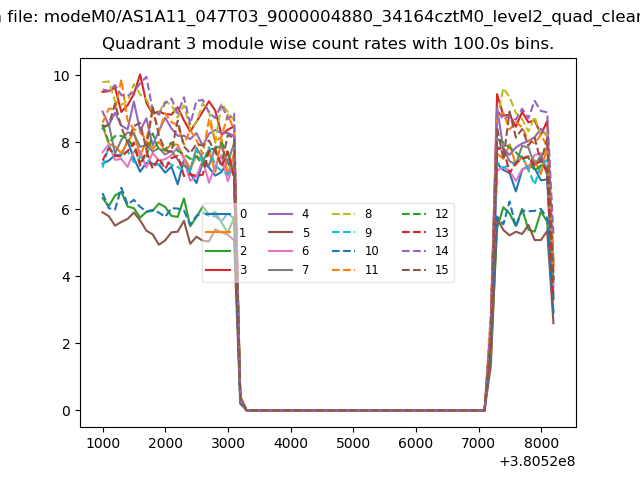 |
 |
| Parameter | Plot |
|---|---|
| CZT HV Monitor | 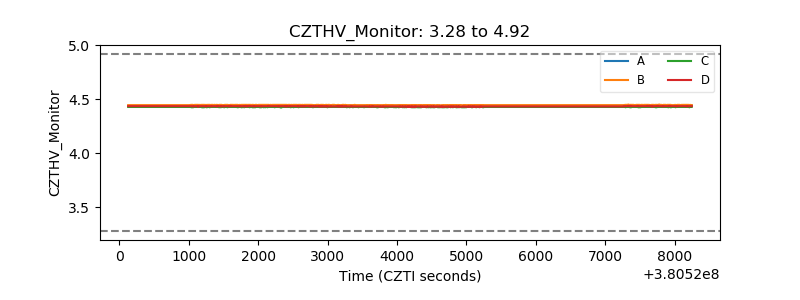 |
| D_VDD | 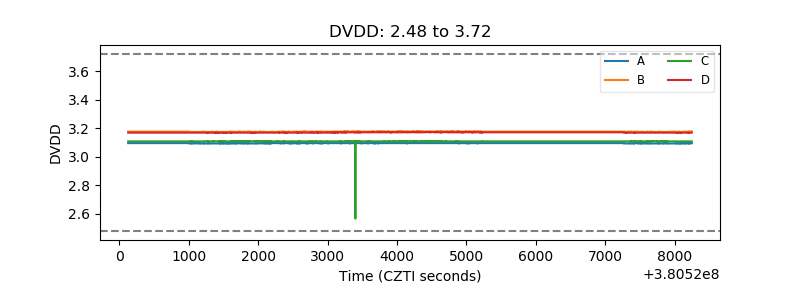 |
| Temperature 1 | 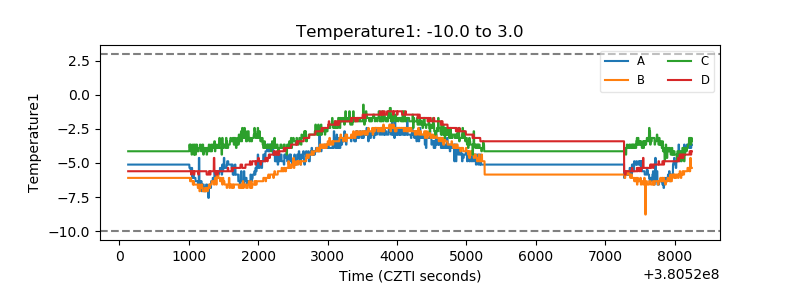 |
| Veto HV Monitor |  |
| Veto LLD | 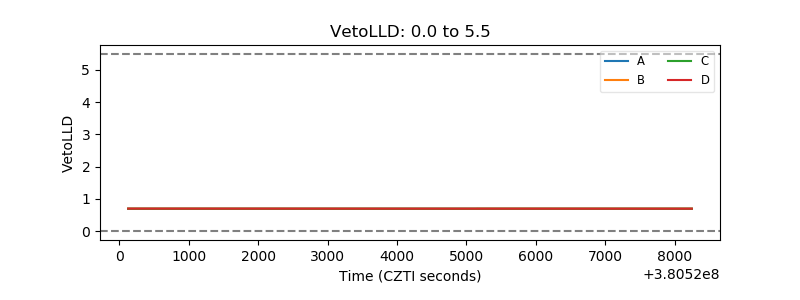 |
| Alpha Counter | 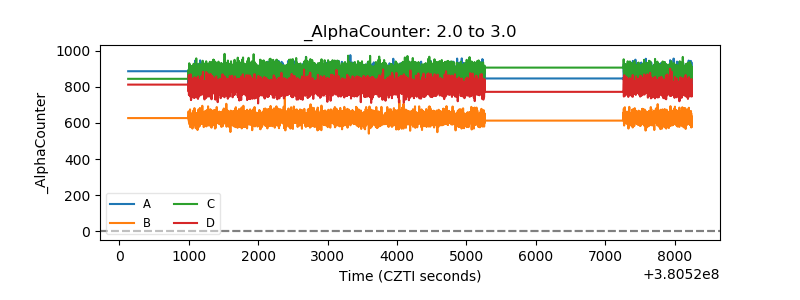 |
| _CPM_Rate | 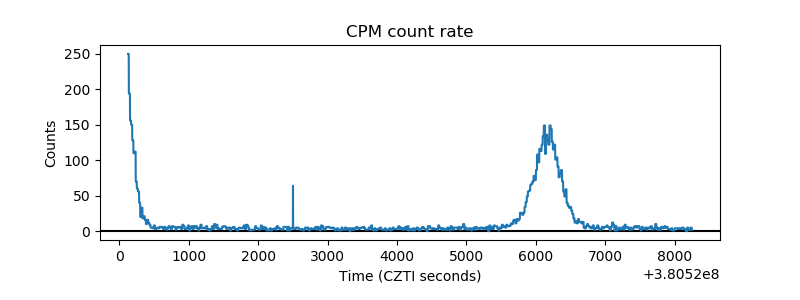 |
| CZT Counter | 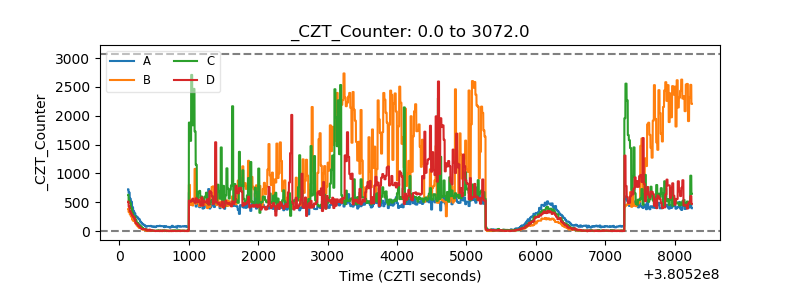 |
| +2.5 Volts monitor | 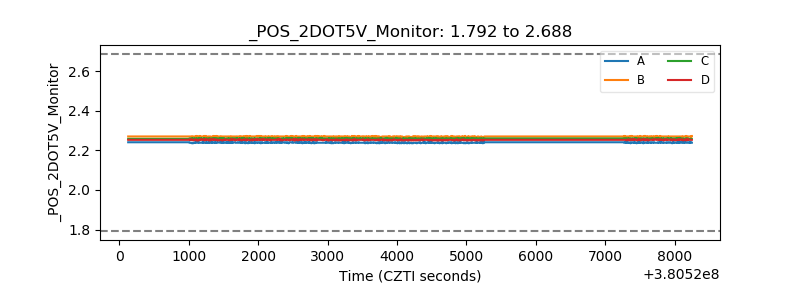 |
| +5 Volts monitor |  |
| _ROLL_ROT | 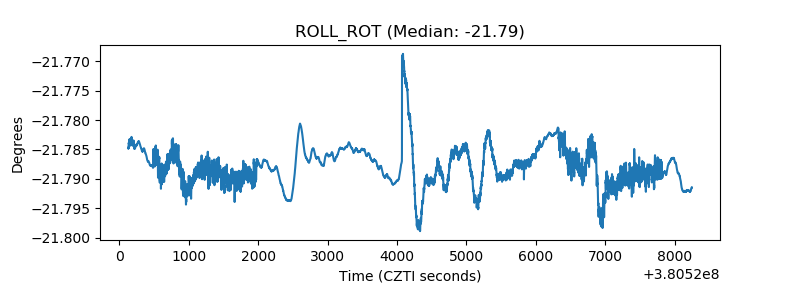 |
| _Roll_DEC | 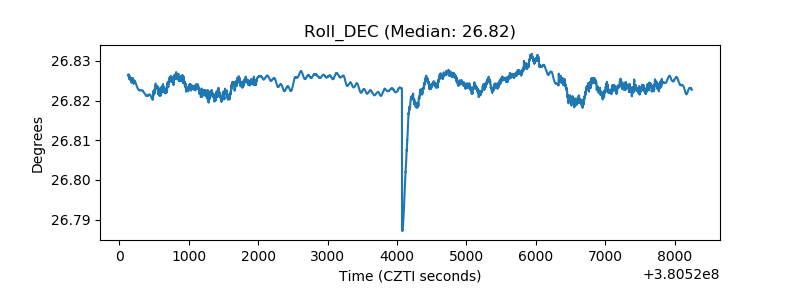 |
| _Roll_RA | 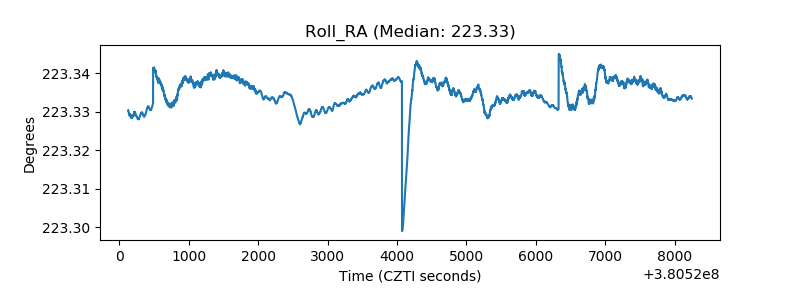 |
| Veto Counter | 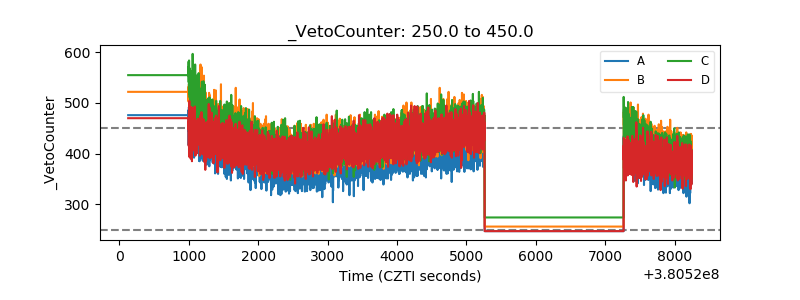 |