| Param | Original file | Final file |
|---|---|---|
| Filename | modeM0/AS1A11_047T03_9000004880_34165cztM0_level2.evt | modeM0/AS1A11_047T03_9000004880_34165cztM0_level2_quad_clean.evt |
| Size (bytes) | 684,446,400 | 63,535,680 |
| Size | 652.7 MB | 60.6 MB |
| Events in quadrant A | 2,533,091 | 409,878 |
| Events in quadrant B | 9,530,545 | 348,324 |
| Events in quadrant C | 4,162,836 | 395,871 |
| Events in quadrant D | 4,130,779 | 384,462 |
| Mode SS | |||
|---|---|---|---|
| Quadrant | BADHDUFLAG | Total packets | Discarded packets |
| A | 0 | 112 | 0 |
| B | 0 | 112 | 0 |
| C | 0 | 112 | 0 |
| D | 0 | 112 | 0 |
| Mode M9 | |||
|---|---|---|---|
| Quadrant | BADHDUFLAG | Total packets | Discarded packets |
| A | 0 | 34 | 0 |
| B | 0 | 34 | 0 |
| C | 0 | 34 | 0 |
| D | 0 | 35 | 0 |
| Mode M0 | |||
|---|---|---|---|
| Quadrant | BADHDUFLAG | Total packets | Discarded packets |
| A | 0 | 11050 | 3 |
| B | 0 | 32085 | 2 |
| C | 0 | 15876 | 2 |
| D | 0 | 16107 | 2 |
| Quadrant | Total seconds | Saturated seconds | Saturation percentage |
|---|---|---|---|
| A | 5491 | 7 | 0.127481% |
| B | 5491 | 2767 | 50.391550% |
| C | 5491 | 344 | 6.264797% |
| D | 5491 | 51 | 0.928793% |
Noise dominated data is calculated using 1-second bins in cleaned event files. If a bin has >2000 counts, and if more than 50% of those come from <1% of pixels, then it is considered to be noise-dominated and hence unusable.
| Quadrant | # 1 sec bins | Bins with >0 counts | Bins with >2000 counts | High rate bins dominated by noise | Noise dominated (total time) | Noise dominated (detector-on time) | Marked lightcurve |
|---|---|---|---|---|---|---|---|
| A | 7164 | 5492 | 0 | 0 | 0.00% | 0.00% | 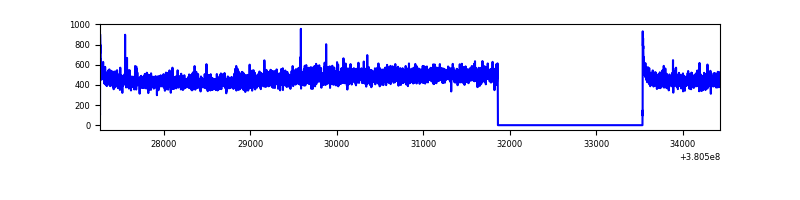 |
| B | 7164 | 5492 | 2483 | 2483 | 34.66% | 45.21% | 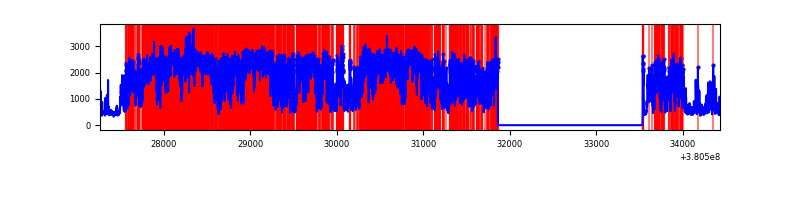 |
| C | 7164 | 5492 | 301 | 301 | 4.20% | 5.48% | 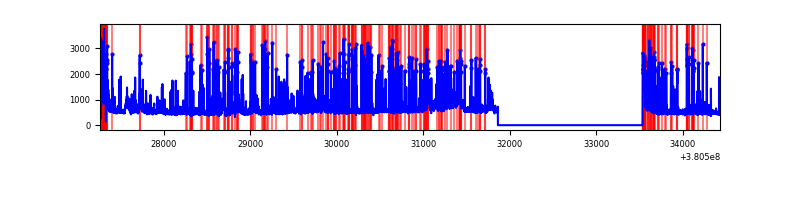 |
| D | 7164 | 5492 | 34 | 34 | 0.47% | 0.62% | 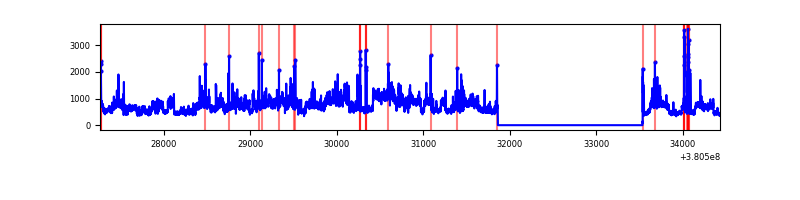 |
Top three noisy pixels from each quadrant. If the there are fewer than three noisy pixels in the level2.evt file, extra rows are filled as -1
| Pixel properties | Quadrant properties | ||||||
|---|---|---|---|---|---|---|---|
| Quadrant | DetID | PixID | Counts | Sigma | Mean | Median | Sigma |
| A | 10 | 83 | 21617 | 159.97 | 648 | 633 | 131.2 |
| A | 13 | 6 | 8872 | 62.81 | 648 | 633 | 131.2 |
| A | 13 | 254 | 8864 | 62.75 | 648 | 633 | 131.2 |
| B | 5 | 31 | 4733962 | 45995.77 | 530 | 515 | 102.9 |
| B | 5 | 15 | 1942413 | 18869.78 | 530 | 515 | 102.9 |
| B | 5 | 172 | 414087 | 4018.75 | 530 | 515 | 102.9 |
| C | 0 | 10 | 1169582 | 8137.24 | 612 | 616 | 143.7 |
| C | 0 | 239 | 345170 | 2398.46 | 612 | 616 | 143.7 |
| C | 15 | 214 | 234275 | 1626.51 | 612 | 616 | 143.7 |
| D | 8 | 195 | 1335525 | 8619.15 | 626 | 609 | 154.9 |
| D | 12 | 218 | 156211 | 1004.67 | 626 | 609 | 154.9 |
| D | 2 | 250 | 46279 | 294.88 | 626 | 609 | 154.9 |
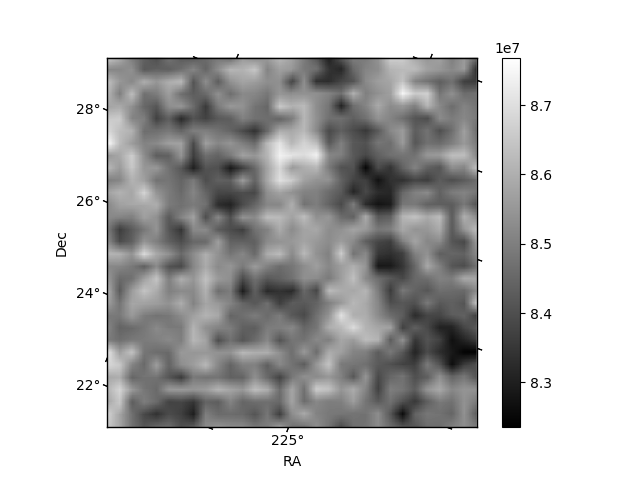
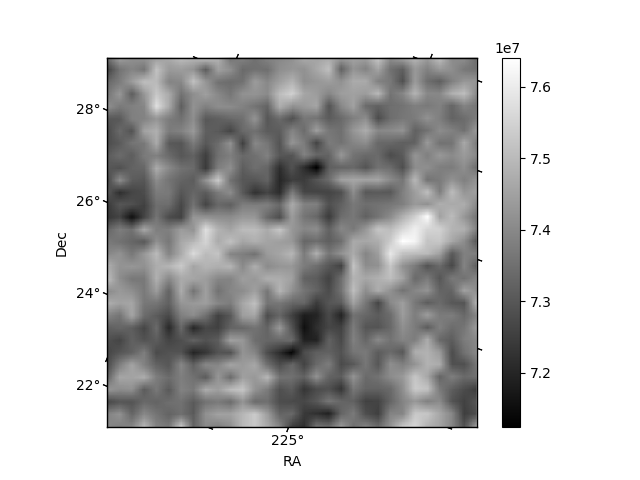
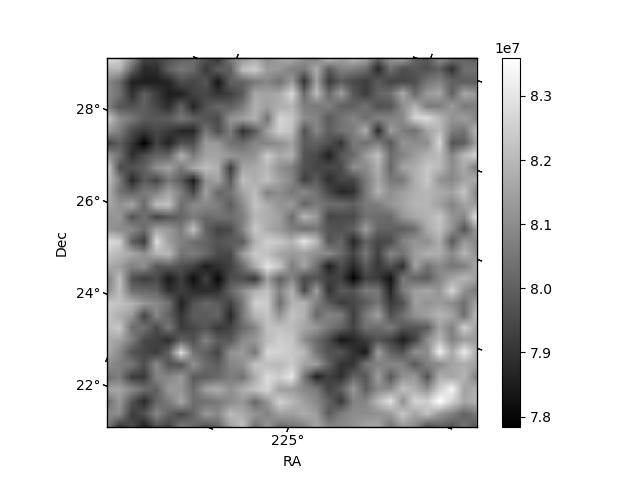
Histogram calculated using DETX and DETY for each event in the final _common_clean file
| Quadrant A | 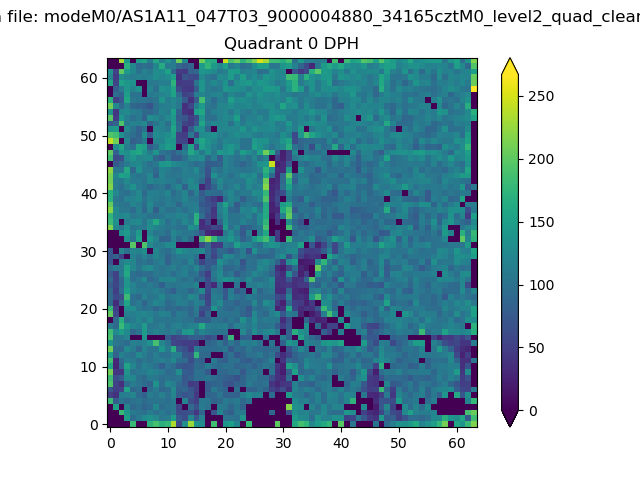 |
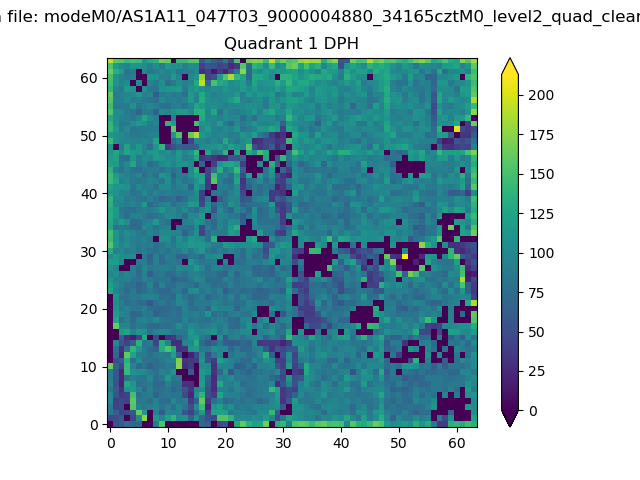 |
Quadrant B |
|---|---|---|---|
| Quadrant D | 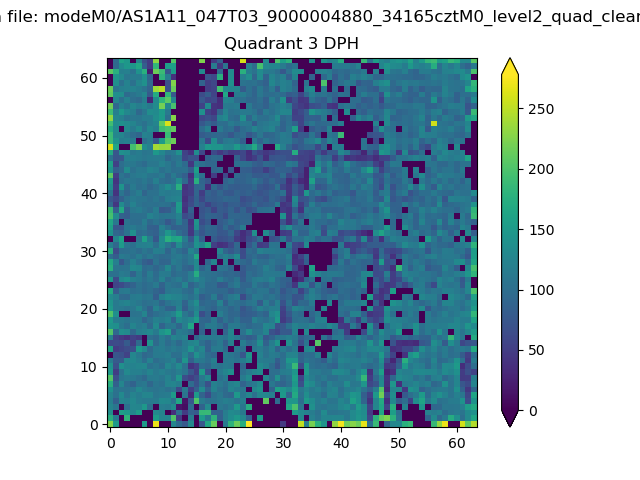 |
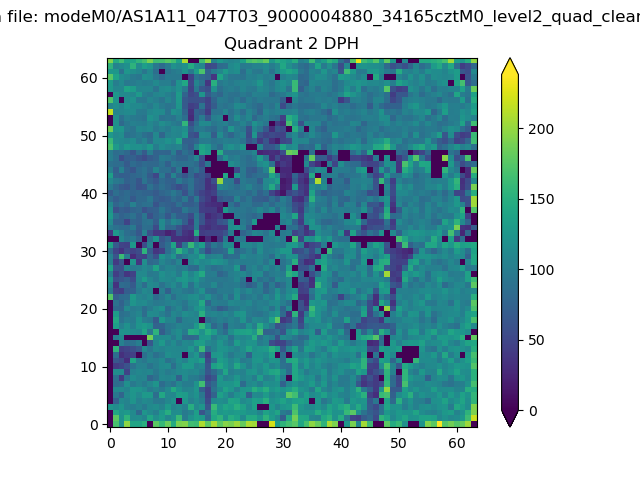 |
Quadrant C |
| Plot type | Count rate plots | Images |
|---|---|---|
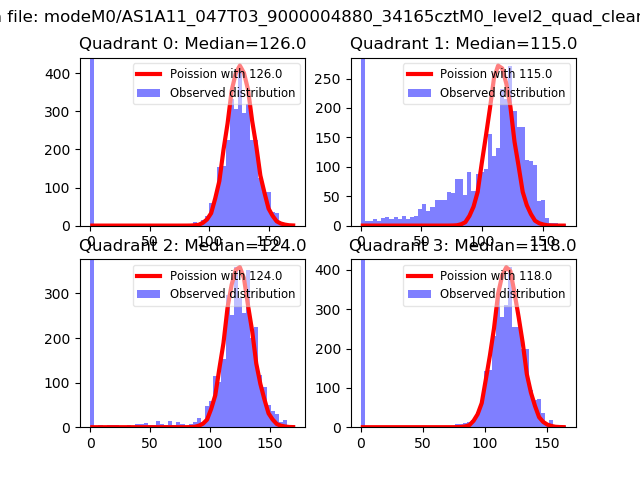
| Comparison with Poisson distribution Blue bars denote a histogram of data divided into 1 sec bins. Red curve is a Poisson curve with rate = median count rate of data. |
 |
 |
| Quadrant-wise count rates Data is divided into 100 sec bins |
 |
|
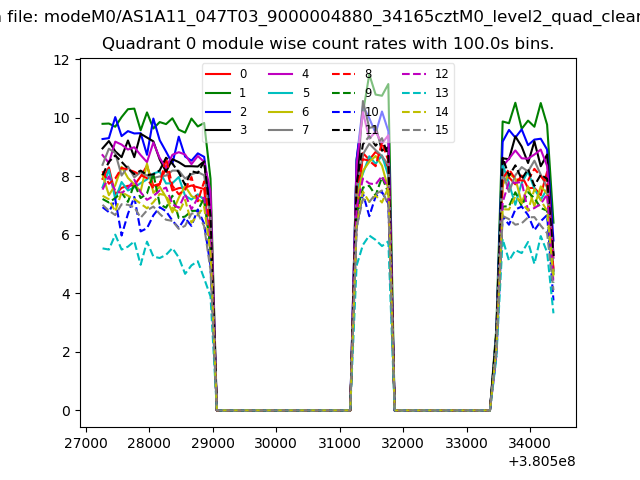
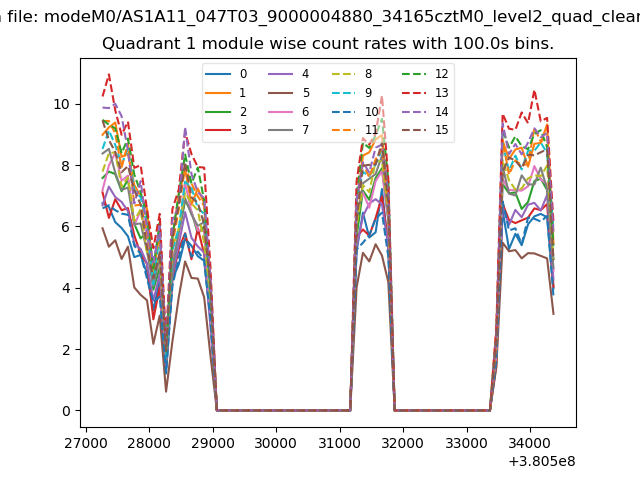
| Module-wise count rates for Quadrant A Data is divided into 100 sec bins |
 |
 |
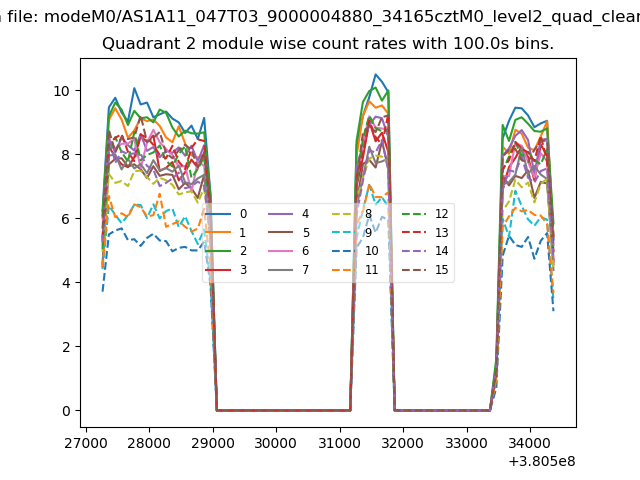
| Module-wise count rates for Quadrant B Data is divided into 100 sec bins |
 |
 |
| Module-wise count rates for Quadrant C Data is divided into 100 sec bins |
 |
 |
| Module-wise count rates for Quadrant D Data is divided into 100 sec bins |
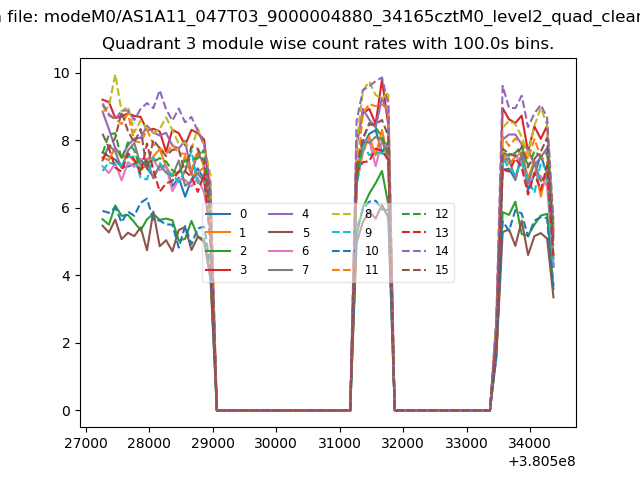 |
 |
| Parameter | Plot |
|---|---|
| CZT HV Monitor | 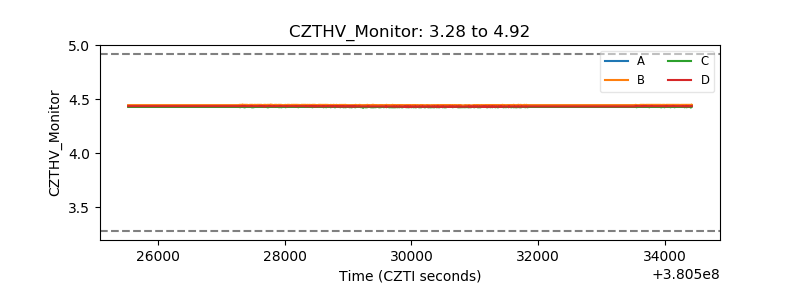 |
| D_VDD | 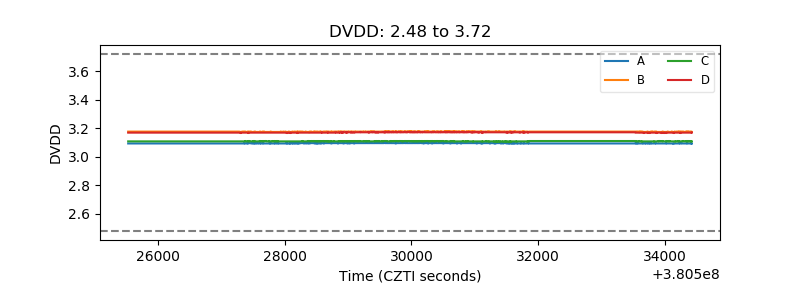 |
| Temperature 1 | 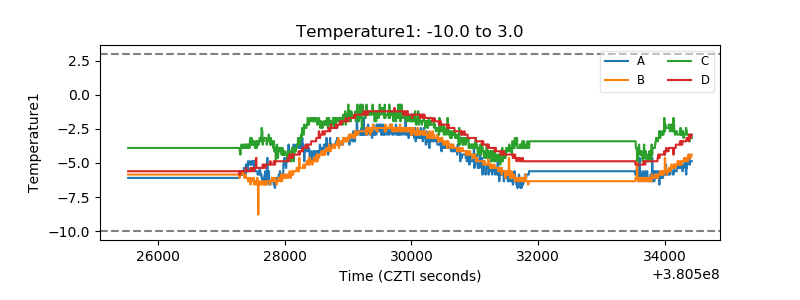 |
| Veto HV Monitor | 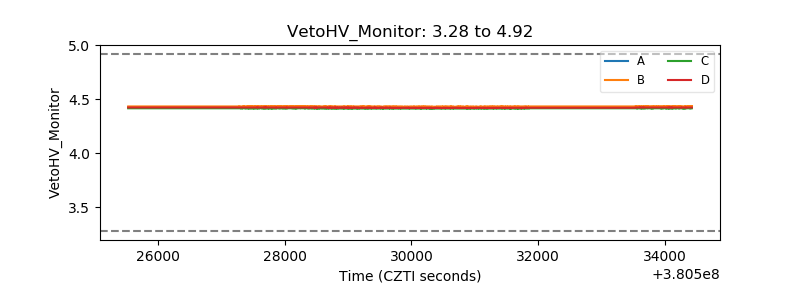 |
| Veto LLD | 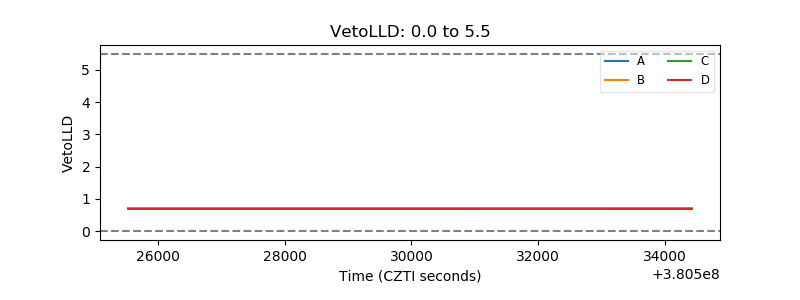 |
| Alpha Counter | 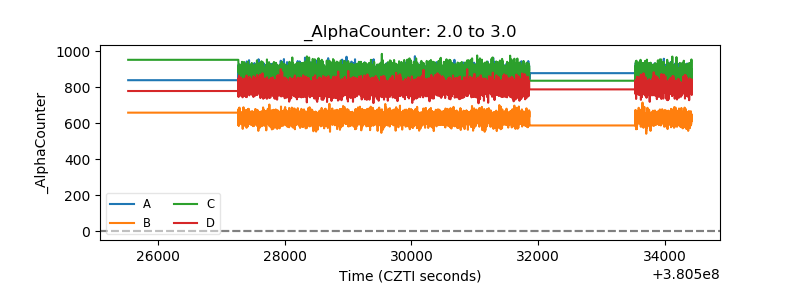 |
| _CPM_Rate | 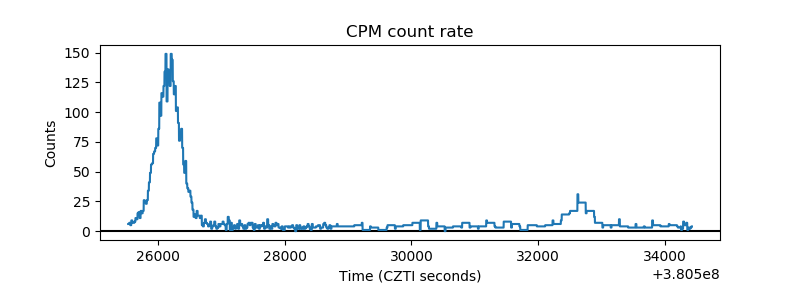 |
| CZT Counter |  |
| +2.5 Volts monitor |  |
| +5 Volts monitor |  |
| _ROLL_ROT | 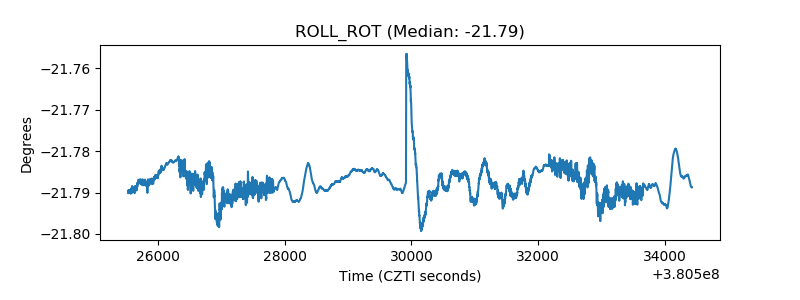 |
| _Roll_DEC |  |
| _Roll_RA | 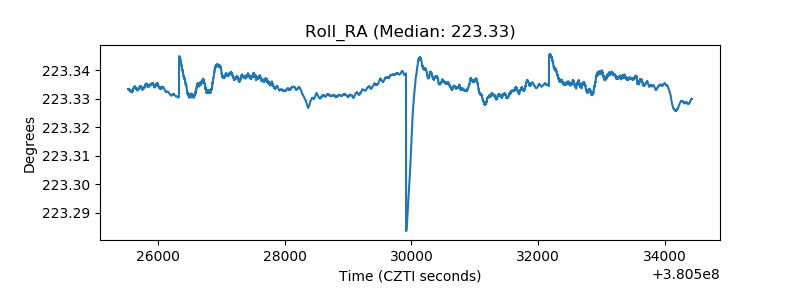 |
| Veto Counter | 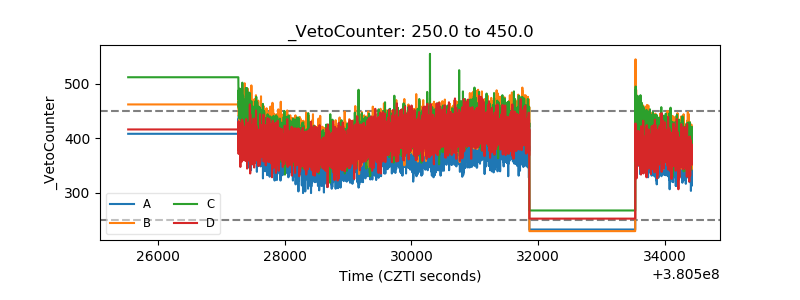 |