| Param | Original file | Final file |
|---|---|---|
| Filename | modeM0/AS1A11_047T03_9000004880_34166cztM0_level2.evt | modeM0/AS1A11_047T03_9000004880_34166cztM0_level2_quad_clean.evt |
| Size (bytes) | 758,658,240 | 68,440,320 |
| Size | 723.5 MB | 65.3 MB |
| Events in quadrant A | 2,651,068 | 443,534 |
| Events in quadrant B | 10,511,475 | 384,646 |
| Events in quadrant C | 5,241,270 | 426,442 |
| Events in quadrant D | 4,183,991 | 414,590 |
| Mode SS | |||
|---|---|---|---|
| Quadrant | BADHDUFLAG | Total packets | Discarded packets |
| A | 0 | 116 | 0 |
| B | 0 | 116 | 0 |
| C | 0 | 116 | 0 |
| D | 0 | 116 | 0 |
| Mode M9 | |||
|---|---|---|---|
| Quadrant | BADHDUFLAG | Total packets | Discarded packets |
| A | 0 | 23 | 0 |
| B | 0 | 23 | 0 |
| C | 0 | 23 | 0 |
| D | 0 | 24 | 0 |
| Mode M0 | |||
|---|---|---|---|
| Quadrant | BADHDUFLAG | Total packets | Discarded packets |
| A | 0 | 11573 | 3 |
| B | 0 | 35174 | 2 |
| C | 0 | 19363 | 2 |
| D | 0 | 16278 | 2 |
| Quadrant | Total seconds | Saturated seconds | Saturation percentage |
|---|---|---|---|
| A | 5757 | 4 | 0.069481% |
| B | 5757 | 3331 | 57.859997% |
| C | 5757 | 428 | 7.434428% |
| D | 5757 | 70 | 1.215911% |
Noise dominated data is calculated using 1-second bins in cleaned event files. If a bin has >2000 counts, and if more than 50% of those come from <1% of pixels, then it is considered to be noise-dominated and hence unusable.
| Quadrant | # 1 sec bins | Bins with >0 counts | Bins with >2000 counts | High rate bins dominated by noise | Noise dominated (total time) | Noise dominated (detector-on time) | Marked lightcurve |
|---|---|---|---|---|---|---|---|
| A | 7160 | 5758 | 0 | 0 | 0.00% | 0.00% | 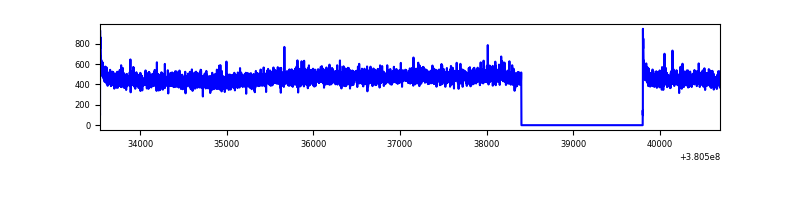 |
| B | 7160 | 5758 | 2998 | 2998 | 41.87% | 52.07% | 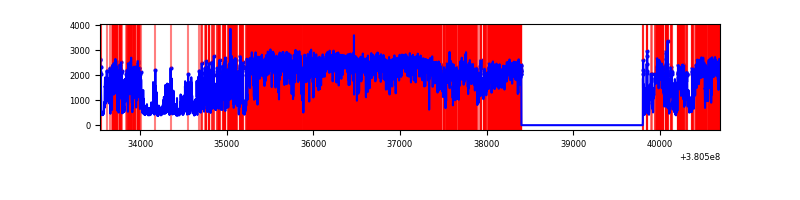 |
| C | 7160 | 5758 | 372 | 372 | 5.20% | 6.46% | 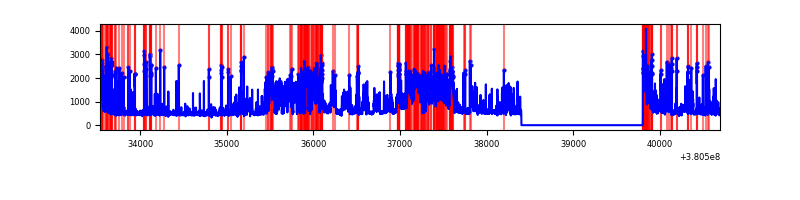 |
| D | 7160 | 5758 | 58 | 58 | 0.81% | 1.01% | 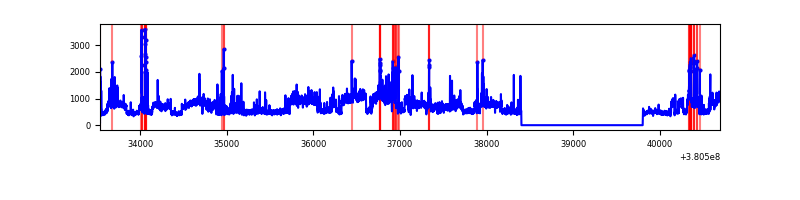 |
Top three noisy pixels from each quadrant. If the there are fewer than three noisy pixels in the level2.evt file, extra rows are filled as -1
| Pixel properties | Quadrant properties | ||||||
|---|---|---|---|---|---|---|---|
| Quadrant | DetID | PixID | Counts | Sigma | Mean | Median | Sigma |
| A | 10 | 83 | 21533 | 152.03 | 679 | 665 | 137.3 |
| A | 13 | 254 | 9065 | 61.2 | 679 | 665 | 137.3 |
| A | 13 | 6 | 7833 | 52.22 | 679 | 665 | 137.3 |
| B | 5 | 31 | 5214130 | 50687.07 | 529 | 515 | 102.9 |
| B | 5 | 15 | 2539908 | 24688.13 | 529 | 515 | 102.9 |
| B | 5 | 14 | 288362 | 2798.47 | 529 | 515 | 102.9 |
| C | 0 | 239 | 1827025 | 11995.39 | 646 | 650 | 152.3 |
| C | 0 | 10 | 641731 | 4210.54 | 646 | 650 | 152.3 |
| C | 15 | 214 | 245416 | 1607.59 | 646 | 650 | 152.3 |
| D | 8 | 195 | 1267119 | 7681.36 | 657 | 638 | 164.9 |
| D | 13 | 249 | 92872 | 559.41 | 657 | 638 | 164.9 |
| D | 12 | 218 | 65007 | 390.41 | 657 | 638 | 164.9 |
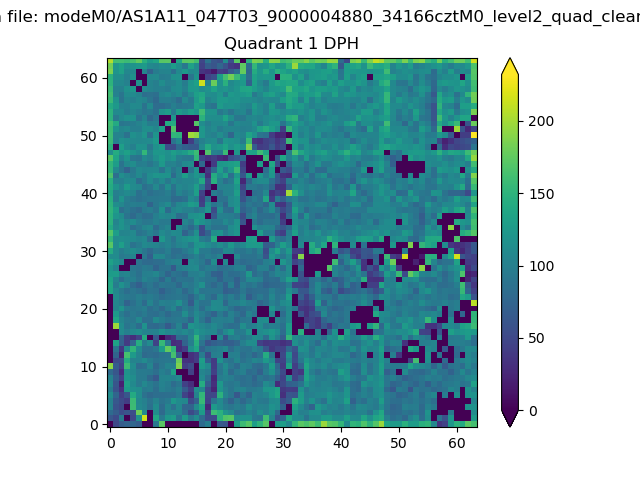
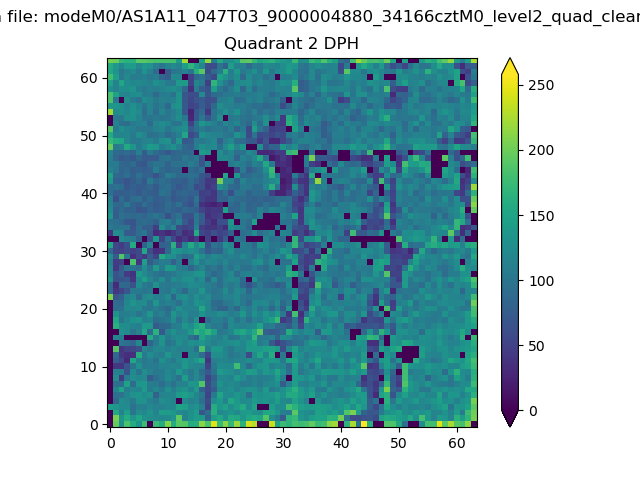
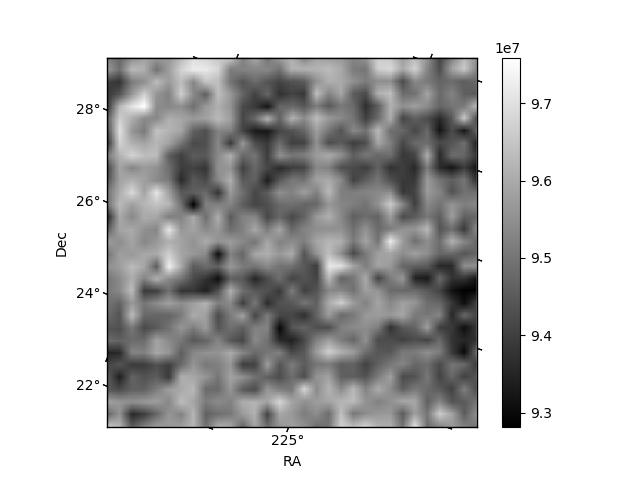
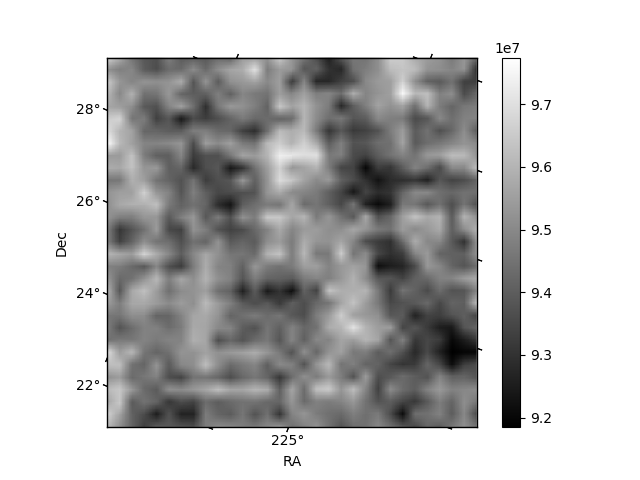
Histogram calculated using DETX and DETY for each event in the final _common_clean file
| Quadrant A |  |
 |
Quadrant B |
|---|---|---|---|
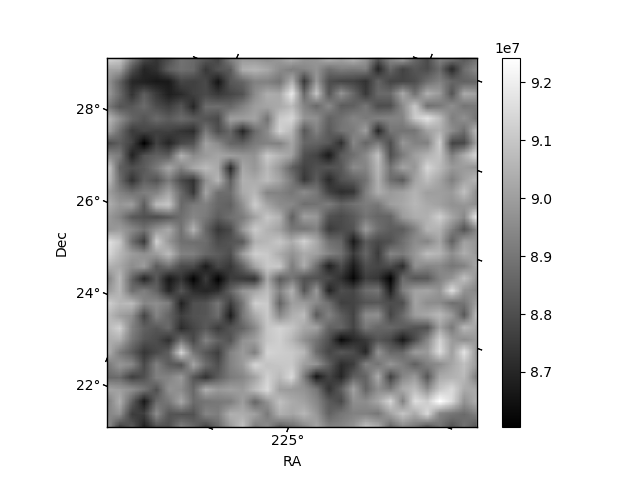
| Quadrant D |  |
 |
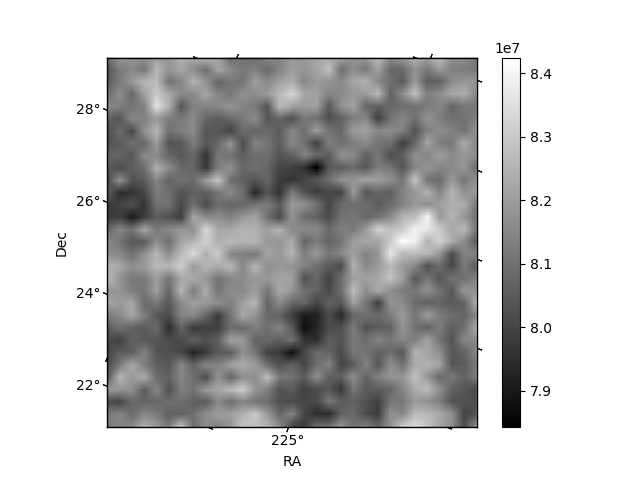
Quadrant C |
| Plot type | Count rate plots | Images |
|---|---|---|
| Comparison with Poisson distribution Blue bars denote a histogram of data divided into 1 sec bins. Red curve is a Poisson curve with rate = median count rate of data. |
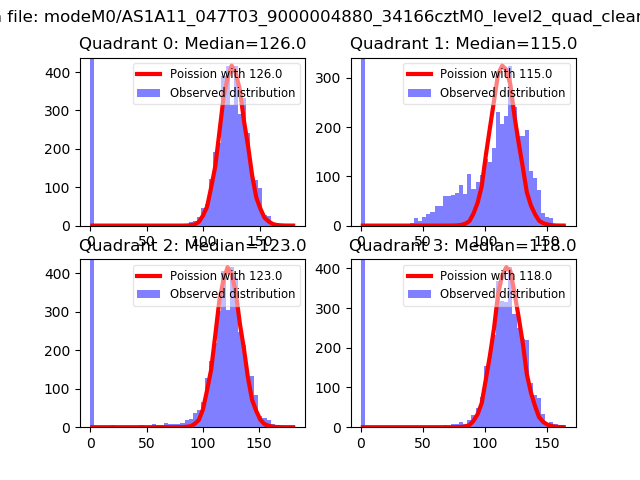 |
 |
| Quadrant-wise count rates Data is divided into 100 sec bins |
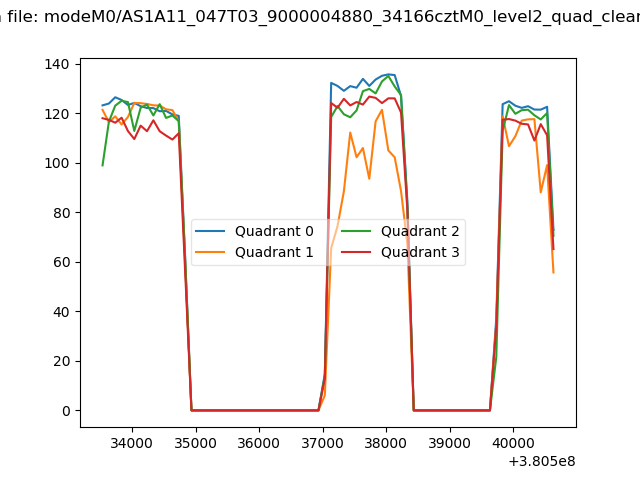 |
|
| Module-wise count rates for Quadrant A Data is divided into 100 sec bins |
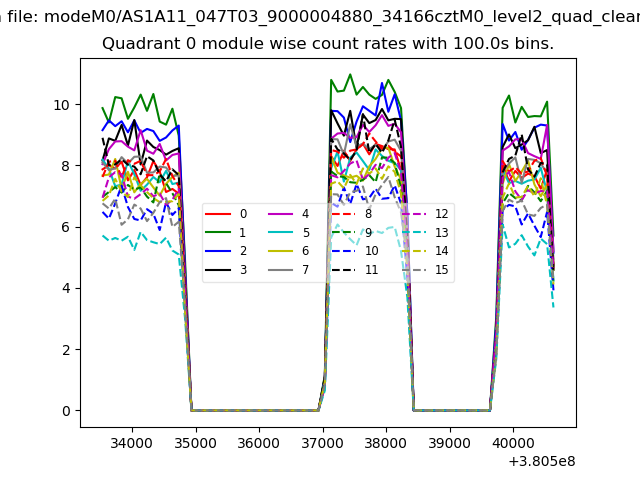 |
 |
| Module-wise count rates for Quadrant B Data is divided into 100 sec bins |
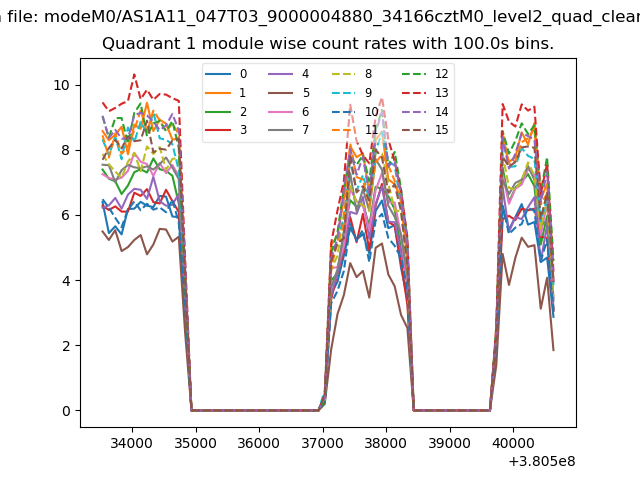 |
 |
| Module-wise count rates for Quadrant C Data is divided into 100 sec bins |
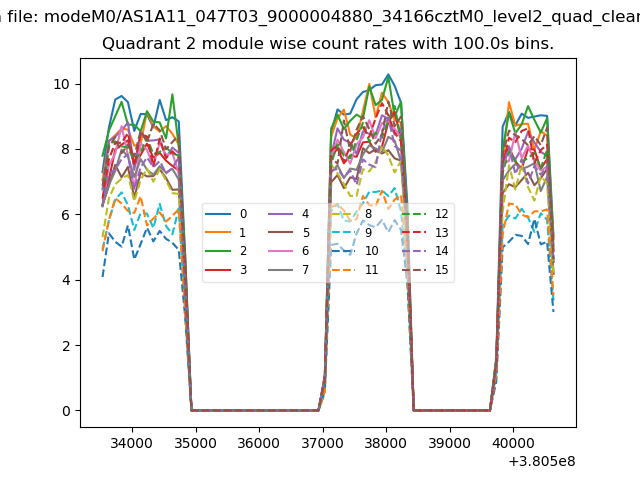 |
 |
| Module-wise count rates for Quadrant D Data is divided into 100 sec bins |
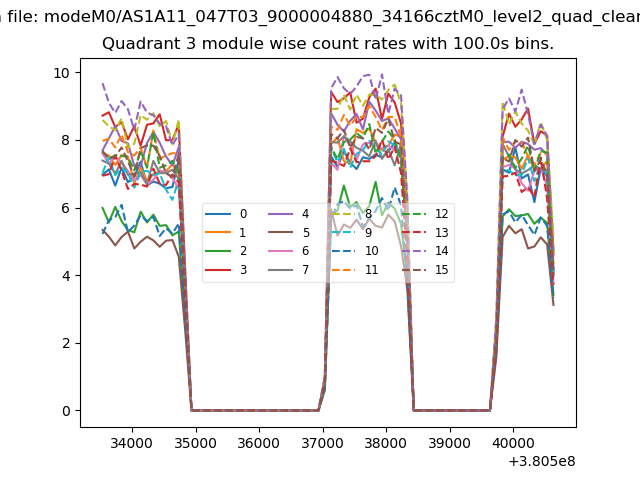 |
 |
| Parameter | Plot |
|---|---|
| CZT HV Monitor | 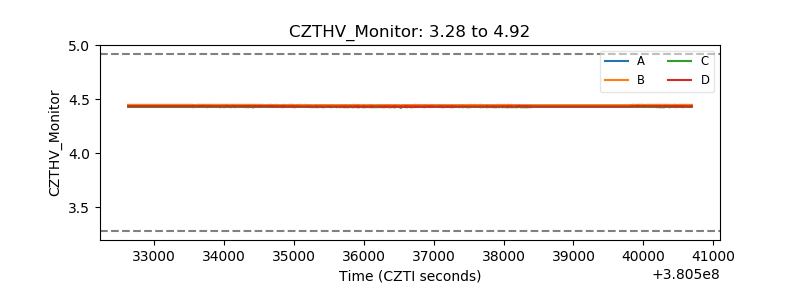 |
| D_VDD | 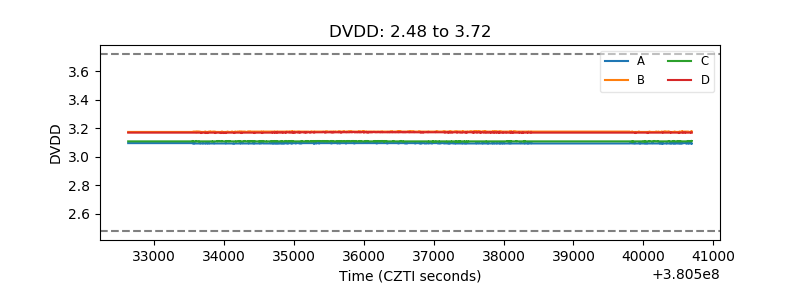 |
| Temperature 1 | 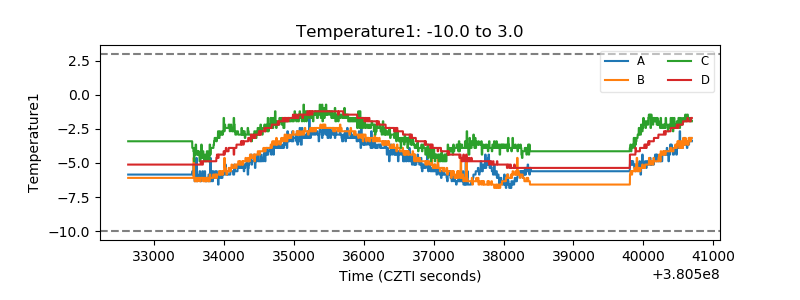 |
| Veto HV Monitor | 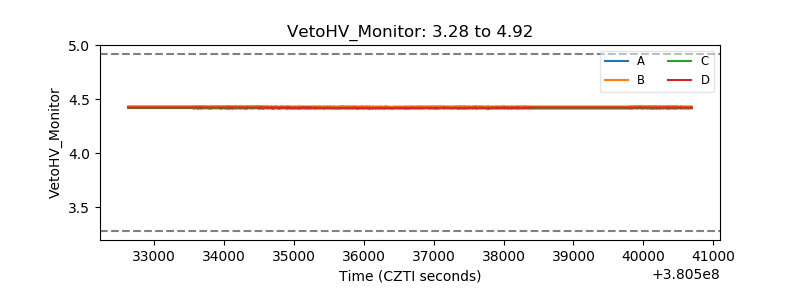 |
| Veto LLD | 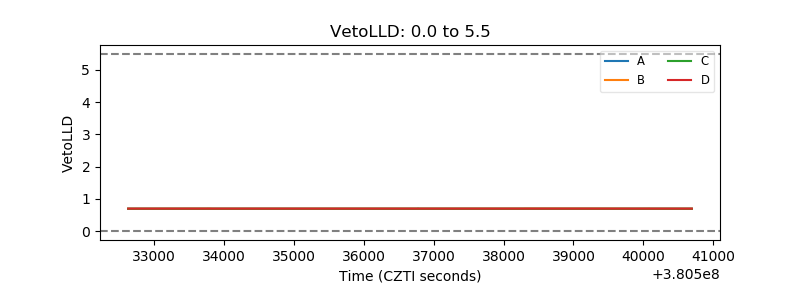 |
| Alpha Counter | 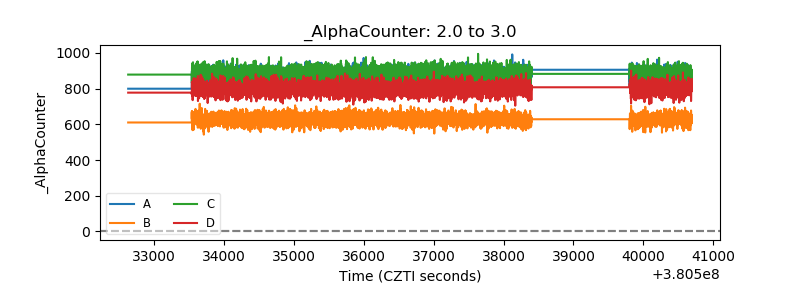 |
| _CPM_Rate | 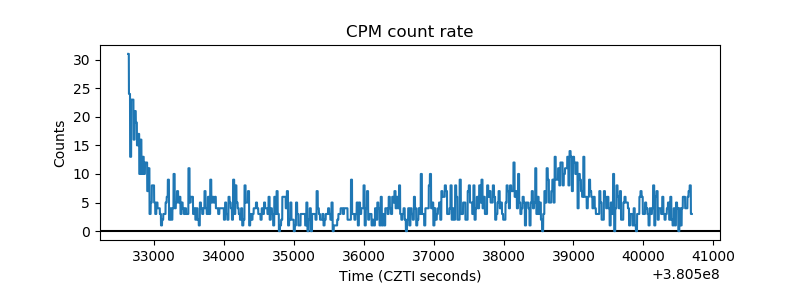 |
| CZT Counter | 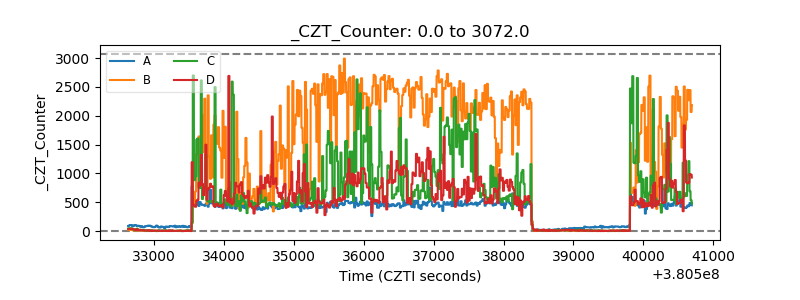 |
| +2.5 Volts monitor | 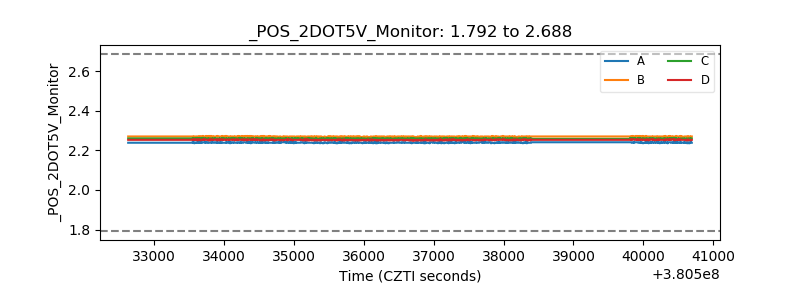 |
| +5 Volts monitor | 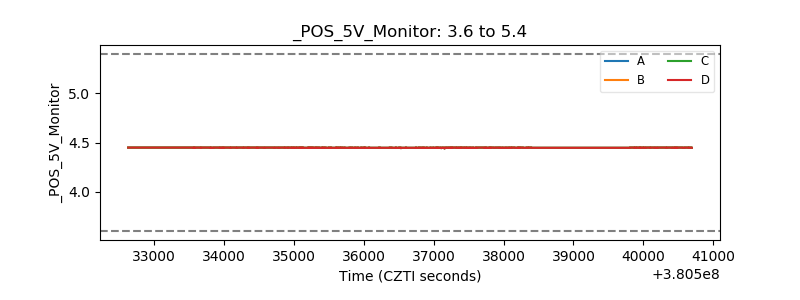 |
| _ROLL_ROT | 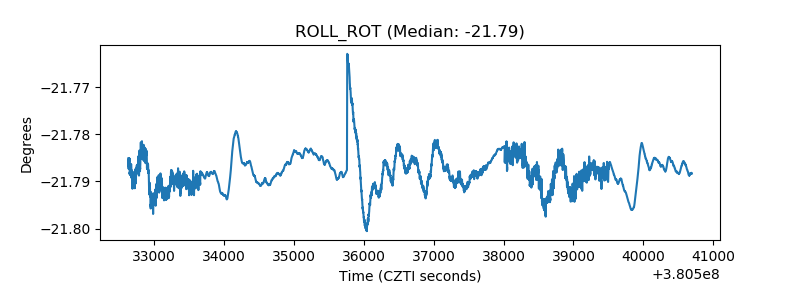 |
| _Roll_DEC | 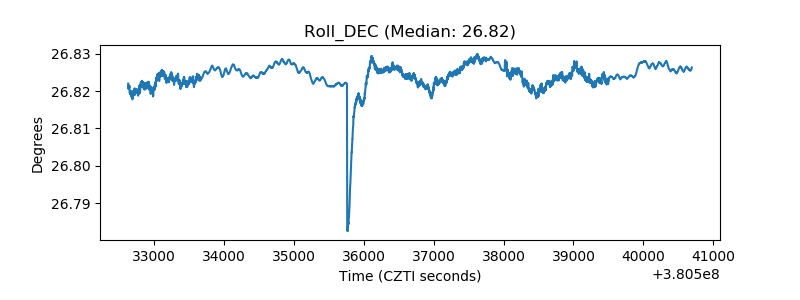 |
| _Roll_RA | 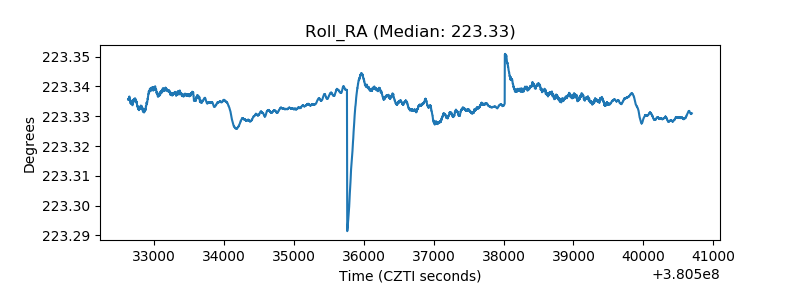 |
| Veto Counter | 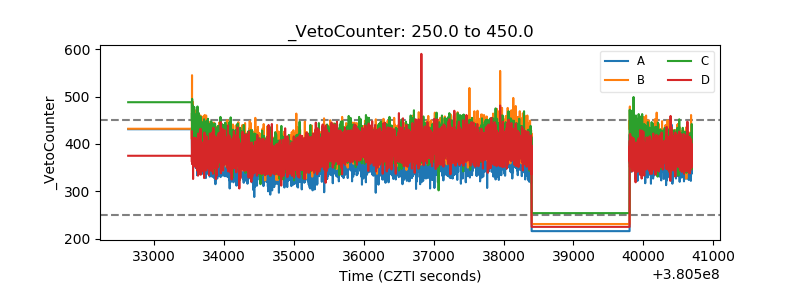 |