| Param | Original file | Final file |
|---|---|---|
| Filename | modeM0/AS1A11_047T03_9000004880_34170cztM0_level2.evt | modeM0/AS1A11_047T03_9000004880_34170cztM0_level2_quad_clean.evt |
| Size (bytes) | 1,652,270,400 | 129,456,000 |
| Size | 1.5 GB | 123.5 MB |
| Events in quadrant A | 5,955,185 | 804,888 |
| Events in quadrant B | 19,732,291 | 702,513 |
| Events in quadrant C | 13,173,287 | 772,755 |
| Events in quadrant D | 10,320,730 | 756,043 |
| Mode SS | |||
|---|---|---|---|
| Quadrant | BADHDUFLAG | Total packets | Discarded packets |
| A | 0 | 258 | 0 |
| B | 0 | 258 | 0 |
| C | 0 | 258 | 0 |
| D | 0 | 258 | 0 |
| Mode M9 | |||
|---|---|---|---|
| Quadrant | BADHDUFLAG | Total packets | Discarded packets |
| A | 0 | 33 | 0 |
| B | 0 | 33 | 0 |
| C | 0 | 33 | 0 |
| D | 0 | 34 | 0 |
| Mode M0 | |||
|---|---|---|---|
| Quadrant | BADHDUFLAG | Total packets | Discarded packets |
| A | 0 | 25884 | 3 |
| B | 0 | 67101 | 3 |
| C | 0 | 47835 | 3 |
| D | 0 | 39239 | 3 |
| Quadrant | Total seconds | Saturated seconds | Saturation percentage |
|---|---|---|---|
| A | 12777 | 13 | 0.101745% |
| B | 12777 | 6009 | 47.029819% |
| C | 12777 | 1764 | 13.806058% |
| D | 12777 | 407 | 3.185411% |
Noise dominated data is calculated using 1-second bins in cleaned event files. If a bin has >2000 counts, and if more than 50% of those come from <1% of pixels, then it is considered to be noise-dominated and hence unusable.
| Quadrant | # 1 sec bins | Bins with >0 counts | Bins with >2000 counts | High rate bins dominated by noise | Noise dominated (total time) | Noise dominated (detector-on time) | Marked lightcurve |
|---|---|---|---|---|---|---|---|
| A | 15522 | 12779 | 2 | 2 | 0.01% | 0.02% | 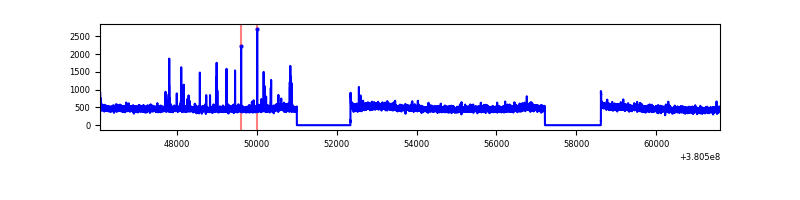 |
| B | 15522 | 12779 | 5339 | 5339 | 34.40% | 41.78% | 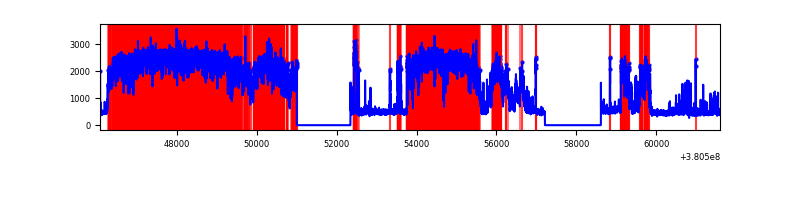 |
| C | 15522 | 12779 | 1530 | 1530 | 9.86% | 11.97% | 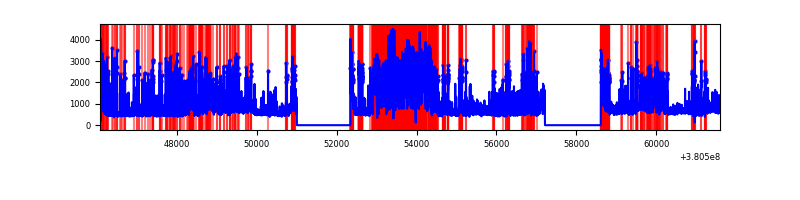 |
| D | 15522 | 12779 | 340 | 340 | 2.19% | 2.66% | 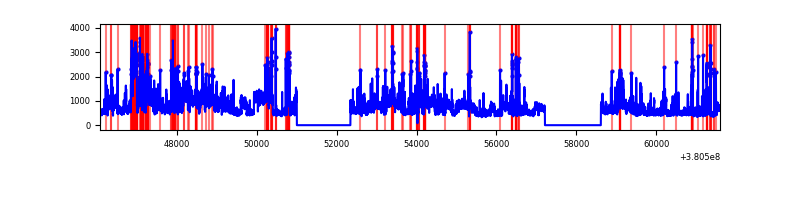 |
Top three noisy pixels from each quadrant. If the there are fewer than three noisy pixels in the level2.evt file, extra rows are filled as -1
| Pixel properties | Quadrant properties | ||||||
|---|---|---|---|---|---|---|---|
| Quadrant | DetID | PixID | Counts | Sigma | Mean | Median | Sigma |
| A | 15 | 17 | 80358 | 261.6 | 1497 | 1465 | 301.6 |
| A | 15 | 169 | 48971 | 157.52 | 1497 | 1465 | 301.6 |
| A | 10 | 83 | 35238 | 111.99 | 1497 | 1465 | 301.6 |
| B | 5 | 31 | 7072213 | 29644.48 | 1247 | 1213 | 238.5 |
| B | 5 | 15 | 5234384 | 21939.56 | 1247 | 1213 | 238.5 |
| B | 5 | 14 | 1451684 | 6080.96 | 1247 | 1213 | 238.5 |
| C | 0 | 239 | 6209100 | 19506.37 | 1374 | 1383 | 318.2 |
| C | 0 | 10 | 1046648 | 3284.51 | 1374 | 1383 | 318.2 |
| C | 15 | 214 | 512811 | 1607.05 | 1374 | 1383 | 318.2 |
| D | 8 | 195 | 2852930 | 8070.76 | 1436 | 1396 | 353.3 |
| D | 10 | 118 | 684297 | 1932.83 | 1436 | 1396 | 353.3 |
| D | 13 | 249 | 350821 | 988.99 | 1436 | 1396 | 353.3 |
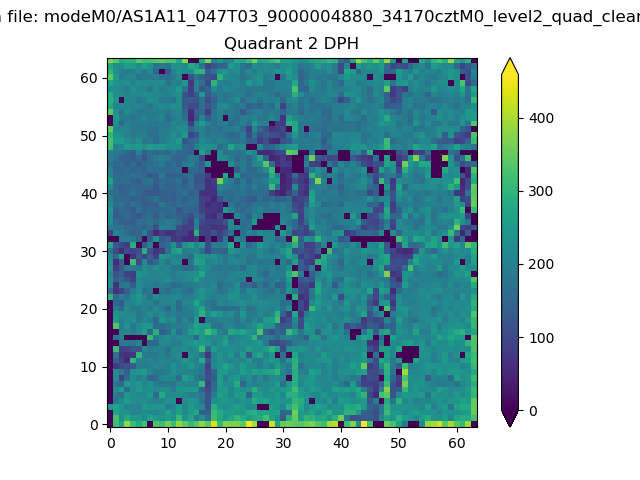
Histogram calculated using DETX and DETY for each event in the final _common_clean file
| Quadrant A | 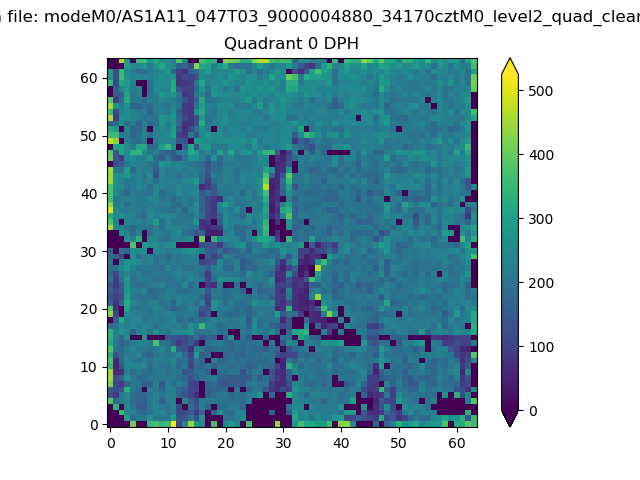 |
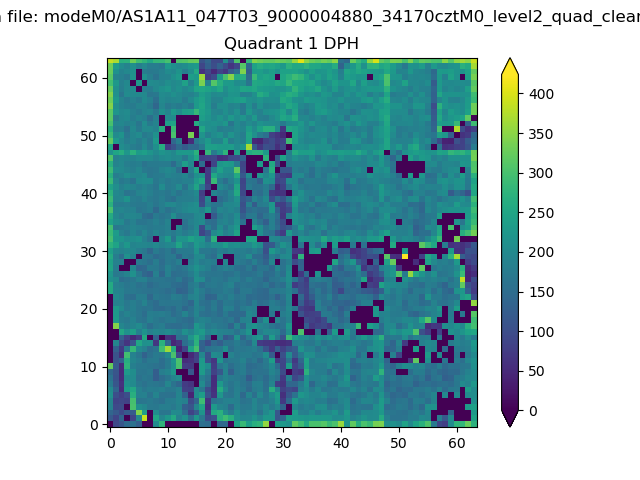 |
Quadrant B |
|---|---|---|---|
| Quadrant D | 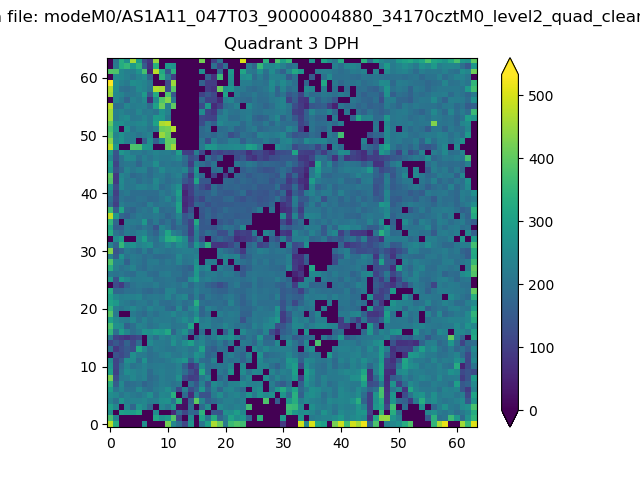 |
 |
Quadrant C |
| Plot type | Count rate plots | Images |
|---|---|---|
| Comparison with Poisson distribution Blue bars denote a histogram of data divided into 1 sec bins. Red curve is a Poisson curve with rate = median count rate of data. |
 |
 |
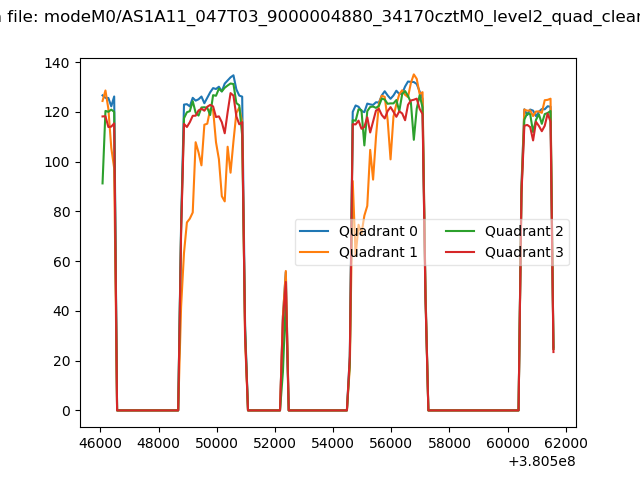
| Quadrant-wise count rates Data is divided into 100 sec bins |
 |
|
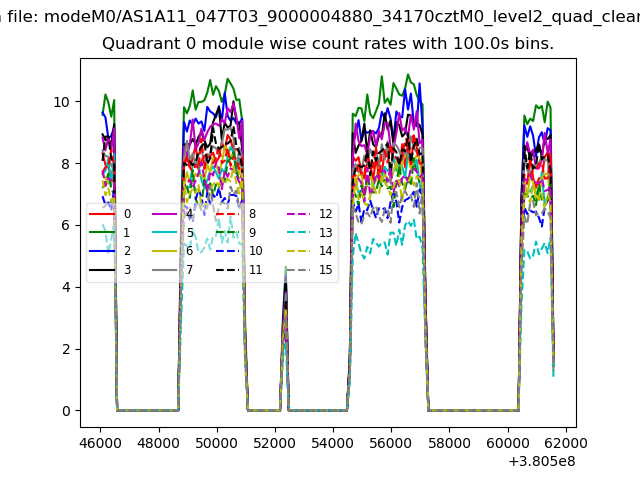
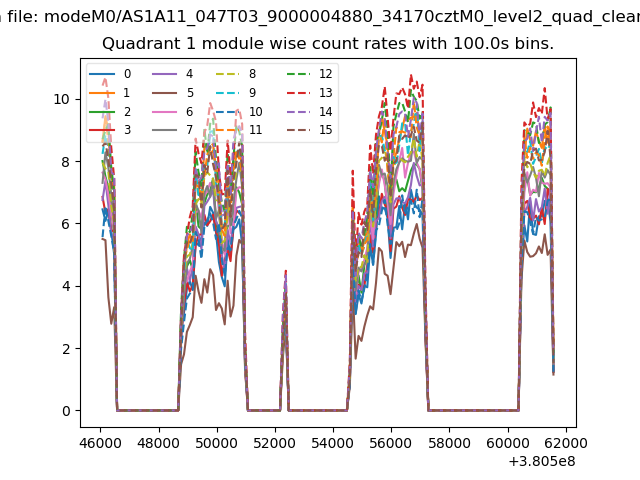
| Module-wise count rates for Quadrant A Data is divided into 100 sec bins |
 |
 |
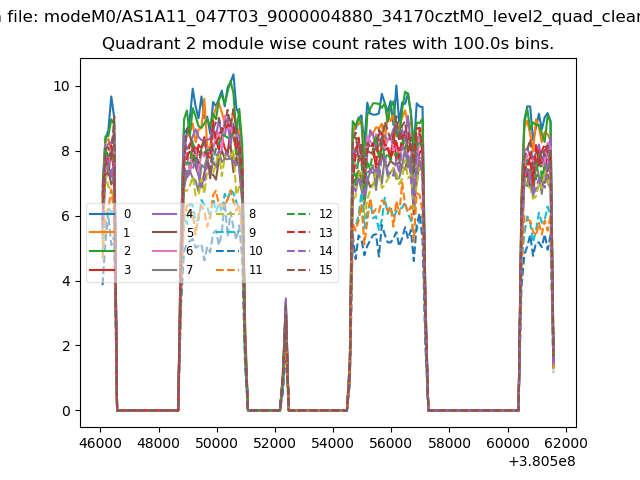
| Module-wise count rates for Quadrant B Data is divided into 100 sec bins |
 |
 |
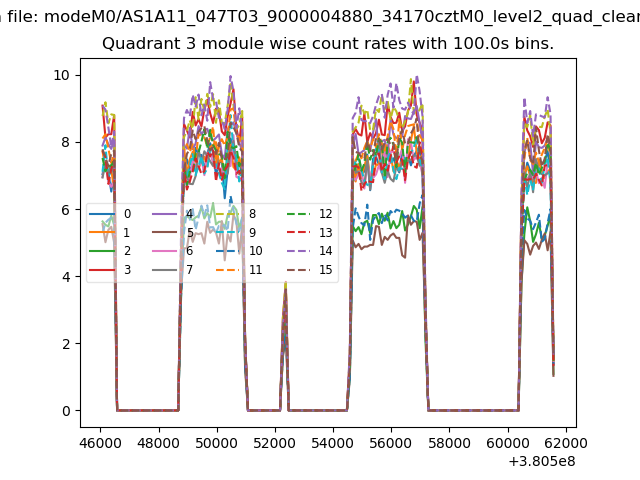
| Module-wise count rates for Quadrant C Data is divided into 100 sec bins |
 |
 |
| Module-wise count rates for Quadrant D Data is divided into 100 sec bins |
 |
 |
| Parameter | Plot |
|---|---|
| CZT HV Monitor | 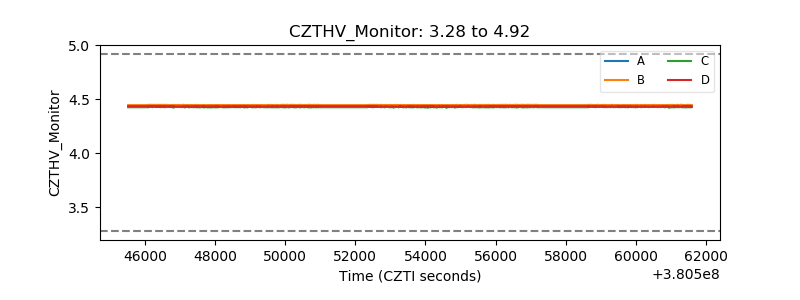 |
| D_VDD | 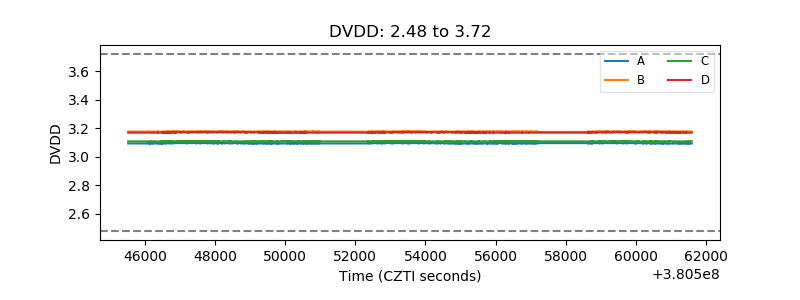 |
| Temperature 1 |  |
| Veto HV Monitor | 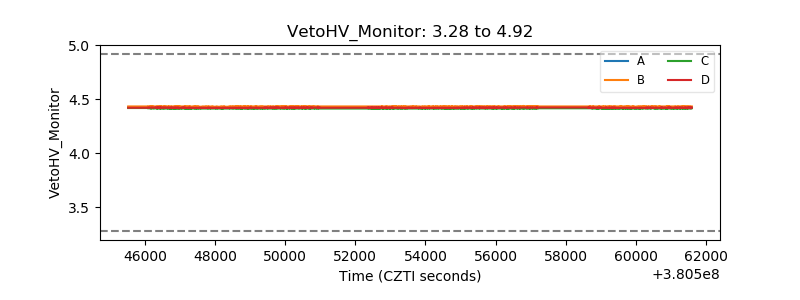 |
| Veto LLD | 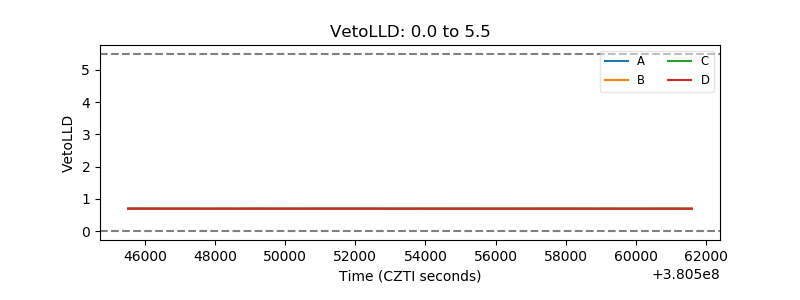 |
| Alpha Counter | 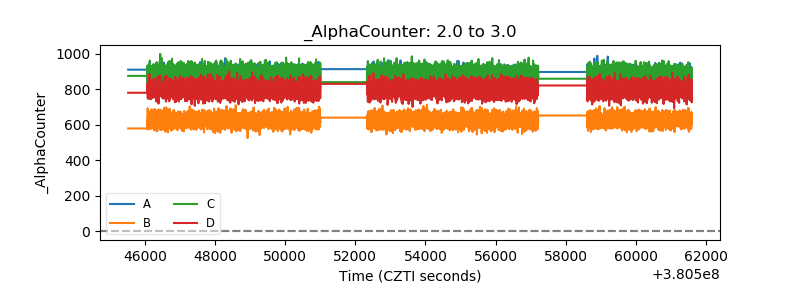 |
| _CPM_Rate | 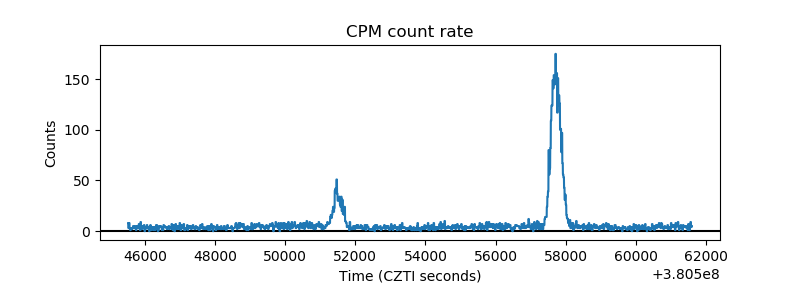 |
| CZT Counter | 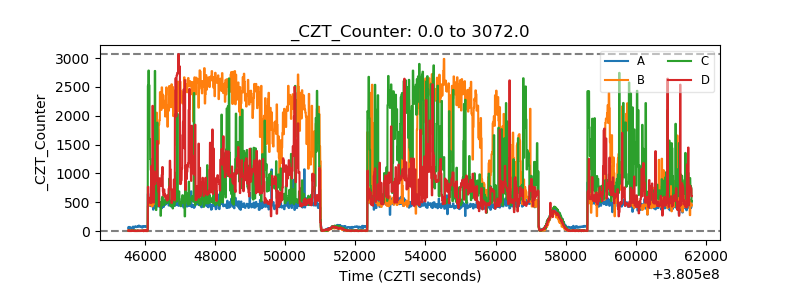 |
| +2.5 Volts monitor |  |
| +5 Volts monitor |  |
| _ROLL_ROT | 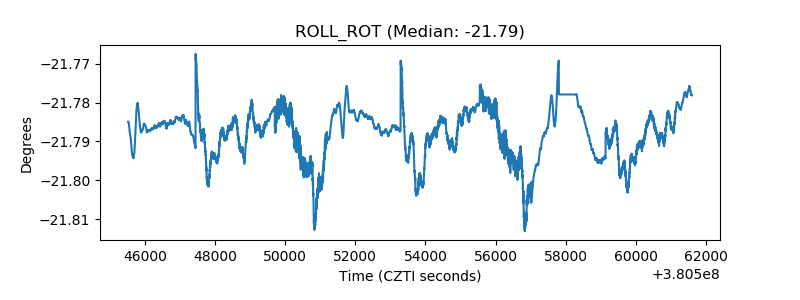 |
| _Roll_DEC | 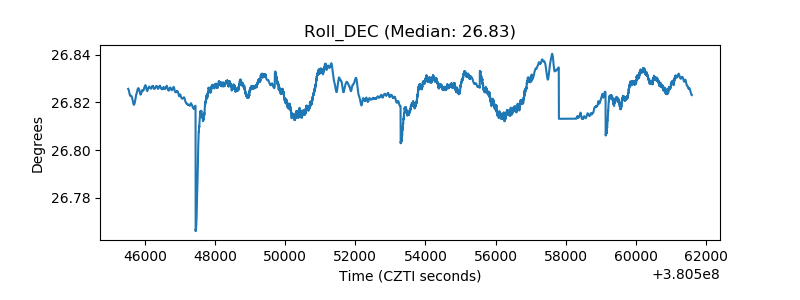 |
| _Roll_RA | 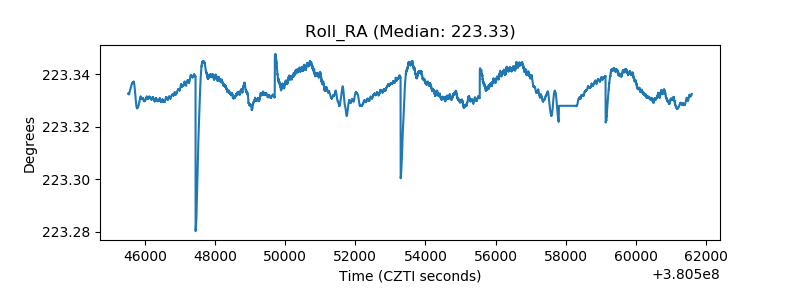 |
| Veto Counter | 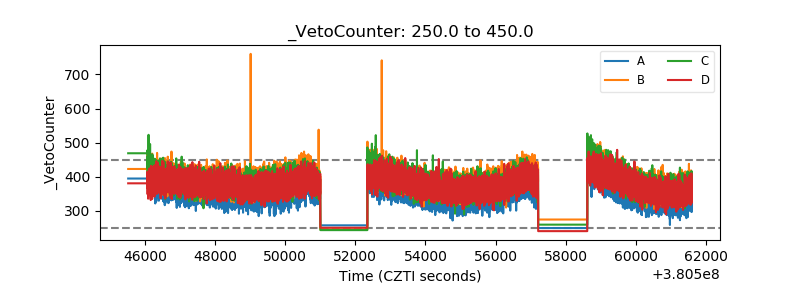 |