| Param | Original file | Final file |
|---|---|---|
| Filename | modeM0/AS1A11_047T15_9000004882cztM0_level2.fits | modeM0/AS1A11_047T15_9000004882cztM0_level2_quad_clean.evt |
| Size (bytes) | 1,361,079,360 | 1,428,333,120 |
| Size | 1.3 GB | 1.3 GB |
| Events in quadrant A | 8,550,970 | 9,034,170 |
| Events in quadrant B | 7,748,724 | 8,572,326 |
| Events in quadrant C | 8,171,936 | 8,388,029 |
| Events in quadrant D | 6,945,888 | 7,473,046 |
| Mode SS | |||
|---|---|---|---|
| Quadrant | BADHDUFLAG | Total packets | Discarded packets |
| A | 0 | 2922 | 0 |
| B | 0 | 2922 | 0 |
| C | 0 | 2922 | 0 |
| D | 0 | 2922 | 0 |
| Mode M9 | |||
|---|---|---|---|
| Quadrant | BADHDUFLAG | Total packets | Discarded packets |
| A | 0 | 551 | 0 |
| B | 0 | 551 | 0 |
| C | 0 | 551 | 0 |
| D | 0 | 551 | 0 |
| Mode M0 | |||
|---|---|---|---|
| Quadrant | BADHDUFLAG | Total packets | Discarded packets |
| A | 0 | 294369 | 0 |
| B | 0 | 465275 | 0 |
| C | 0 | 382139 | 0 |
| D | 0 | 468484 | 0 |
| Quadrant | Total seconds | Saturated seconds | Saturation percentage |
|---|---|---|---|
| A | 142911 | 493 | 0.344970% |
| B | 142911 | 16799 | 11.754868% |
| C | 142911 | 6146 | 4.300579% |
| D | 142911 | 8113 | 5.676960% |
Noise dominated data is calculated using 1-second bins in cleaned event files. If a bin has >2000 counts, and if more than 50% of those come from <1% of pixels, then it is considered to be noise-dominated and hence unusable.
| Quadrant | # 1 sec bins | Bins with >0 counts | Bins with >2000 counts | High rate bins dominated by noise | Noise dominated (total time) | Noise dominated (detector-on time) | Marked lightcurve |
|---|---|---|---|---|---|---|---|
| A | 197972 | 142912 | 0 | 0 | 0.00% | 0.00% | 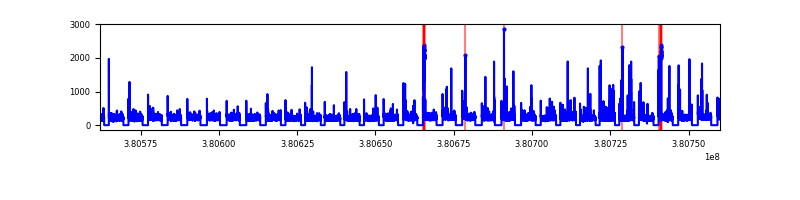 |
| B | 197972 | 142890 | 0 | 0 | 0.00% | 0.00% |  |
| C | 197972 | 142837 | 0 | 0 | 0.00% | 0.00% | 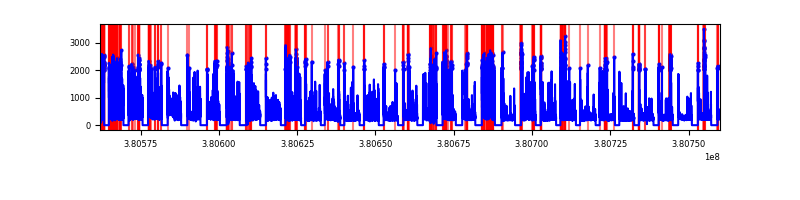 |
| D | 197971 | 142759 | 0 | 0 | 0.00% | 0.00% | 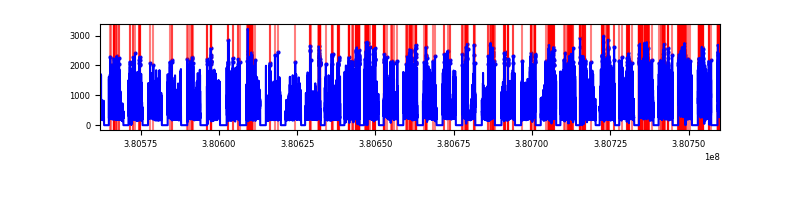 |
Top three noisy pixels from each quadrant. If the there are fewer than three noisy pixels in the level2.evt file, extra rows are filled as -1
| Pixel properties | Quadrant properties | ||||||
|---|---|---|---|---|---|---|---|
| Quadrant | DetID | PixID | Counts | Sigma | Mean | Median | Sigma |
| A | 9 | 19 | 7033 | 9.04 | 2230 | 2093 | 546.2 |
| A | 7 | 110 | 6897 | 8.8 | 2230 | 2093 | 546.2 |
| A | 0 | 29 | 6851 | 8.71 | 2230 | 2093 | 546.2 |
| B | 2 | 9 | 6834 | 12.23 | 2056 | 1966 | 398.0 |
| B | 3 | 80 | 6102 | 10.39 | 2056 | 1966 | 398.0 |
| B | 2 | 8 | 5528 | 8.95 | 2056 | 1966 | 398.0 |
| C | 1 | 81 | 6982 | 9.07 | 2161 | 2029 | 545.9 |
| C | 1 | 80 | 6696 | 8.55 | 2161 | 2029 | 545.9 |
| C | 3 | 202 | 6383 | 7.98 | 2161 | 2029 | 545.9 |
| D | 7 | 3 | 5164 | 6.37 | 1991 | 1822 | 524.5 |
| D | 10 | 113 | 5054 | 6.16 | 1991 | 1822 | 524.5 |
| D | 4 | 160 | 5030 | 6.12 | 1991 | 1822 | 524.5 |
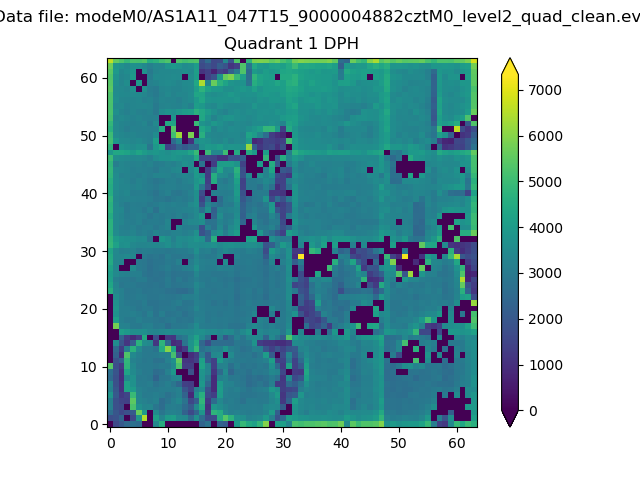
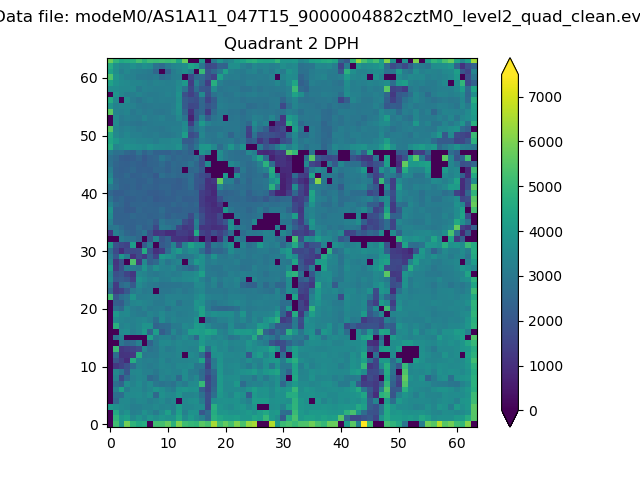
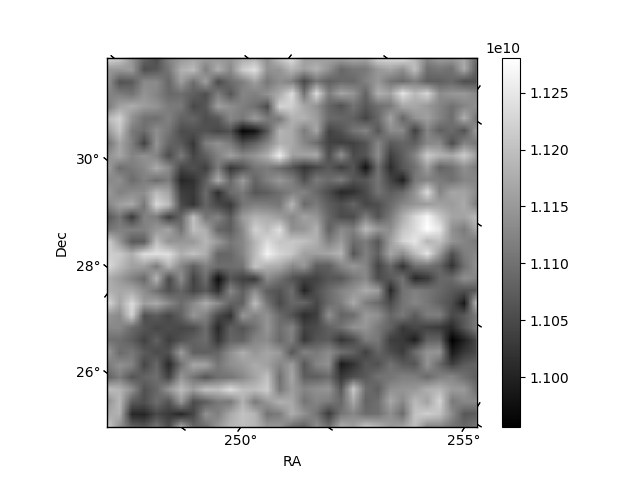
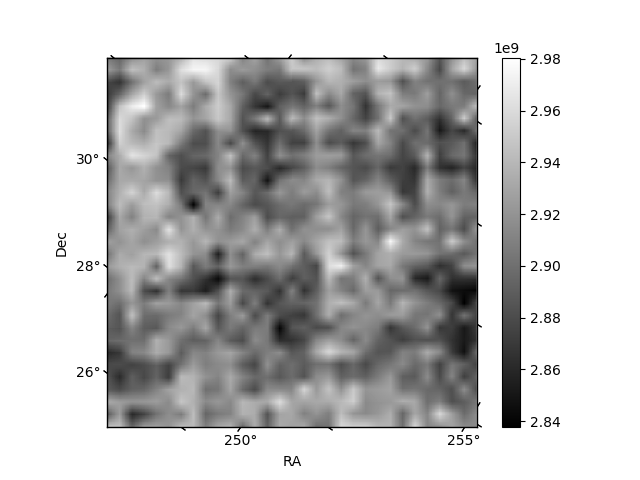
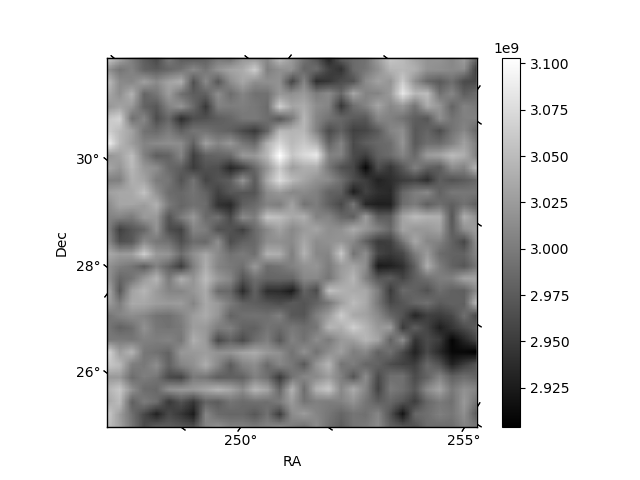
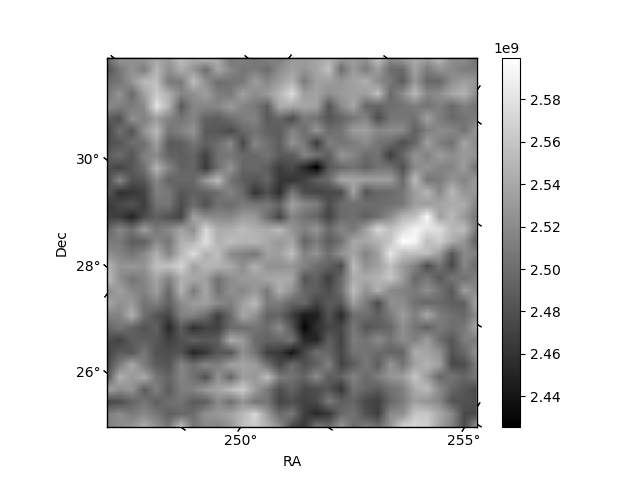
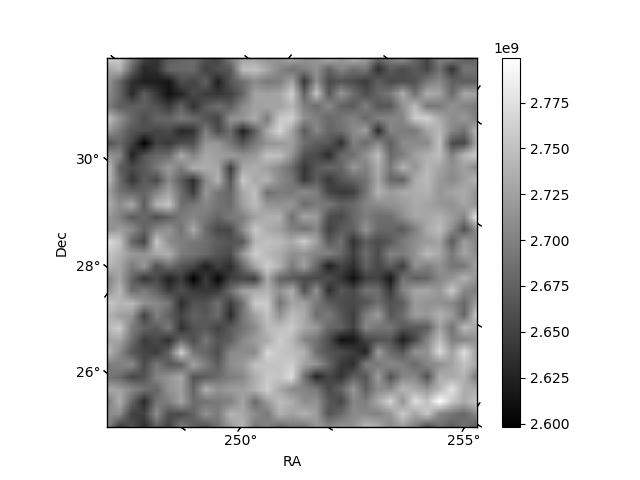
Histogram calculated using DETX and DETY for each event in the final _common_clean file
| Quadrant A | 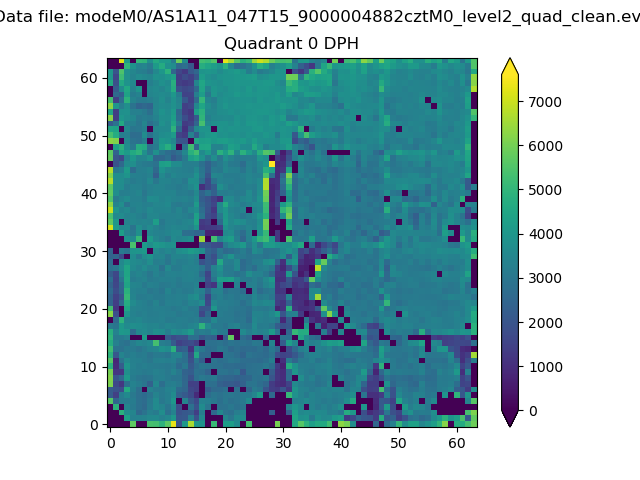 |
 |
Quadrant B |
|---|---|---|---|
| Quadrant D | 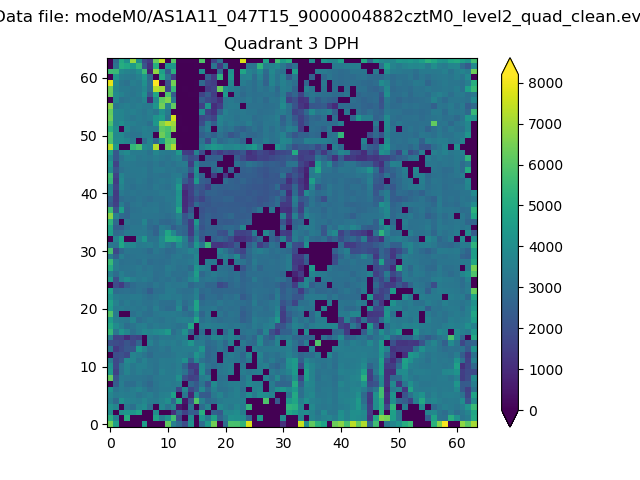 |
 |
Quadrant C |
| Plot type | Count rate plots | Images |
|---|---|---|
| Comparison with Poisson distribution Blue bars denote a histogram of data divided into 1 sec bins. Red curve is a Poisson curve with rate = median count rate of data. |
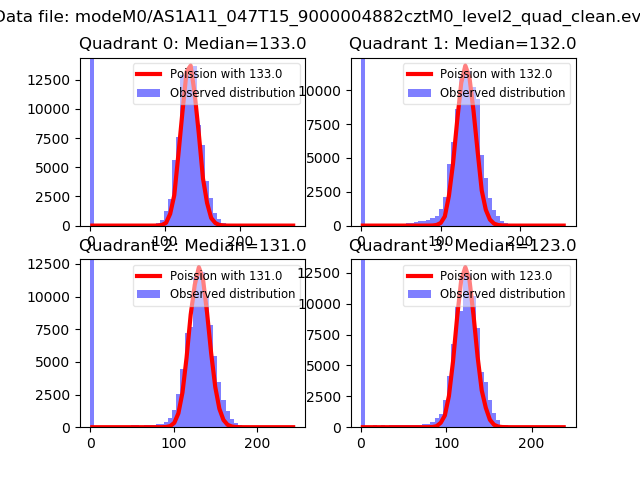 |
 |
| Quadrant-wise count rates Data is divided into 100 sec bins |
 |
|
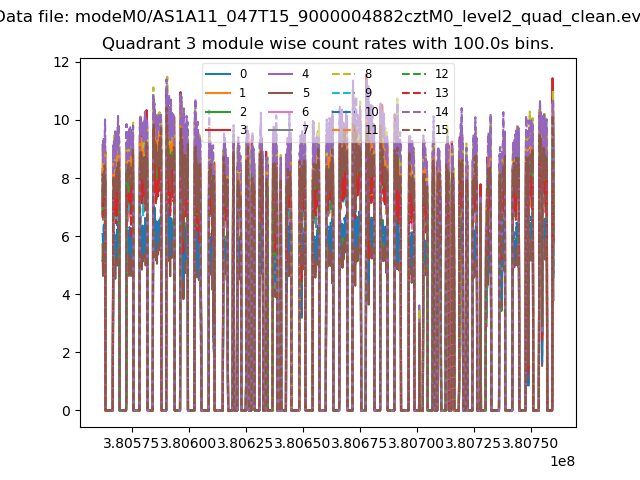
| Module-wise count rates for Quadrant A Data is divided into 100 sec bins |
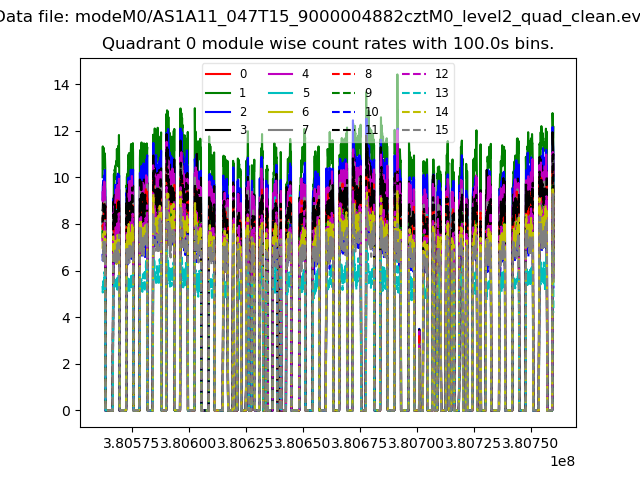 |
 |
| Module-wise count rates for Quadrant B Data is divided into 100 sec bins |
 |
 |
| Module-wise count rates for Quadrant C Data is divided into 100 sec bins |
 |
 |
| Module-wise count rates for Quadrant D Data is divided into 100 sec bins |
 |
 |
| Parameter | Plot |
|---|---|
| CZT HV Monitor | 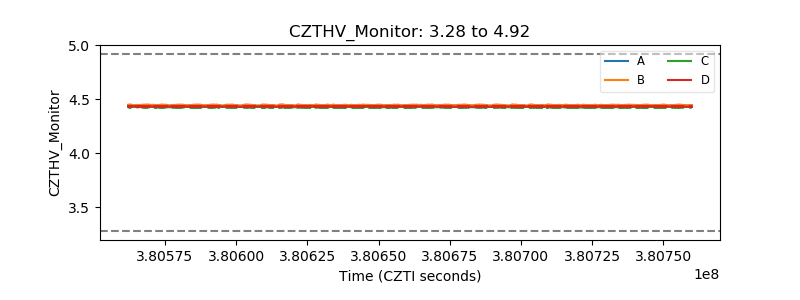 |
| D_VDD | 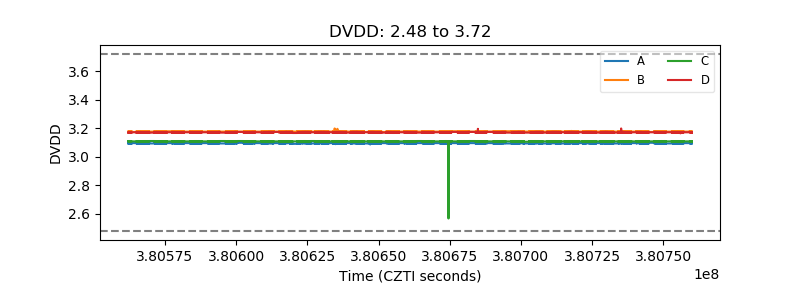 |
| Temperature 1 | 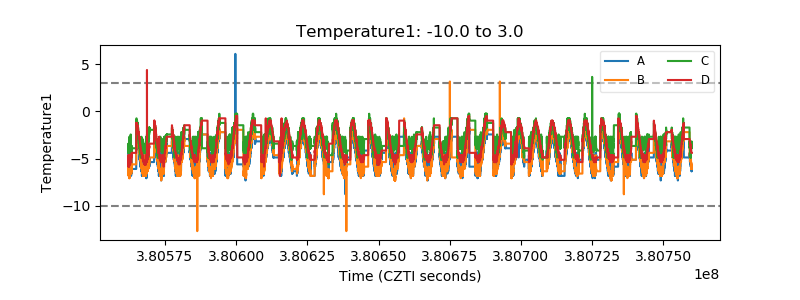 |
| Veto HV Monitor | 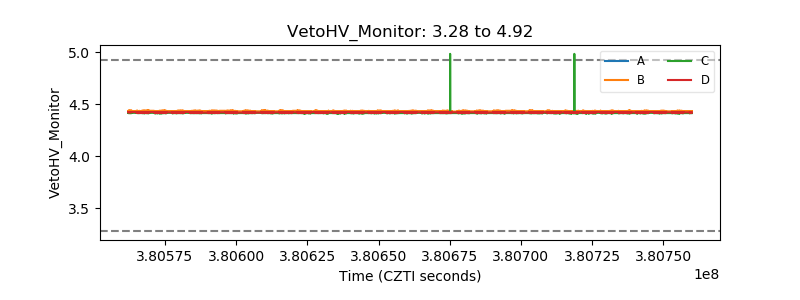 |
| Veto LLD | 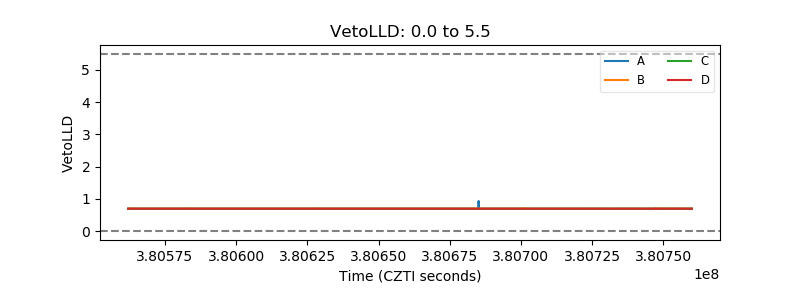 |
| Alpha Counter |  |
| _CPM_Rate | 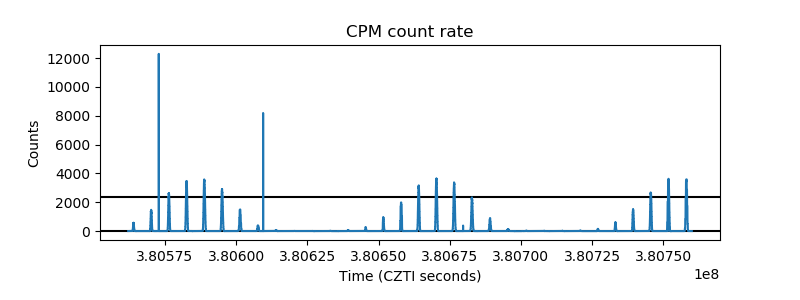 |
| CZT Counter | 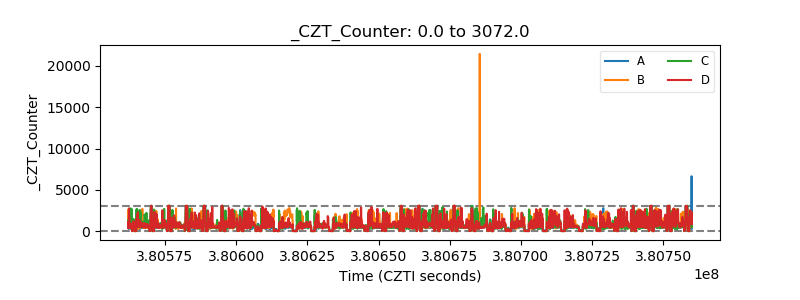 |
| +2.5 Volts monitor |  |
| +5 Volts monitor | 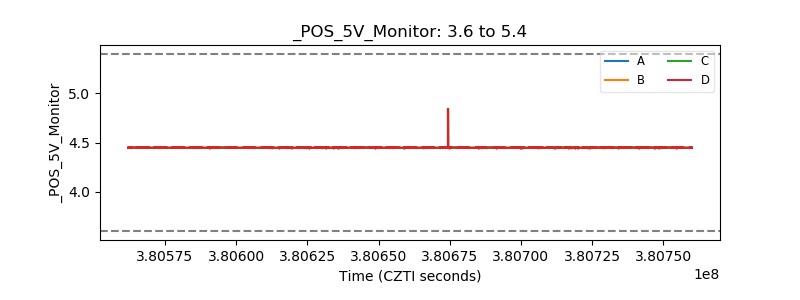 |
| _ROLL_ROT | 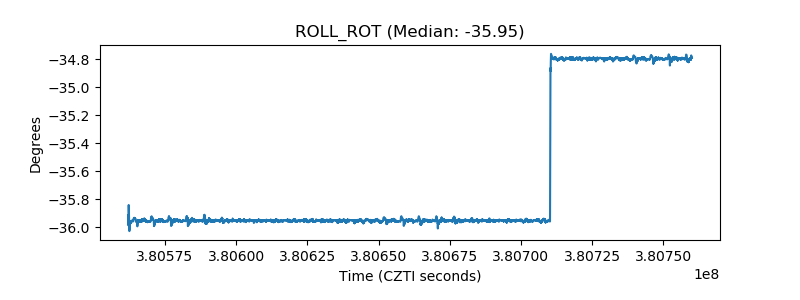 |
| _Roll_DEC | 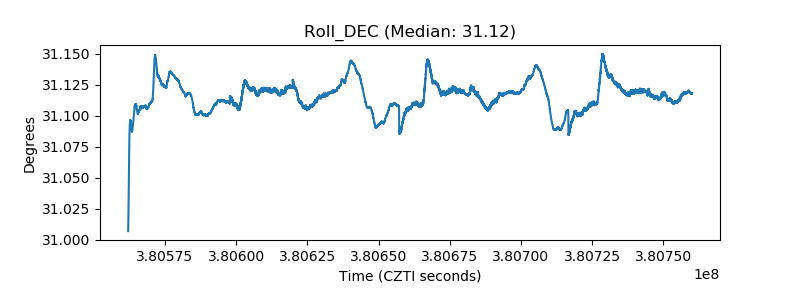 |
| _Roll_RA |  |
| Veto Counter | 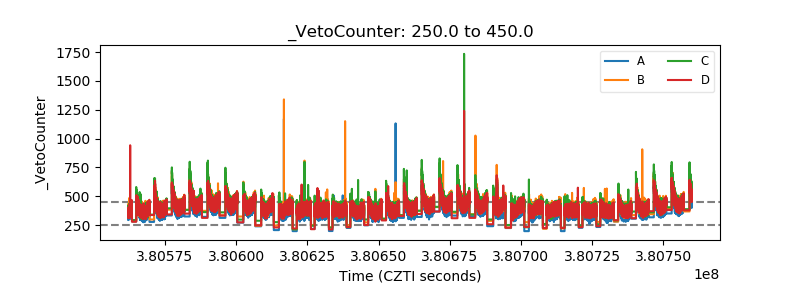 |