| Param | Original file | Final file |
|---|---|---|
| Filename | modeM0/AS1A11_047T15_9000004882_34171cztM0_level2.evt | modeM0/AS1A11_047T15_9000004882_34171cztM0_level2_quad_clean.evt |
| Size (bytes) | 572,739,840 | 58,890,240 |
| Size | 546.2 MB | 56.2 MB |
| Events in quadrant A | 2,660,073 | 357,101 |
| Events in quadrant B | 3,464,537 | 358,273 |
| Events in quadrant C | 6,330,666 | 344,912 |
| Events in quadrant D | 4,517,086 | 336,611 |
| Mode SS | |||
|---|---|---|---|
| Quadrant | BADHDUFLAG | Total packets | Discarded packets |
| A | 0 | 112 | 0 |
| B | 0 | 112 | 0 |
| C | 0 | 112 | 0 |
| D | 0 | 112 | 0 |
| Mode M9 | |||
|---|---|---|---|
| Quadrant | BADHDUFLAG | Total packets | Discarded packets |
| A | 0 | 26 | 0 |
| B | 0 | 26 | 0 |
| C | 0 | 26 | 0 |
| D | 0 | 27 | 0 |
| Mode M0 | |||
|---|---|---|---|
| Quadrant | BADHDUFLAG | Total packets | Discarded packets |
| A | 0 | 11453 | 3 |
| B | 0 | 13912 | 2 |
| C | 0 | 22570 | 2 |
| D | 0 | 17248 | 2 |
| Quadrant | Total seconds | Saturated seconds | Saturation percentage |
|---|---|---|---|
| A | 5516 | 20 | 0.362582% |
| B | 5516 | 266 | 4.822335% |
| C | 5516 | 889 | 16.116751% |
| D | 5516 | 174 | 3.154460% |
Noise dominated data is calculated using 1-second bins in cleaned event files. If a bin has >2000 counts, and if more than 50% of those come from <1% of pixels, then it is considered to be noise-dominated and hence unusable.
| Quadrant | # 1 sec bins | Bins with >0 counts | Bins with >2000 counts | High rate bins dominated by noise | Noise dominated (total time) | Noise dominated (detector-on time) | Marked lightcurve |
|---|---|---|---|---|---|---|---|
| A | 7158 | 5517 | 3 | 3 | 0.04% | 0.05% | 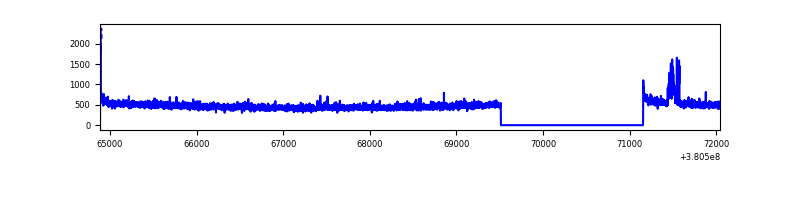 |
| B | 7158 | 5517 | 174 | 174 | 2.43% | 3.15% | 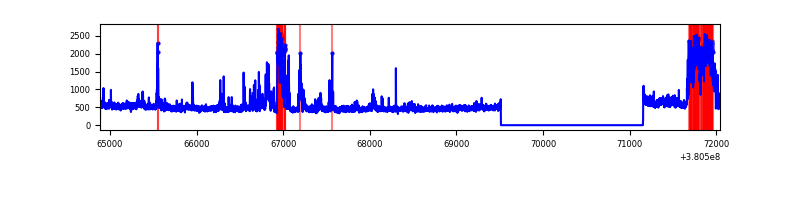 |
| C | 7158 | 5517 | 787 | 787 | 10.99% | 14.26% | 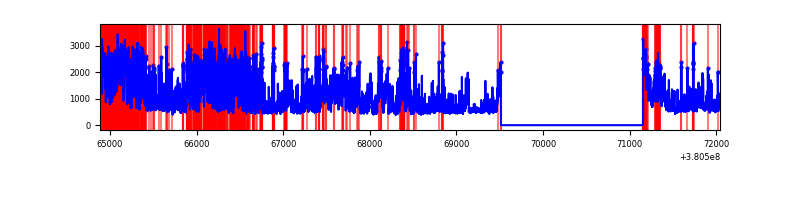 |
| D | 7157 | 5516 | 116 | 116 | 1.62% | 2.10% | 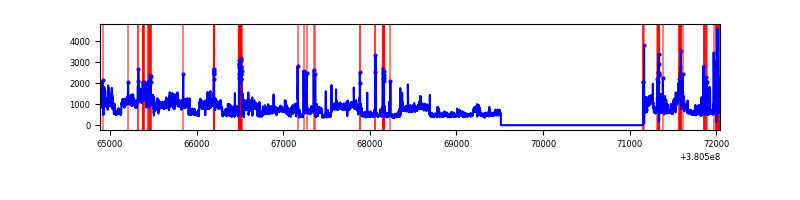 |
Top three noisy pixels from each quadrant. If the there are fewer than three noisy pixels in the level2.evt file, extra rows are filled as -1
| Pixel properties | Quadrant properties | ||||||
|---|---|---|---|---|---|---|---|
| Quadrant | DetID | PixID | Counts | Sigma | Mean | Median | Sigma |
| A | 15 | 169 | 58613 | 432.36 | 662 | 650 | 134.1 |
| A | 10 | 83 | 22090 | 159.93 | 662 | 650 | 134.1 |
| A | 15 | 17 | 15164 | 108.26 | 662 | 650 | 134.1 |
| B | 5 | 31 | 351729 | 2767.57 | 654 | 638 | 126.9 |
| B | 5 | 15 | 247263 | 1944.09 | 654 | 638 | 126.9 |
| B | 4 | 232 | 87248 | 682.73 | 654 | 638 | 126.9 |
| C | 0 | 239 | 3361782 | 23722.93 | 612 | 615 | 141.7 |
| C | 0 | 10 | 320519 | 2257.86 | 612 | 615 | 141.7 |
| C | 15 | 214 | 224506 | 1580.21 | 612 | 615 | 141.7 |
| D | 8 | 195 | 1366052 | 8626.81 | 637 | 620 | 158.3 |
| D | 13 | 249 | 281557 | 1774.96 | 637 | 620 | 158.3 |
| D | 1 | 52 | 111370 | 699.72 | 637 | 620 | 158.3 |
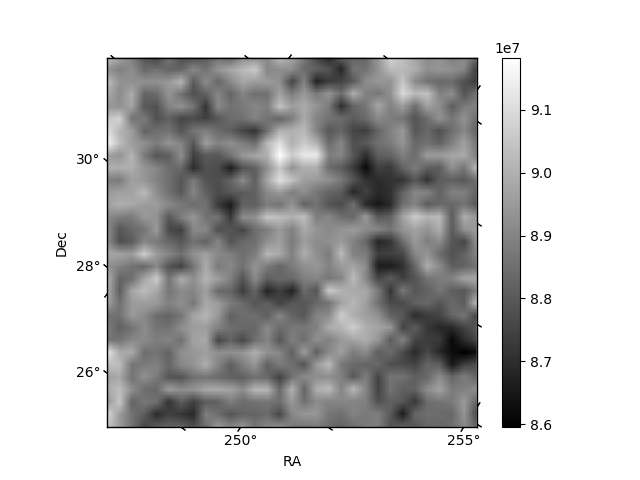
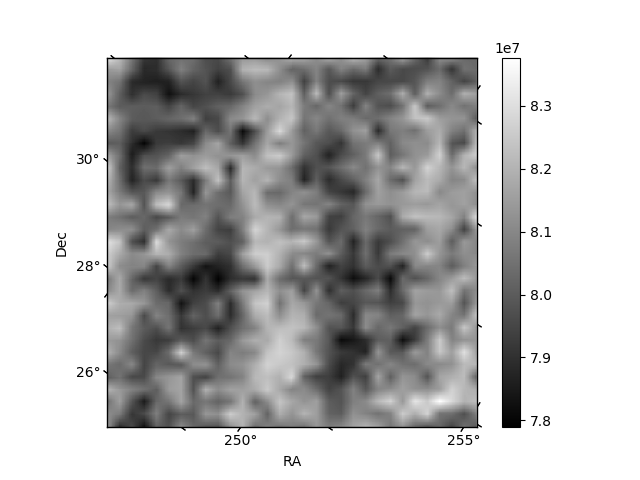
Histogram calculated using DETX and DETY for each event in the final _common_clean file
| Quadrant A | 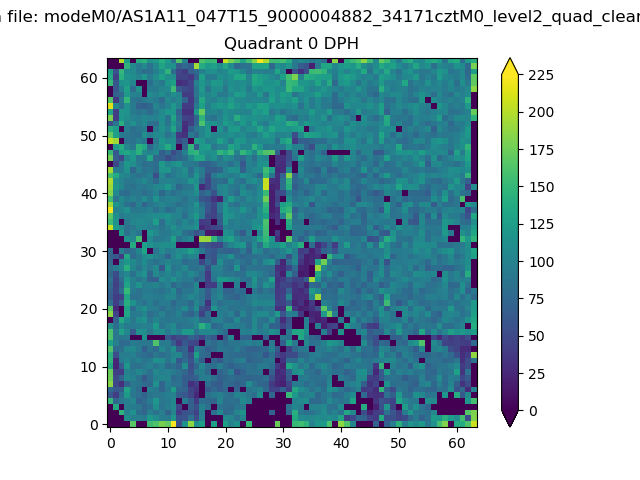 |
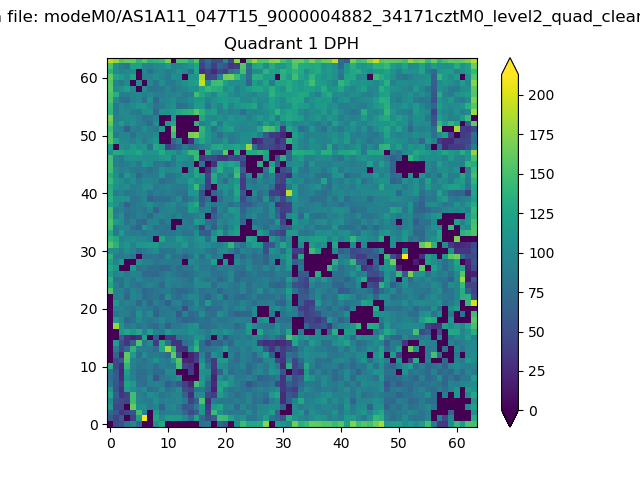 |
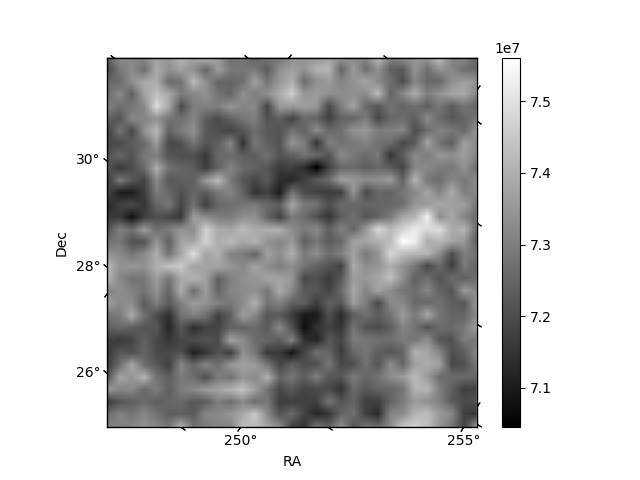
Quadrant B |
|---|---|---|---|
| Quadrant D | 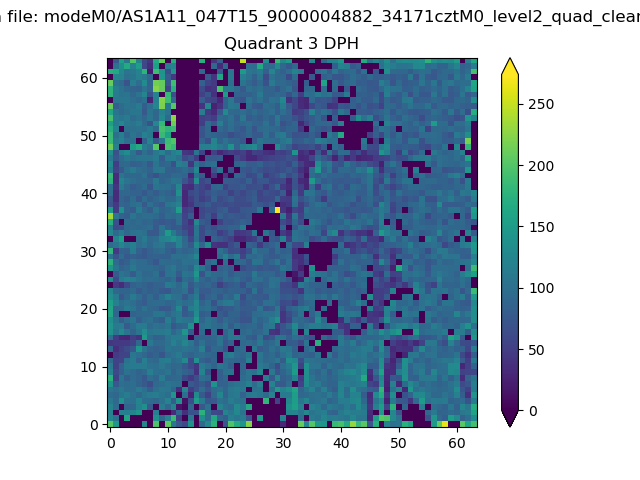 |
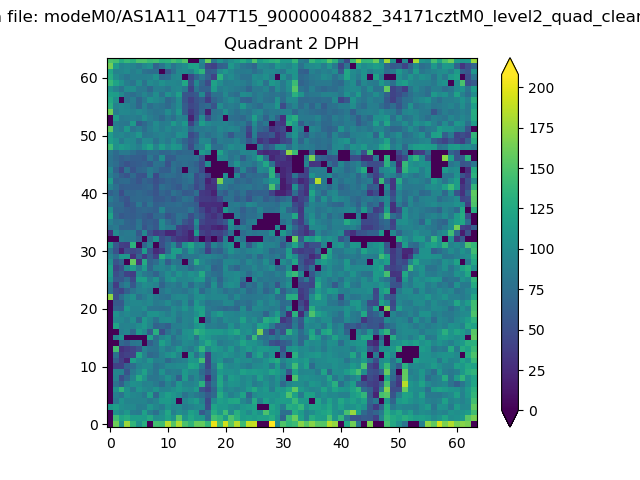 |
Quadrant C |
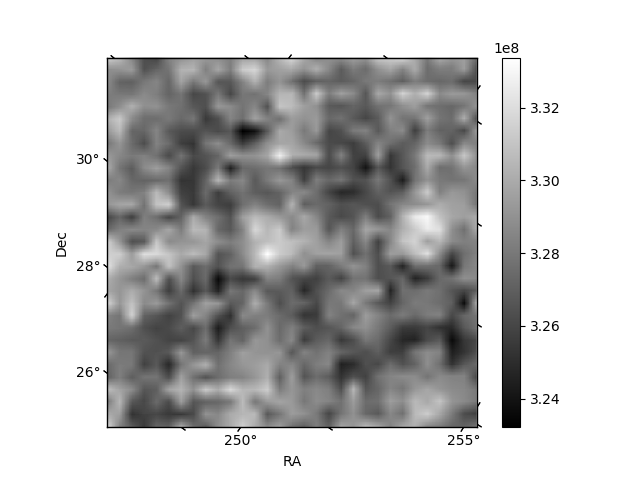
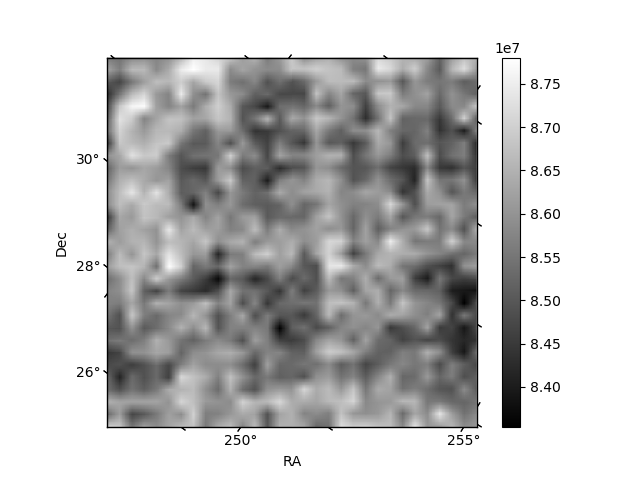
| Plot type | Count rate plots | Images |
|---|---|---|
| Comparison with Poisson distribution Blue bars denote a histogram of data divided into 1 sec bins. Red curve is a Poisson curve with rate = median count rate of data. |
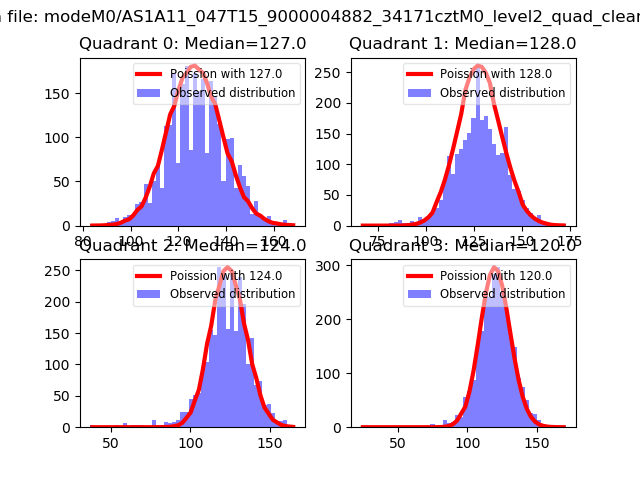 |
 |
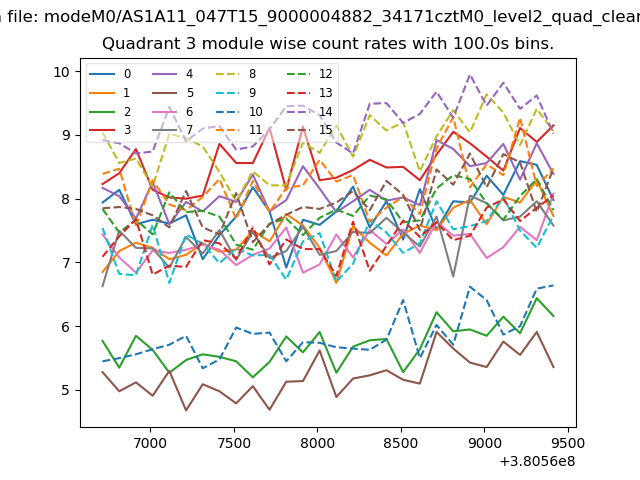
| Quadrant-wise count rates Data is divided into 100 sec bins |
 |
|
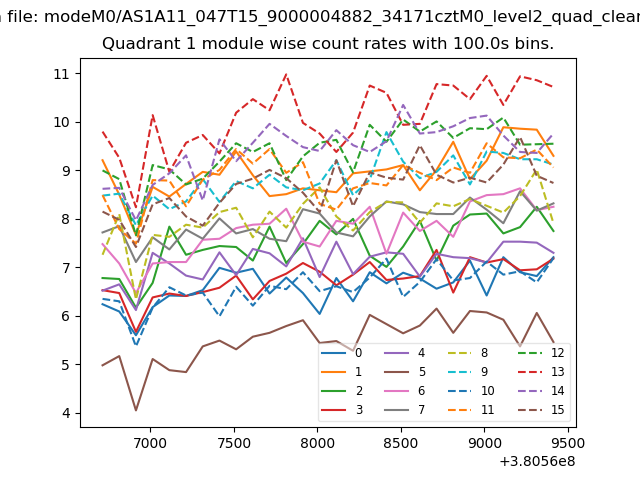
| Module-wise count rates for Quadrant A Data is divided into 100 sec bins |
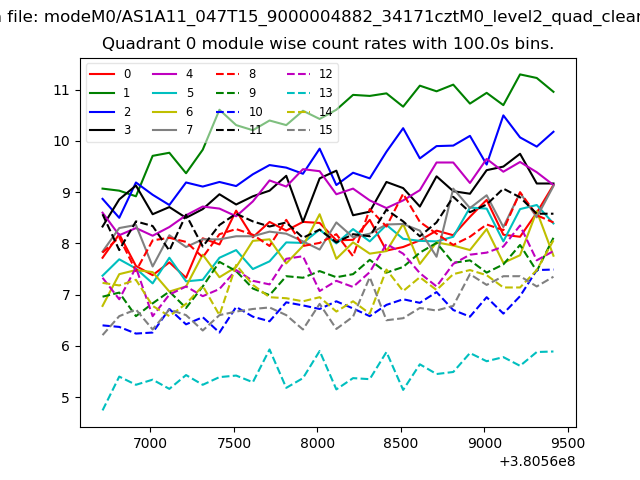 |
 |
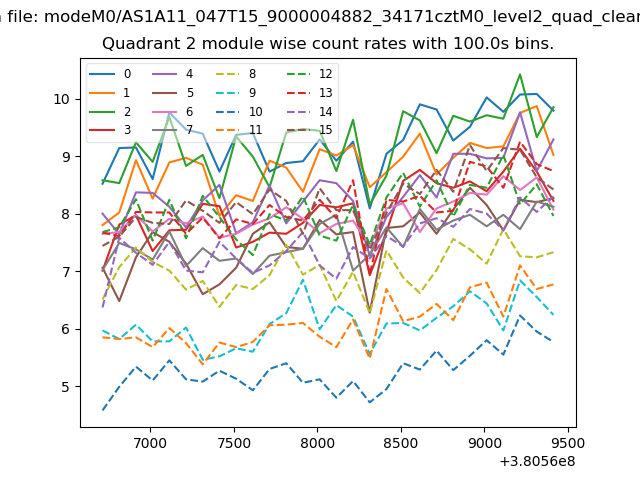
| Module-wise count rates for Quadrant B Data is divided into 100 sec bins |
 |
 |
| Module-wise count rates for Quadrant C Data is divided into 100 sec bins |
 |
 |
| Module-wise count rates for Quadrant D Data is divided into 100 sec bins |
 |
 |
| Parameter | Plot |
|---|---|
| CZT HV Monitor | 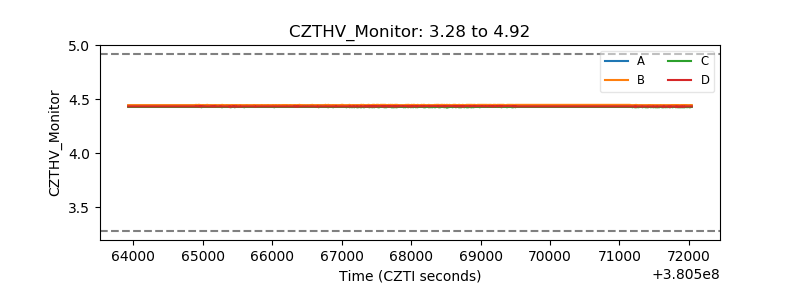 |
| D_VDD | 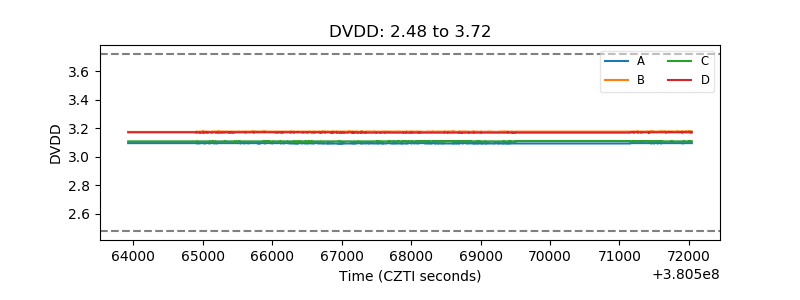 |
| Temperature 1 | 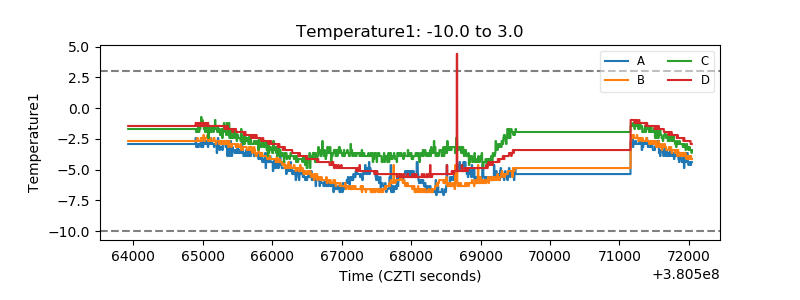 |
| Veto HV Monitor | 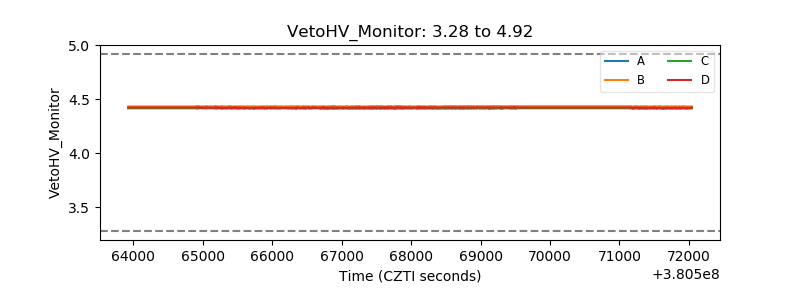 |
| Veto LLD | 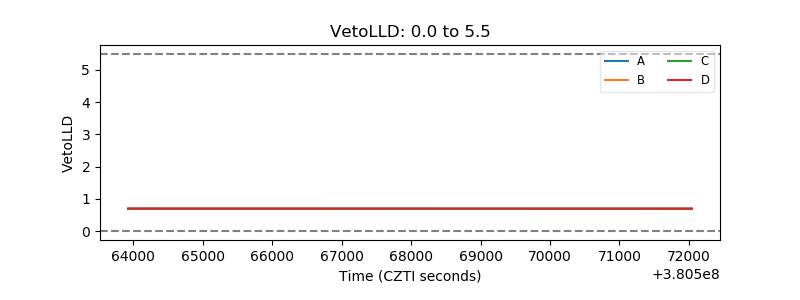 |
| Alpha Counter |  |
| _CPM_Rate | 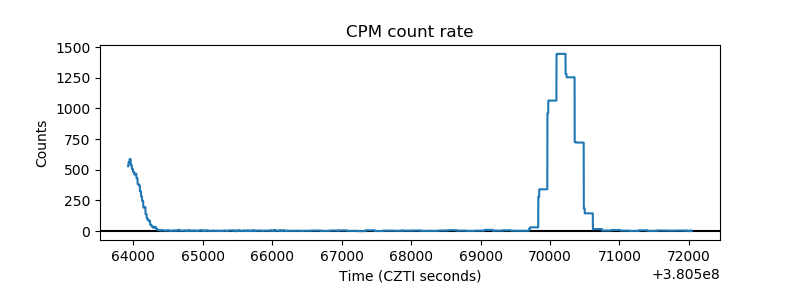 |
| CZT Counter | 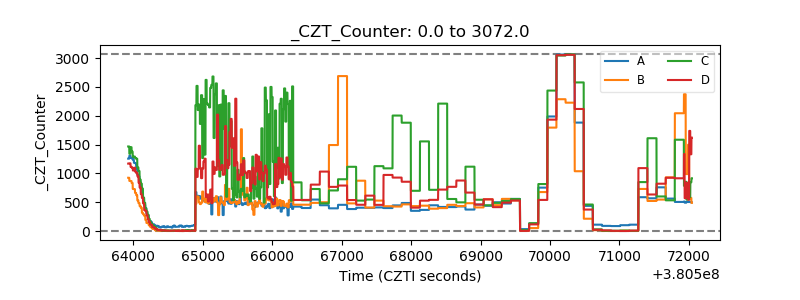 |
| +2.5 Volts monitor |  |
| +5 Volts monitor |  |
| _ROLL_ROT | 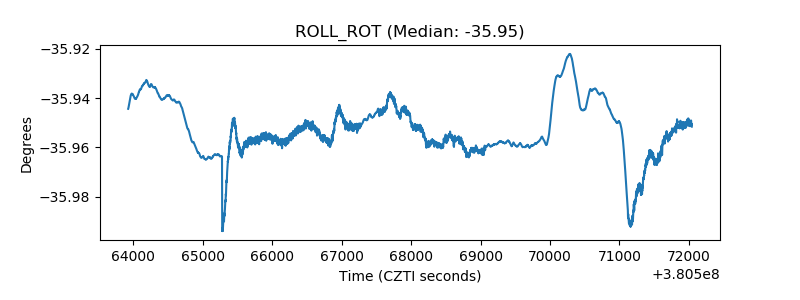 |
| _Roll_DEC | 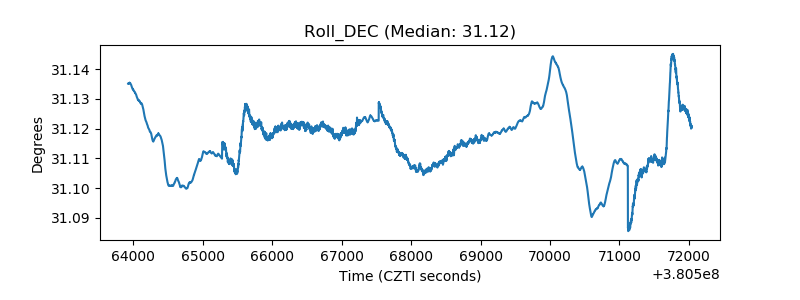 |
| _Roll_RA | 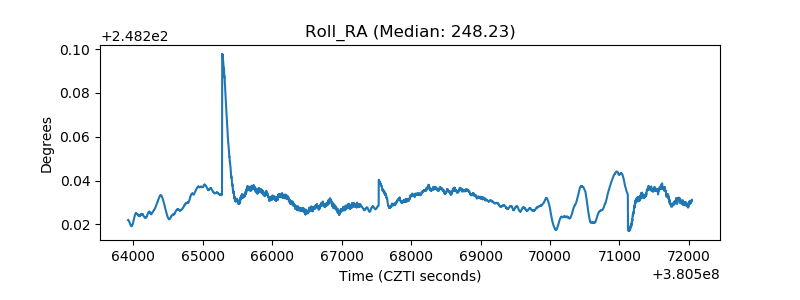 |
| Veto Counter | 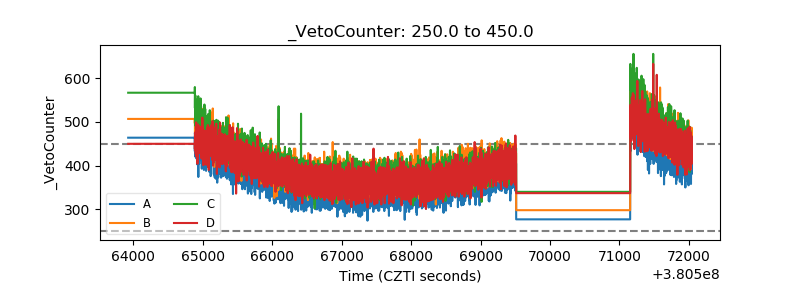 |