| Param | Original file | Final file |
|---|---|---|
| Filename | modeM0/AS1A11_047T15_9000004882_34173cztM0_level2.evt | modeM0/AS1A11_047T15_9000004882_34173cztM0_level2_quad_clean.evt |
| Size (bytes) | 522,685,440 | 64,232,640 |
| Size | 498.5 MB | 61.3 MB |
| Events in quadrant A | 2,661,168 | 397,776 |
| Events in quadrant B | 3,617,789 | 403,440 |
| Events in quadrant C | 4,821,582 | 391,853 |
| Events in quadrant D | 4,364,011 | 374,319 |
| Mode SS | |||
|---|---|---|---|
| Quadrant | BADHDUFLAG | Total packets | Discarded packets |
| A | 0 | 110 | 0 |
| B | 0 | 110 | 0 |
| C | 0 | 110 | 0 |
| D | 0 | 110 | 0 |
| Mode M9 | |||
|---|---|---|---|
| Quadrant | BADHDUFLAG | Total packets | Discarded packets |
| A | 0 | 29 | 0 |
| B | 0 | 29 | 0 |
| C | 0 | 29 | 0 |
| D | 0 | 30 | 0 |
| Mode M0 | |||
|---|---|---|---|
| Quadrant | BADHDUFLAG | Total packets | Discarded packets |
| A | 0 | 11439 | 3 |
| B | 0 | 14289 | 2 |
| C | 0 | 18185 | 2 |
| D | 0 | 16722 | 2 |
| Quadrant | Total seconds | Saturated seconds | Saturation percentage |
|---|---|---|---|
| A | 5391 | 15 | 0.278242% |
| B | 5391 | 259 | 4.804303% |
| C | 5391 | 412 | 7.642367% |
| D | 5391 | 220 | 4.080876% |
Noise dominated data is calculated using 1-second bins in cleaned event files. If a bin has >2000 counts, and if more than 50% of those come from <1% of pixels, then it is considered to be noise-dominated and hence unusable.
| Quadrant | # 1 sec bins | Bins with >0 counts | Bins with >2000 counts | High rate bins dominated by noise | Noise dominated (total time) | Noise dominated (detector-on time) | Marked lightcurve |
|---|---|---|---|---|---|---|---|
| A | 7154 | 5392 | 0 | 0 | 0.00% | 0.00% | 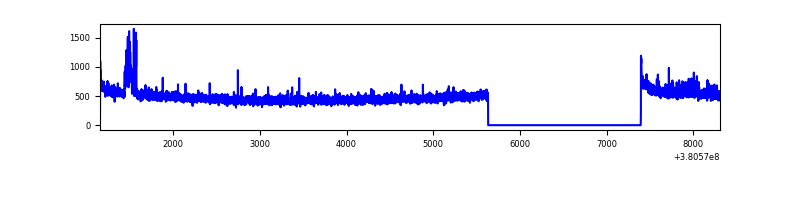 |
| B | 7154 | 5392 | 139 | 139 | 1.94% | 2.58% | 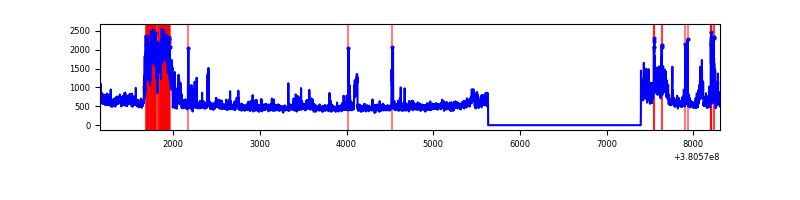 |
| C | 7154 | 5392 | 313 | 313 | 4.38% | 5.80% | 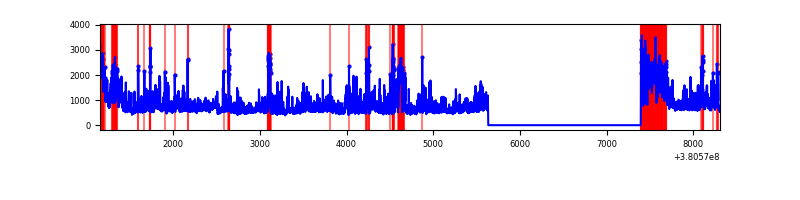 |
| D | 7154 | 5392 | 141 | 141 | 1.97% | 2.61% | 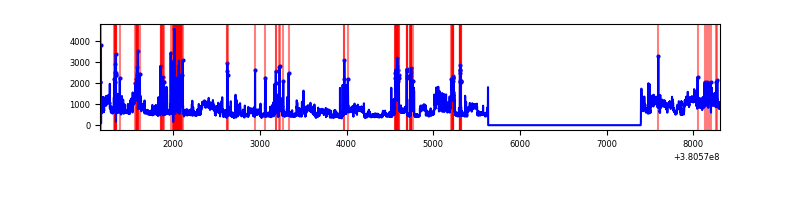 |
Top three noisy pixels from each quadrant. If the there are fewer than three noisy pixels in the level2.evt file, extra rows are filled as -1
| Pixel properties | Quadrant properties | ||||||
|---|---|---|---|---|---|---|---|
| Quadrant | DetID | PixID | Counts | Sigma | Mean | Median | Sigma |
| A | 15 | 169 | 79774 | 592.13 | 660 | 645 | 133.6 |
| A | 10 | 83 | 22838 | 166.07 | 660 | 645 | 133.6 |
| A | 13 | 254 | 10514 | 73.85 | 660 | 645 | 133.6 |
| B | 5 | 31 | 286789 | 2297.81 | 652 | 635 | 124.5 |
| B | 5 | 15 | 217661 | 1742.71 | 652 | 635 | 124.5 |
| B | 5 | 172 | 112036 | 894.55 | 652 | 635 | 124.5 |
| C | 0 | 239 | 1439751 | 9931.92 | 627 | 631 | 144.9 |
| C | 0 | 10 | 698902 | 4819.04 | 627 | 631 | 144.9 |
| C | 15 | 214 | 225134 | 1549.38 | 627 | 631 | 144.9 |
| D | 8 | 195 | 1102968 | 6982.23 | 635 | 617 | 157.9 |
| D | 13 | 249 | 451309 | 2854.66 | 635 | 617 | 157.9 |
| D | 10 | 118 | 157931 | 996.42 | 635 | 617 | 157.9 |
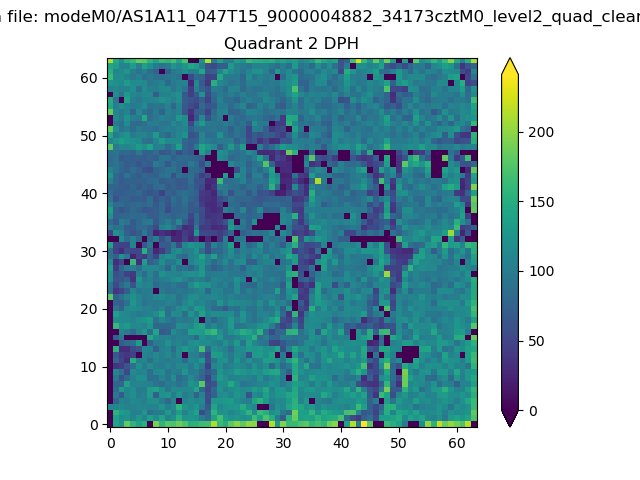
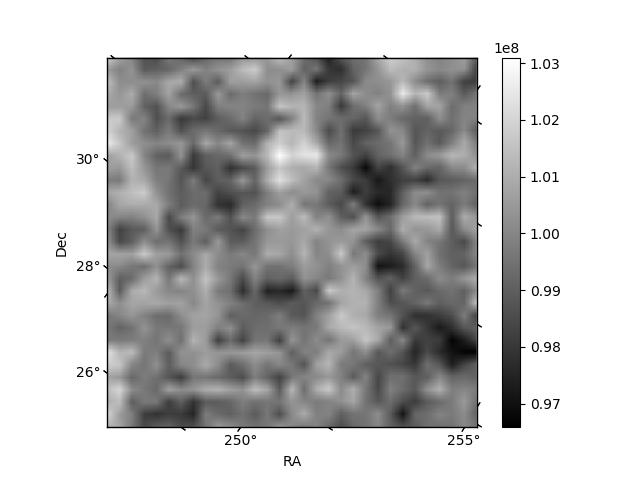
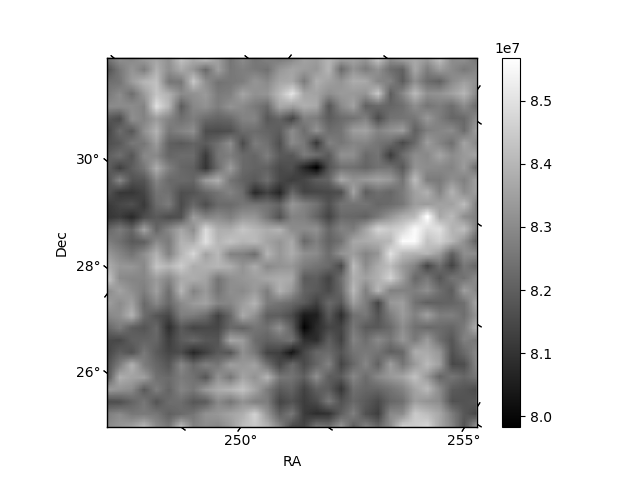
Histogram calculated using DETX and DETY for each event in the final _common_clean file
| Quadrant A | 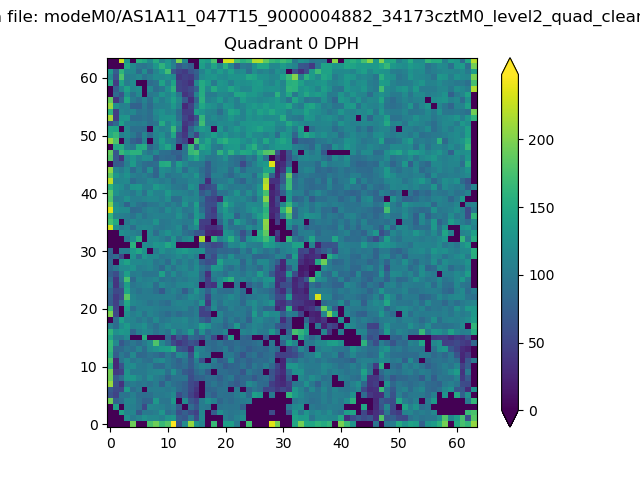 |
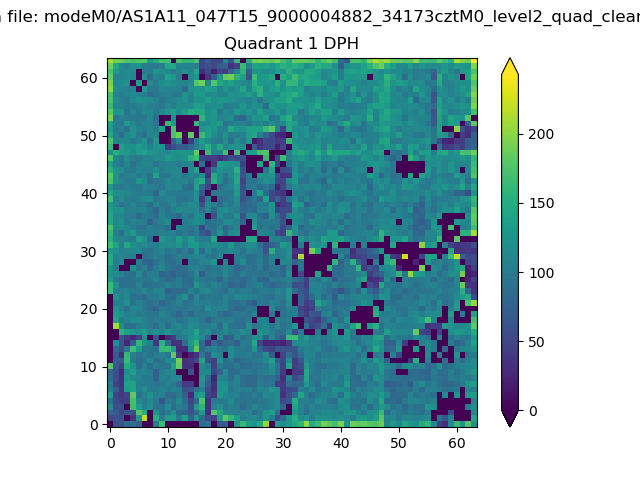 |
Quadrant B |
|---|---|---|---|
| Quadrant D | 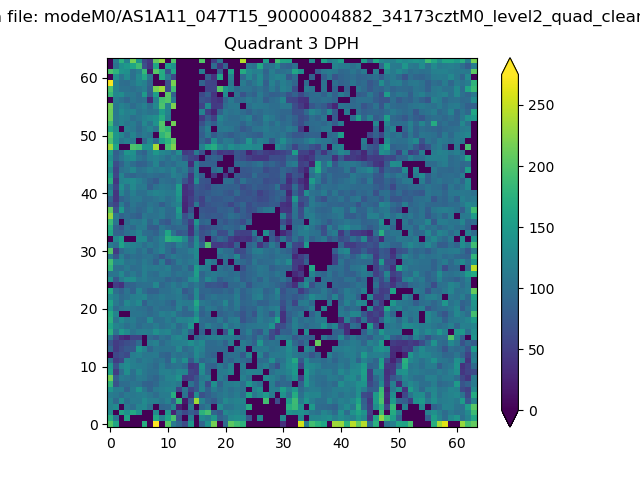 |
 |
Quadrant C |
| Plot type | Count rate plots | Images |
|---|---|---|
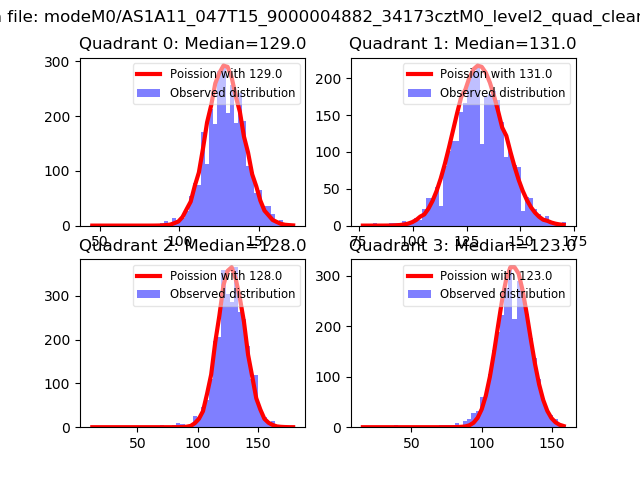
| Comparison with Poisson distribution Blue bars denote a histogram of data divided into 1 sec bins. Red curve is a Poisson curve with rate = median count rate of data. |
 |
 |
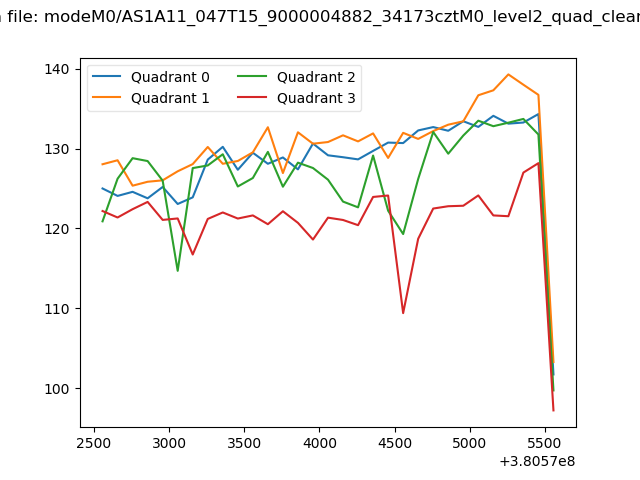
| Quadrant-wise count rates Data is divided into 100 sec bins |
 |
|
| Module-wise count rates for Quadrant A Data is divided into 100 sec bins |
 |
 |
| Module-wise count rates for Quadrant B Data is divided into 100 sec bins |
 |
 |
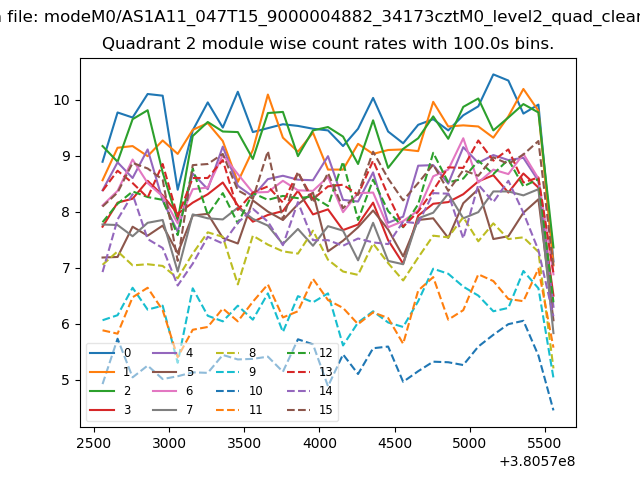
| Module-wise count rates for Quadrant C Data is divided into 100 sec bins |
 |
 |
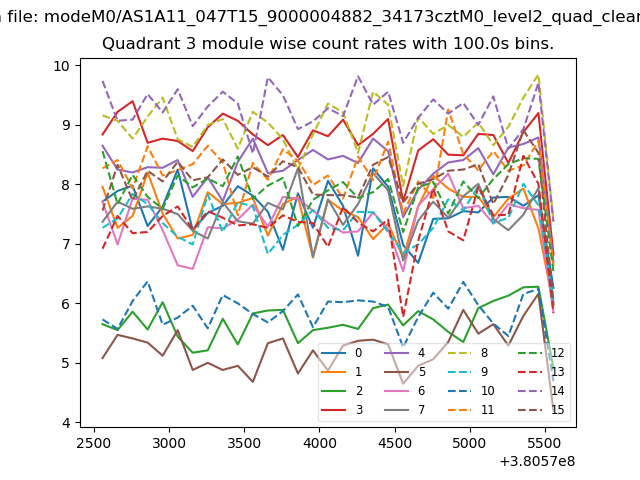
| Module-wise count rates for Quadrant D Data is divided into 100 sec bins |
 |
 |
| Parameter | Plot |
|---|---|
| CZT HV Monitor |  |
| D_VDD | 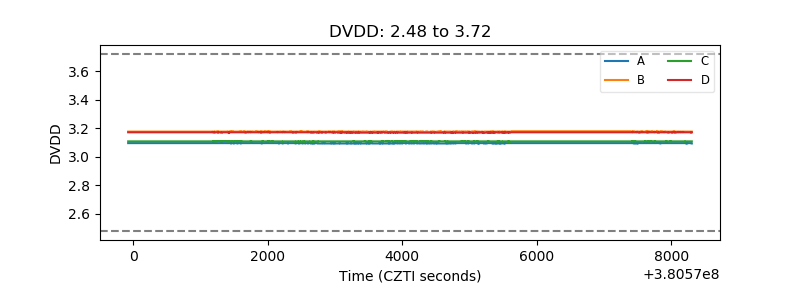 |
| Temperature 1 | 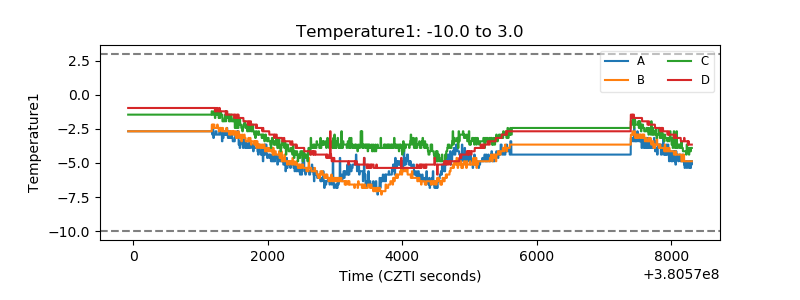 |
| Veto HV Monitor | 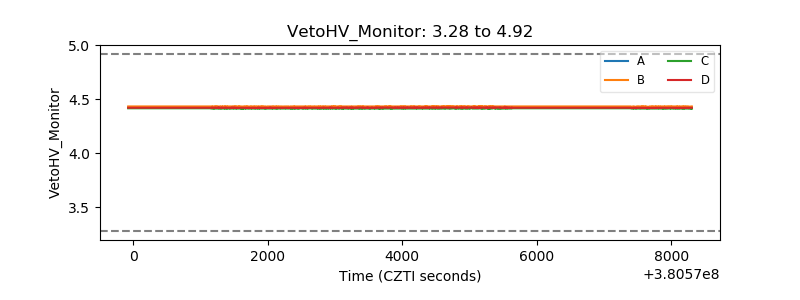 |
| Veto LLD | 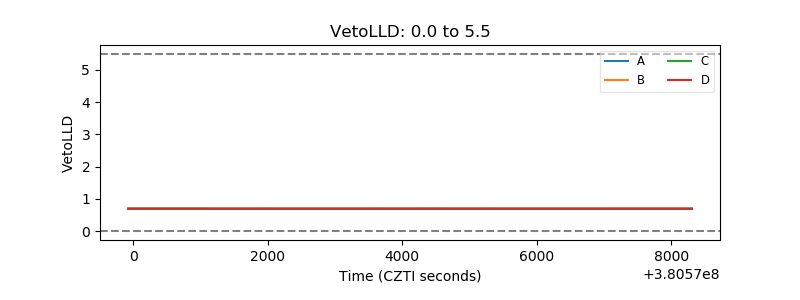 |
| Alpha Counter | 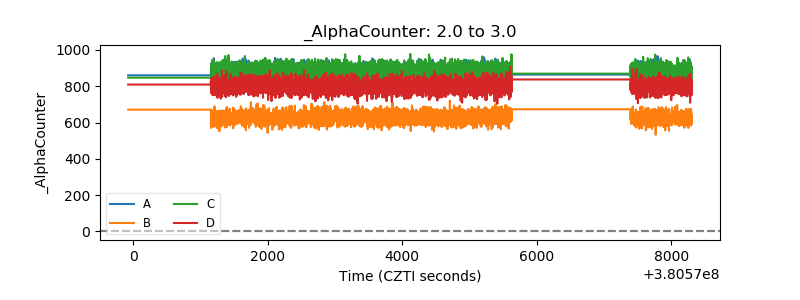 |
| _CPM_Rate | 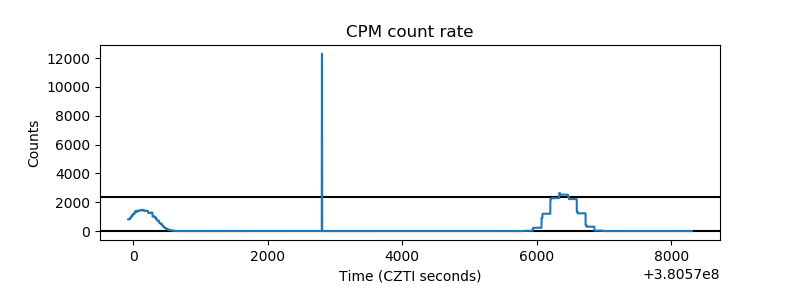 |
| CZT Counter | 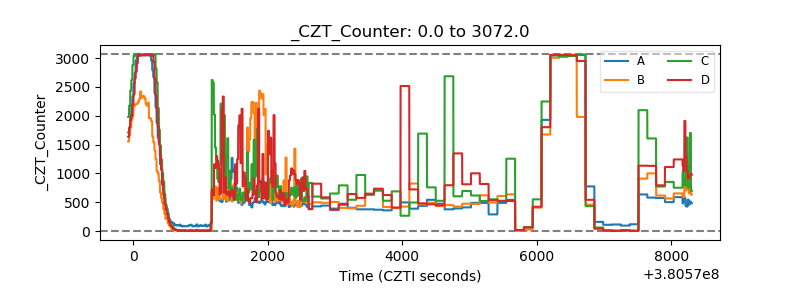 |
| +2.5 Volts monitor |  |
| +5 Volts monitor |  |
| _ROLL_ROT | 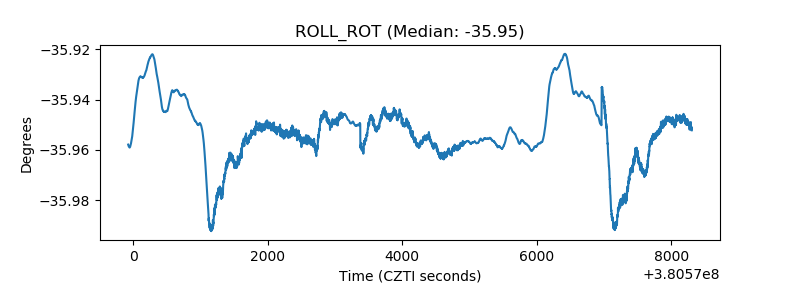 |
| _Roll_DEC | 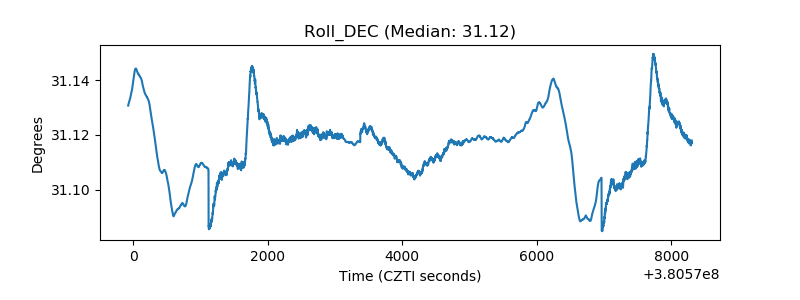 |
| _Roll_RA | 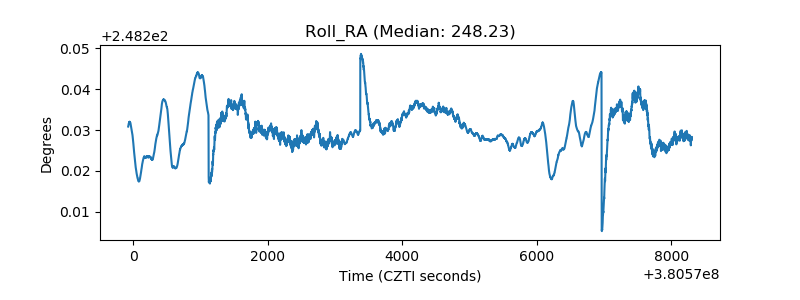 |
| Veto Counter | 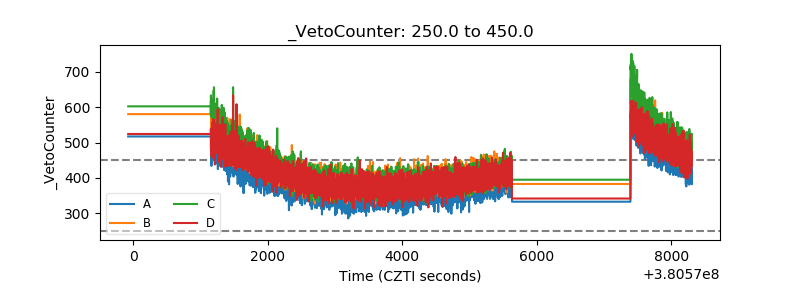 |